Tamar Island Bridge 3 repeat photo
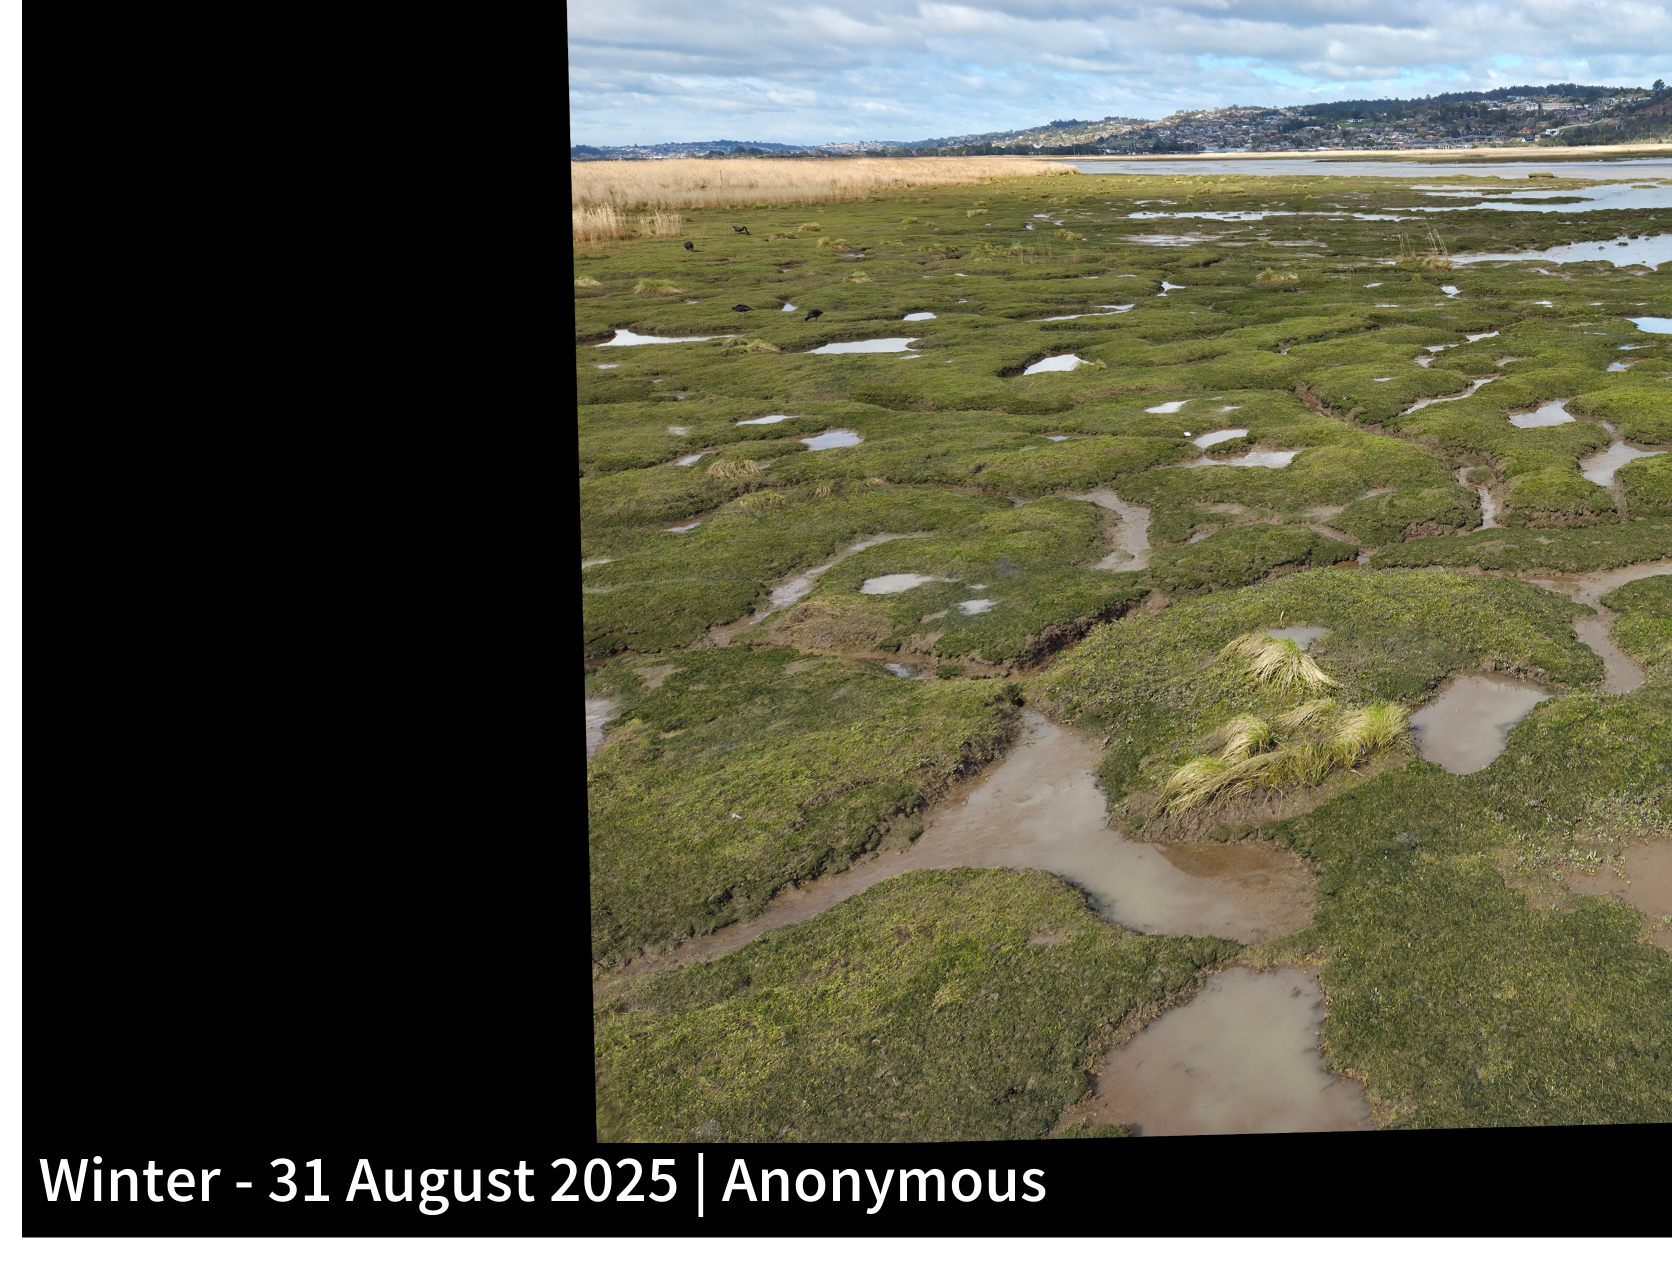
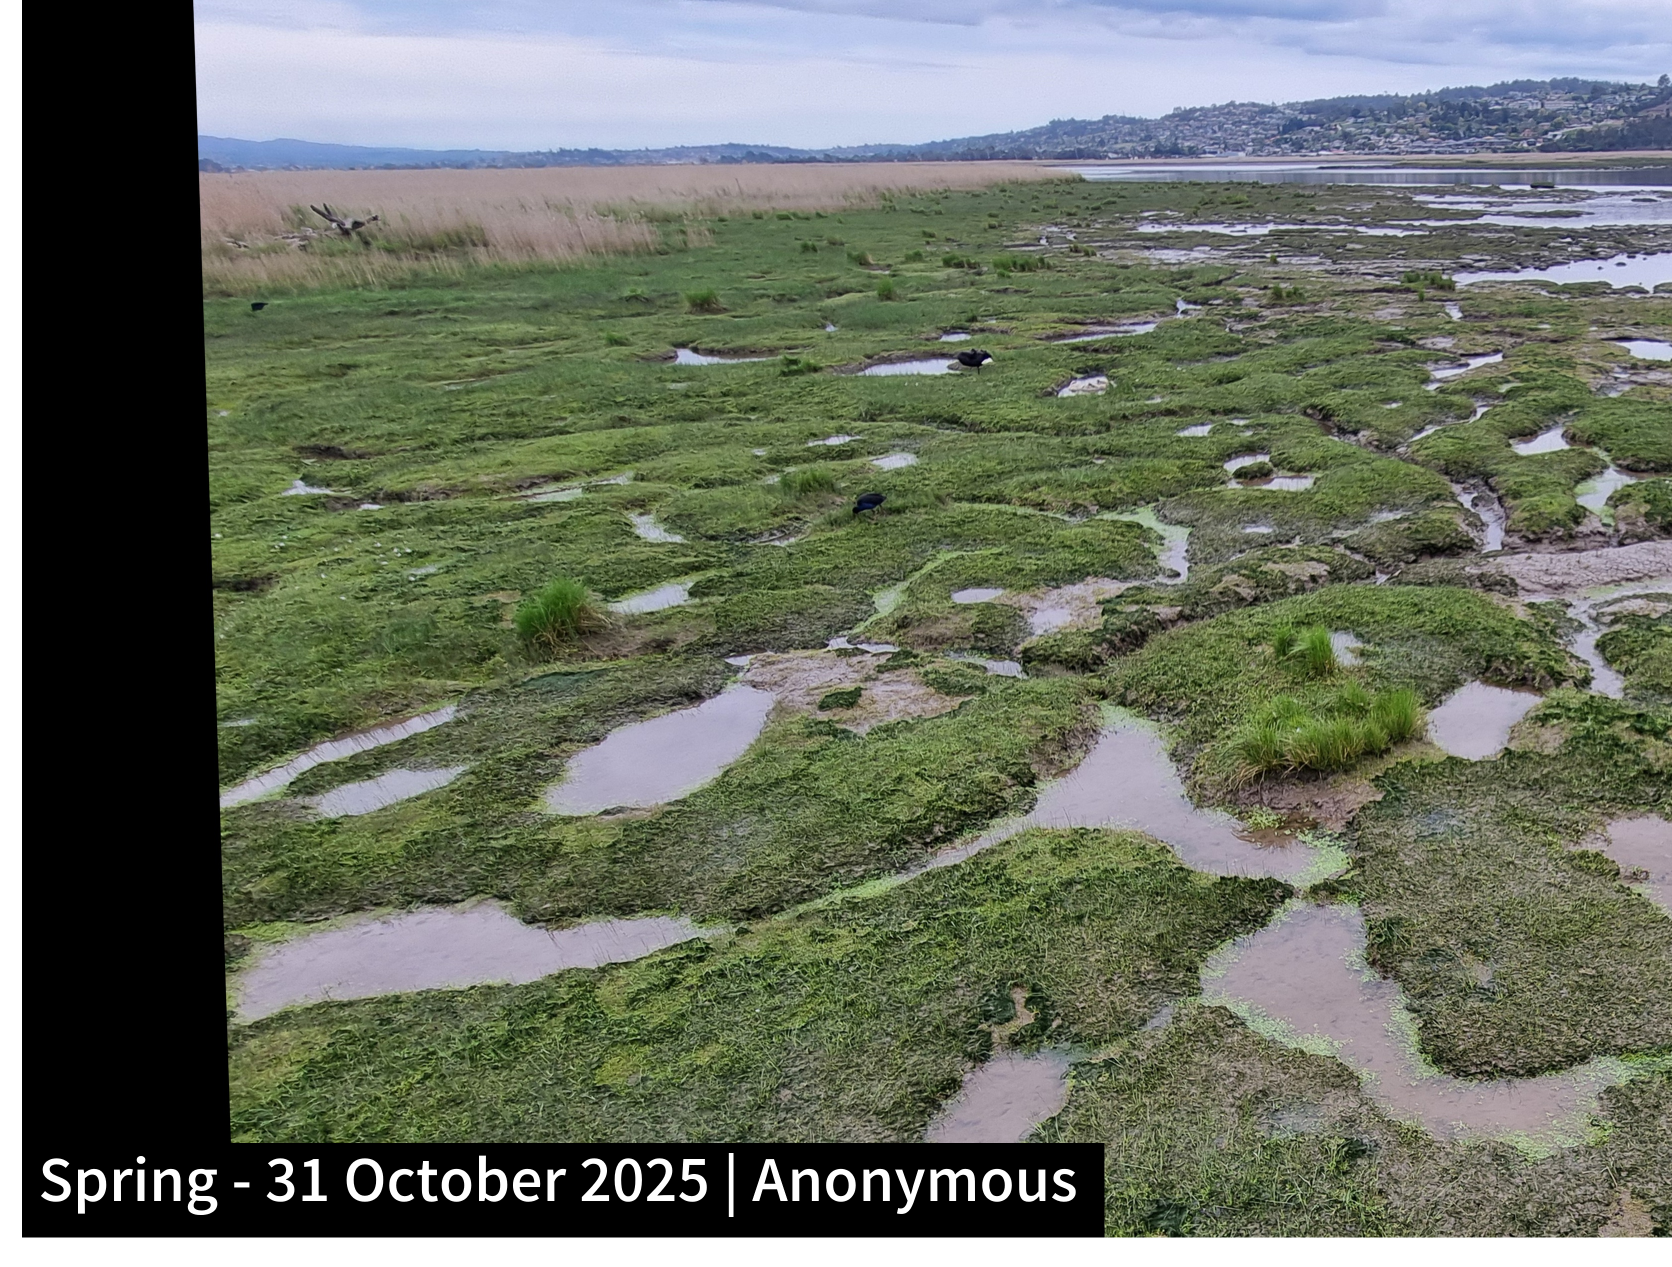
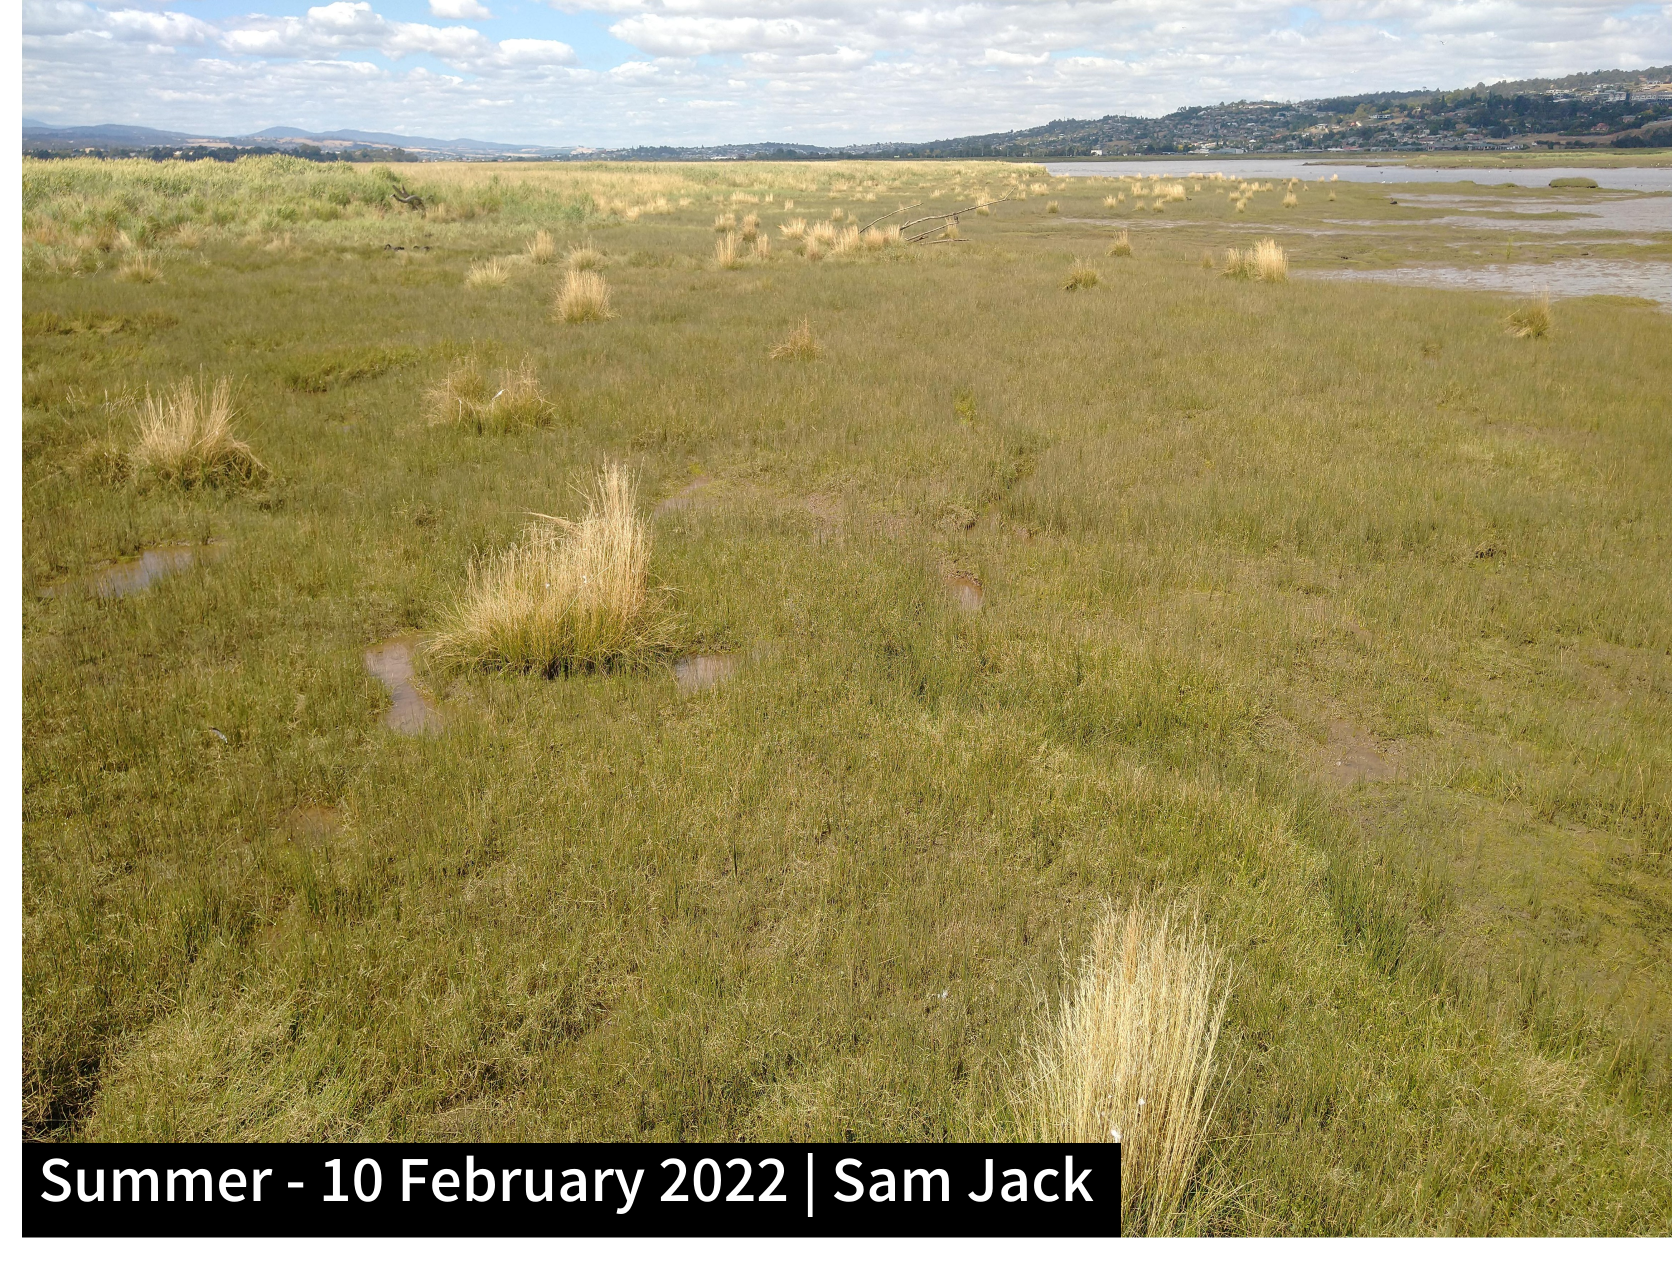
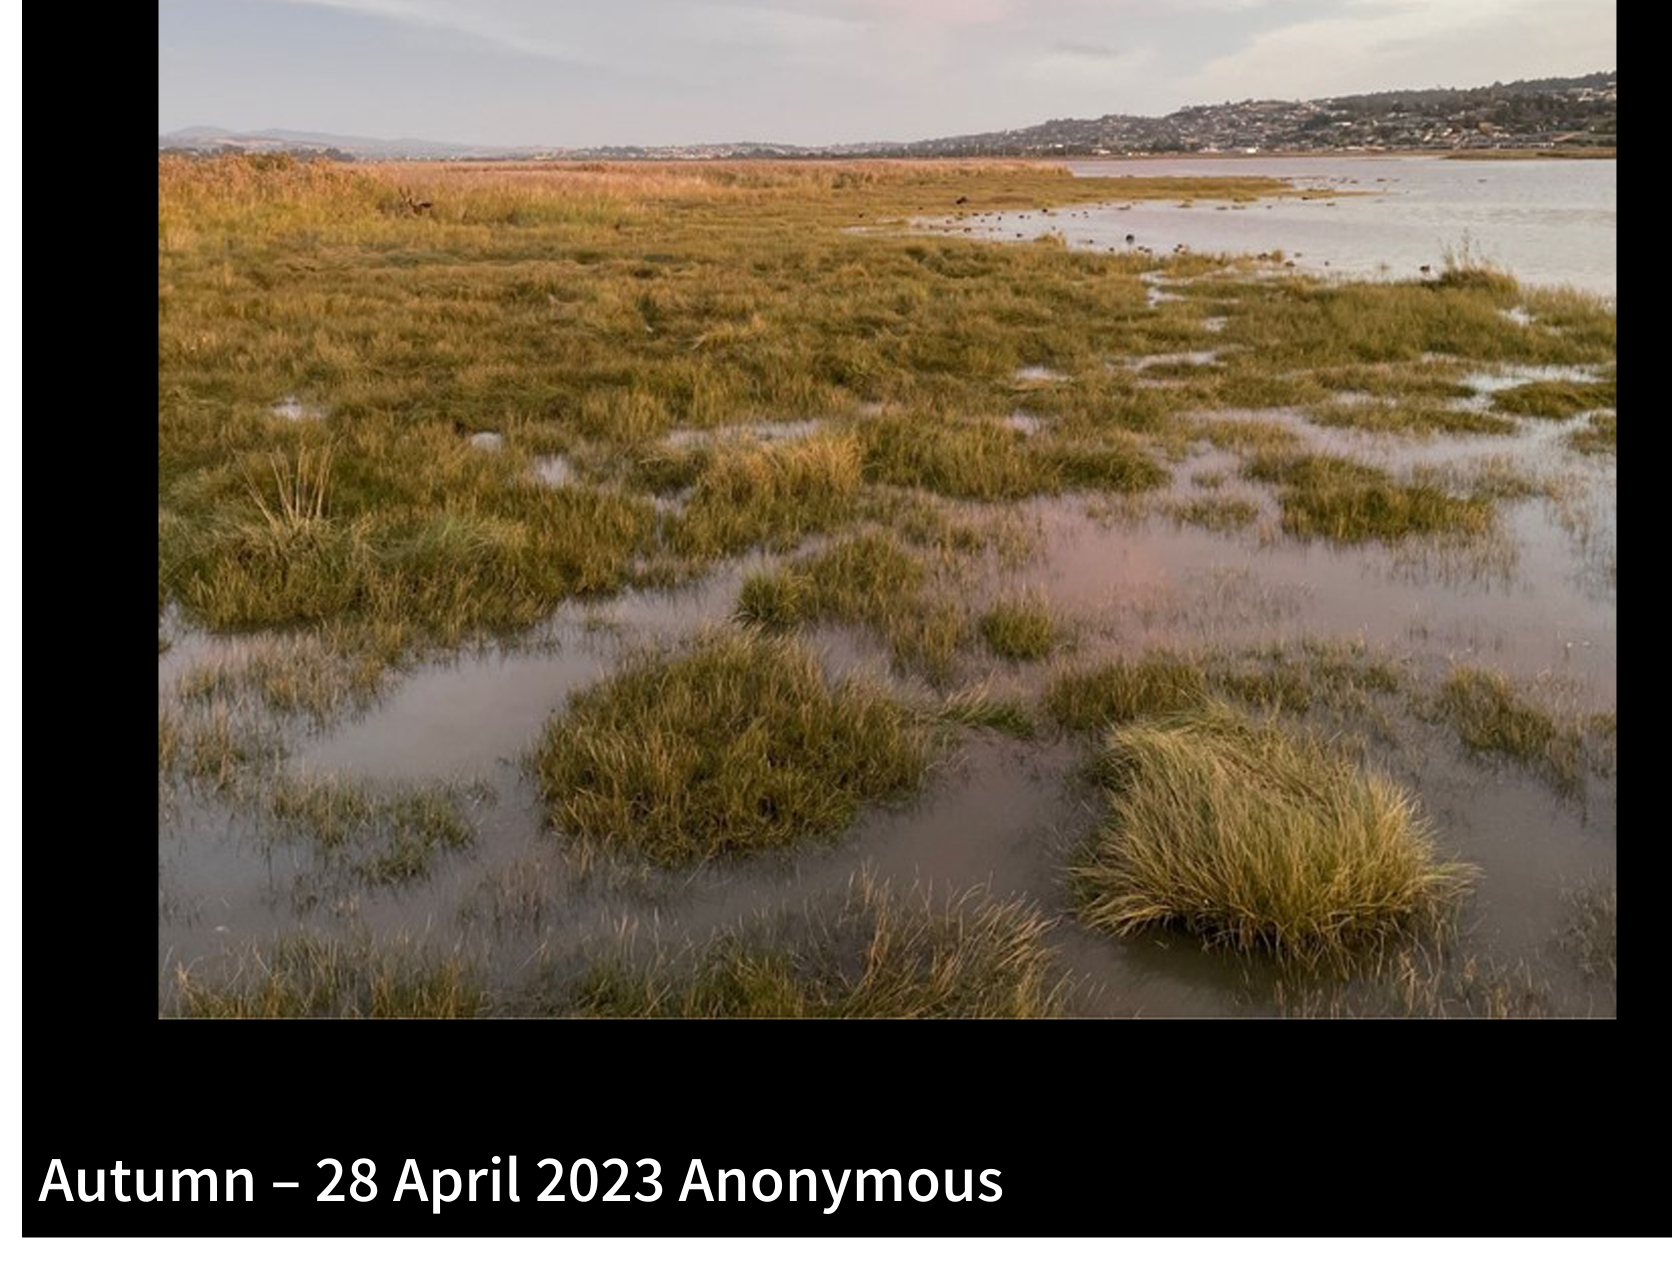
The Tamar Island Bridge 3 repeat photo site takes in a view of the muddy intertidal zone to the south of the bridge, dominated by creeping brookweed (Samolus repens), common spikesedge (Eleocharis acuta), and other herbs, sedges, rushes and grasses.
This photo-post tracks seasonal changes in grazing pressure as a result of the large population of ducks and other shorebirds that feed at the Tamar Island wetlands. We’re also interested in any vegetation or mudflats changes that may result from sea level rise, variable water quality, and erosion.
Check out the selection of photos below that have been submitted for this, our most popular repeat photo site, and contribute your own!
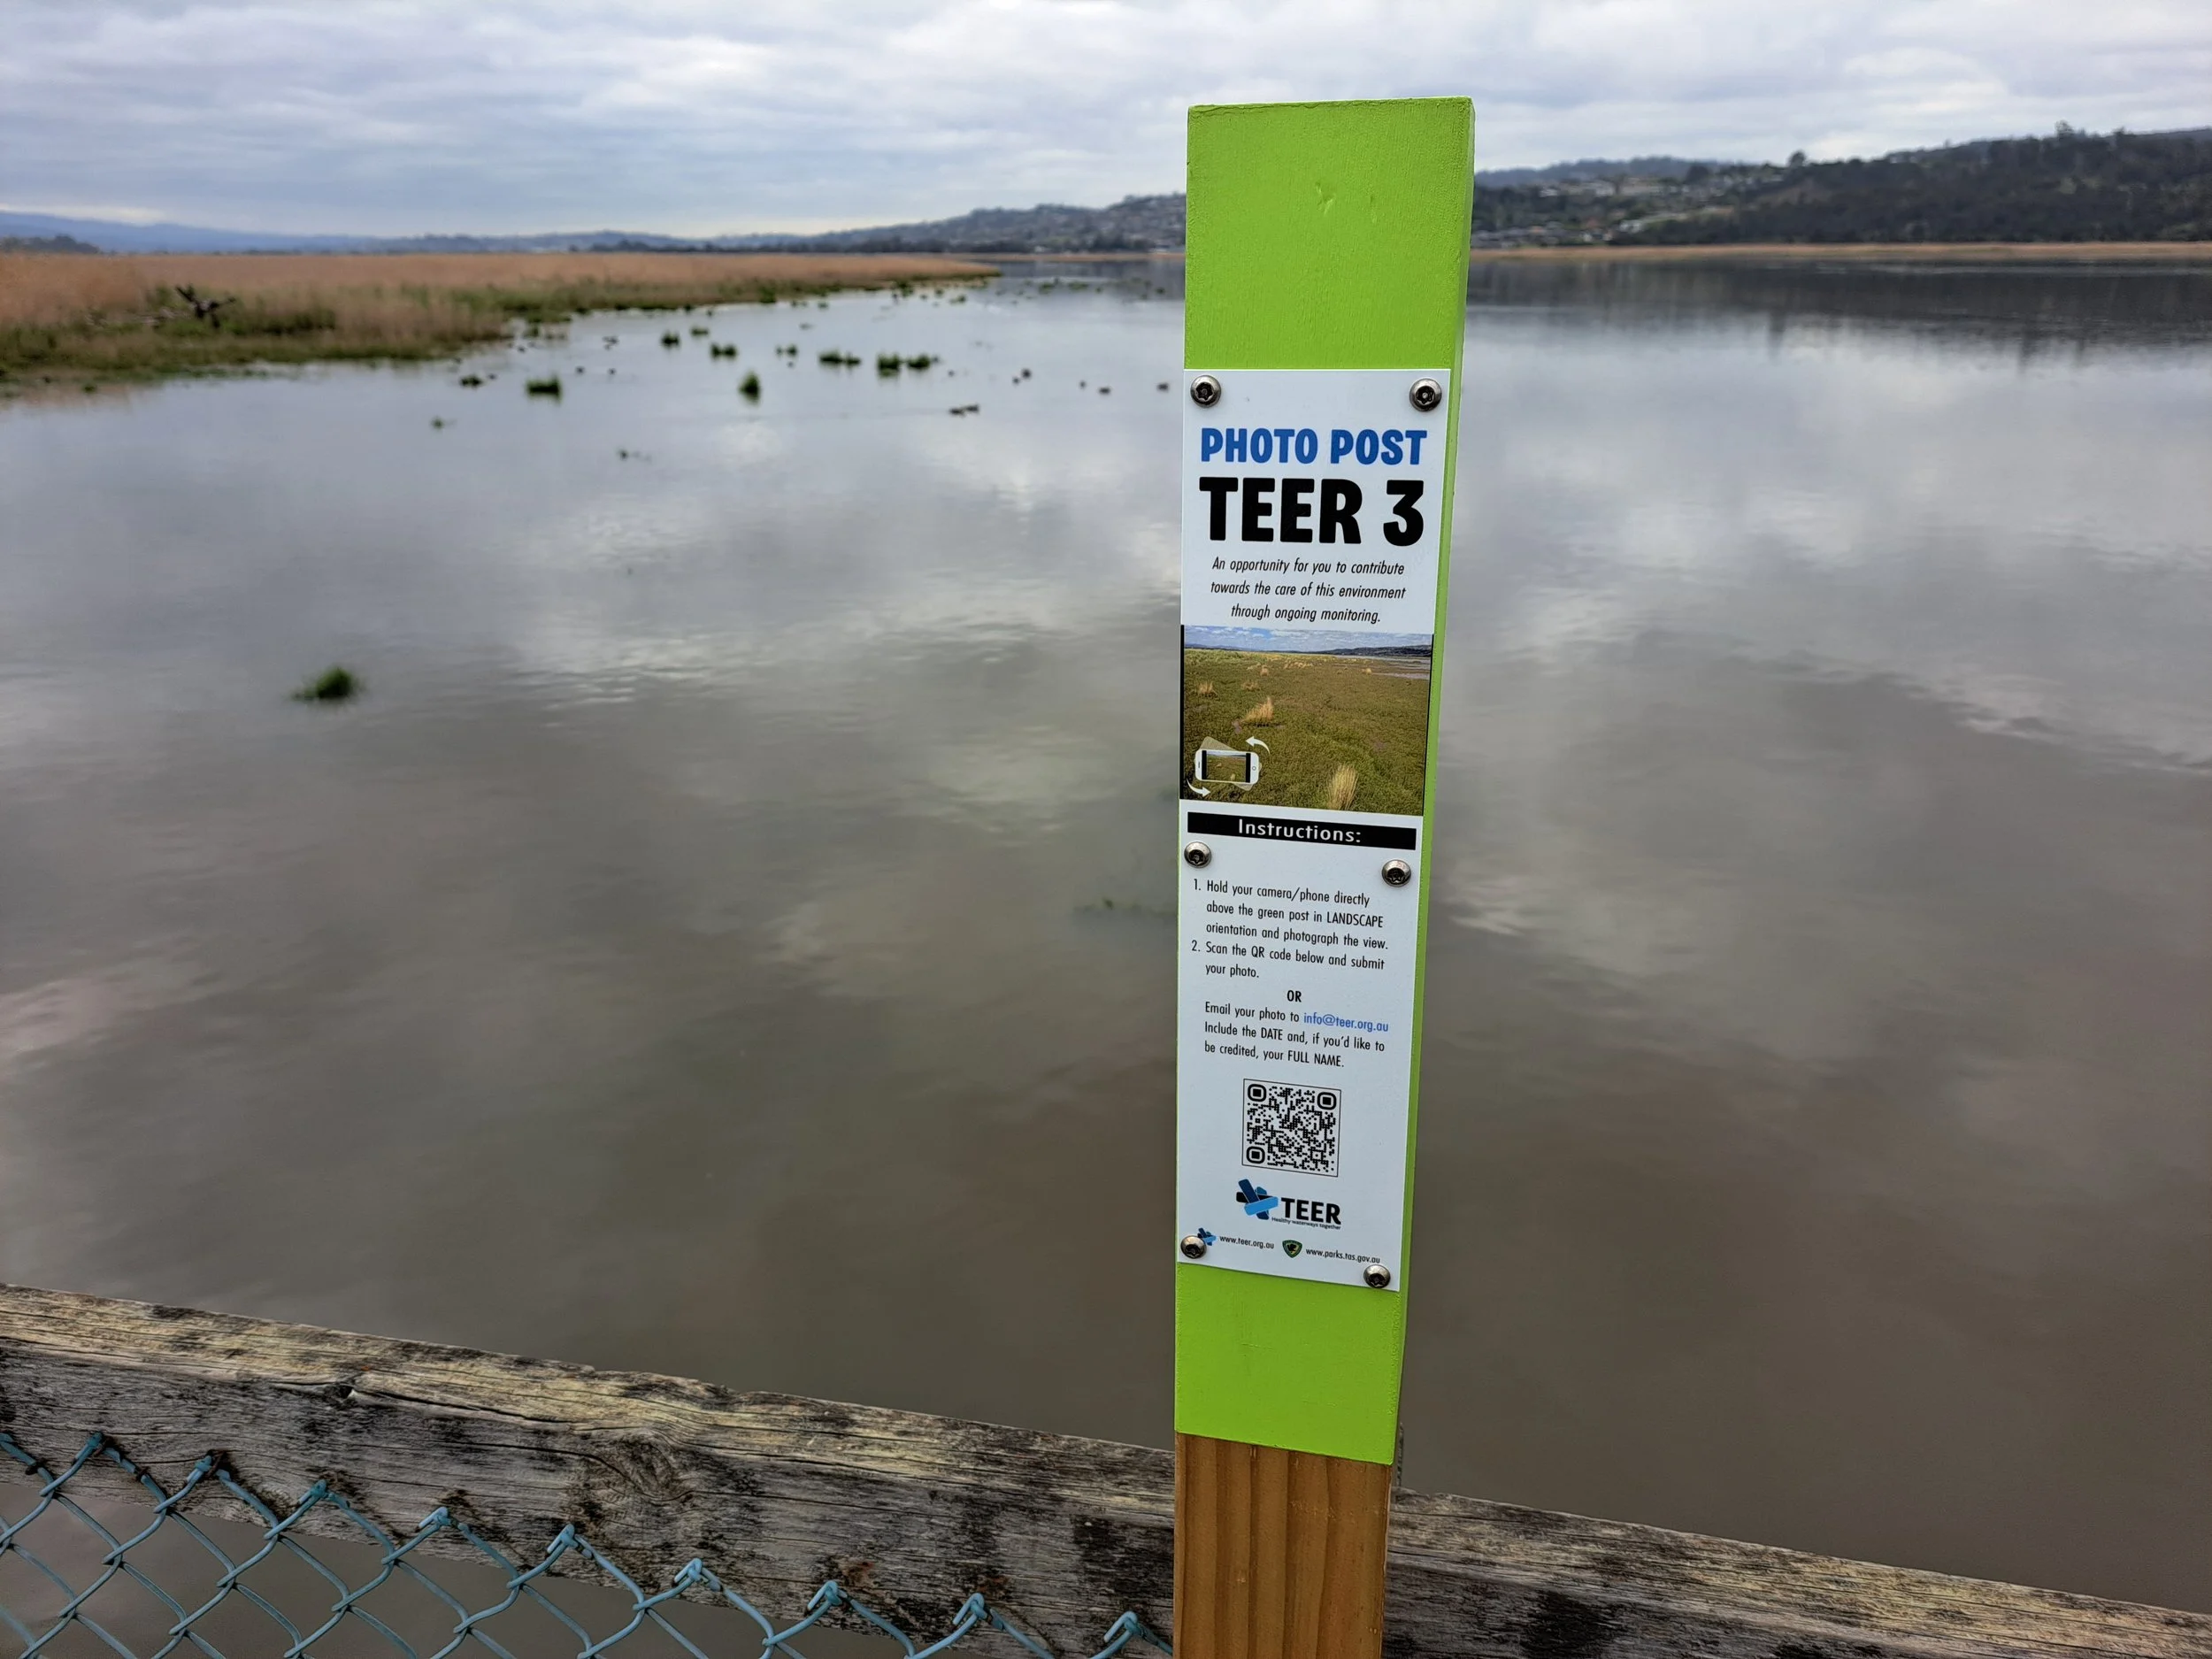
Tamar Island Bridge 3 repeat photo post.
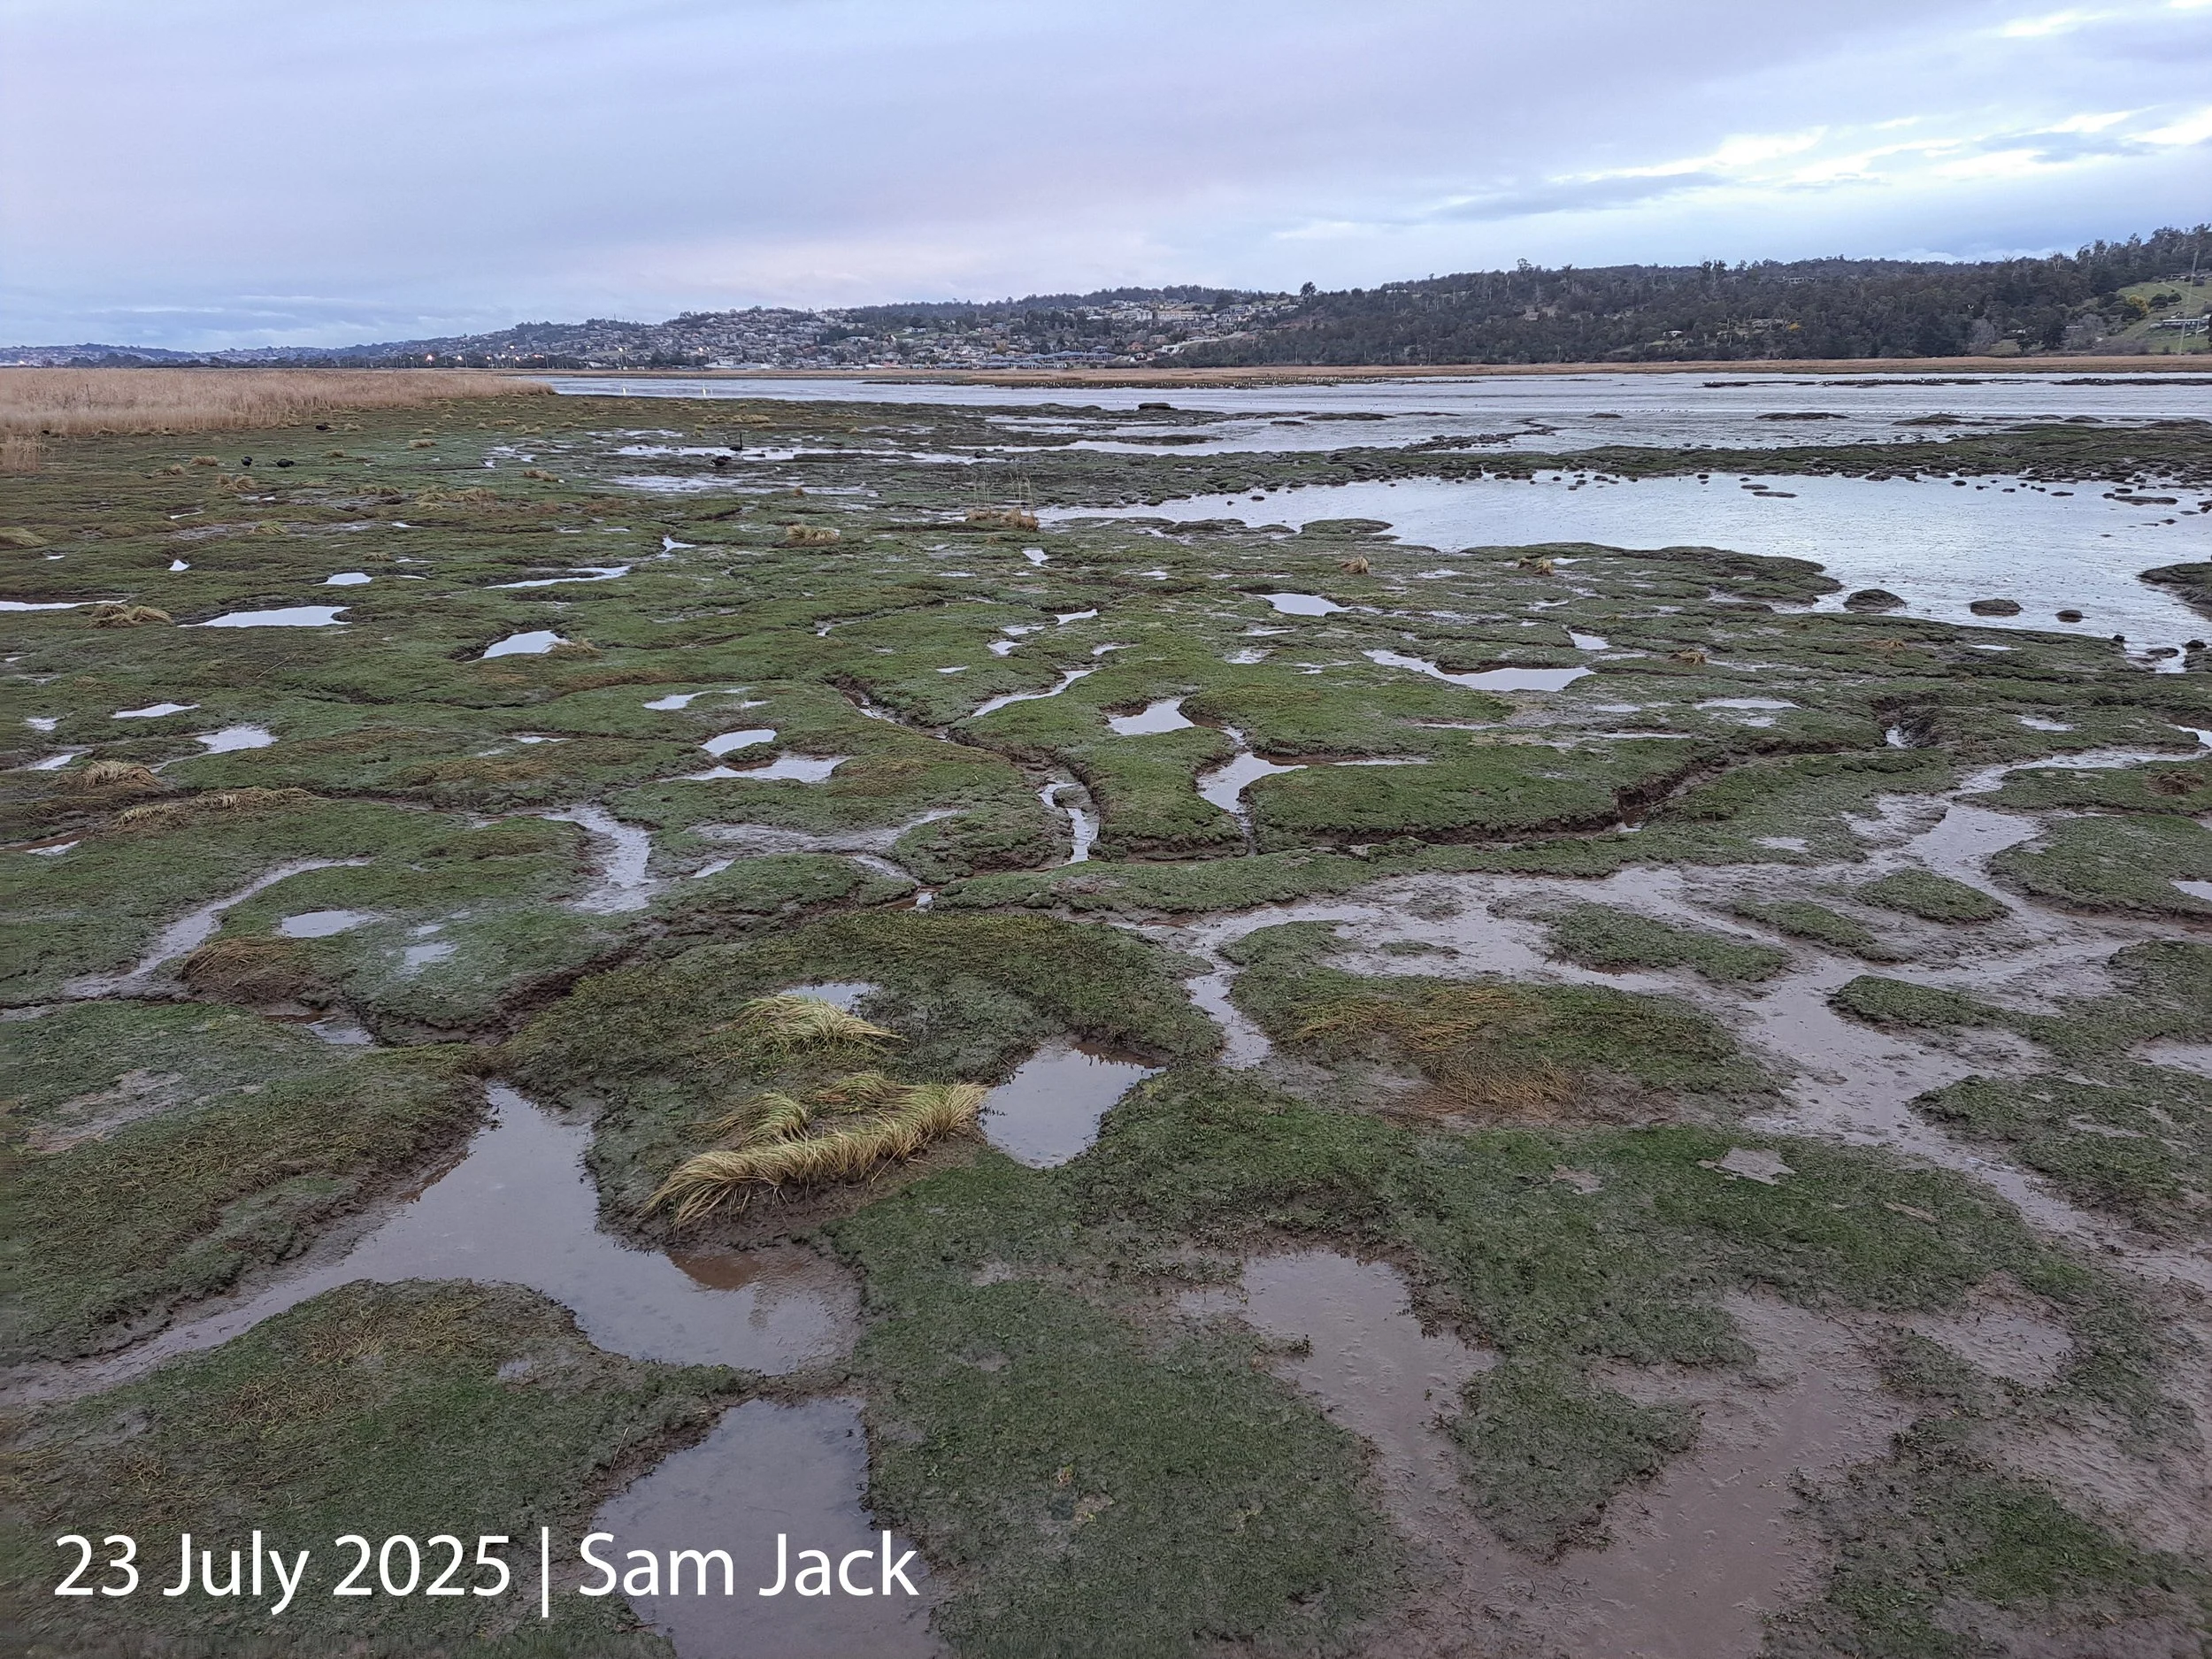
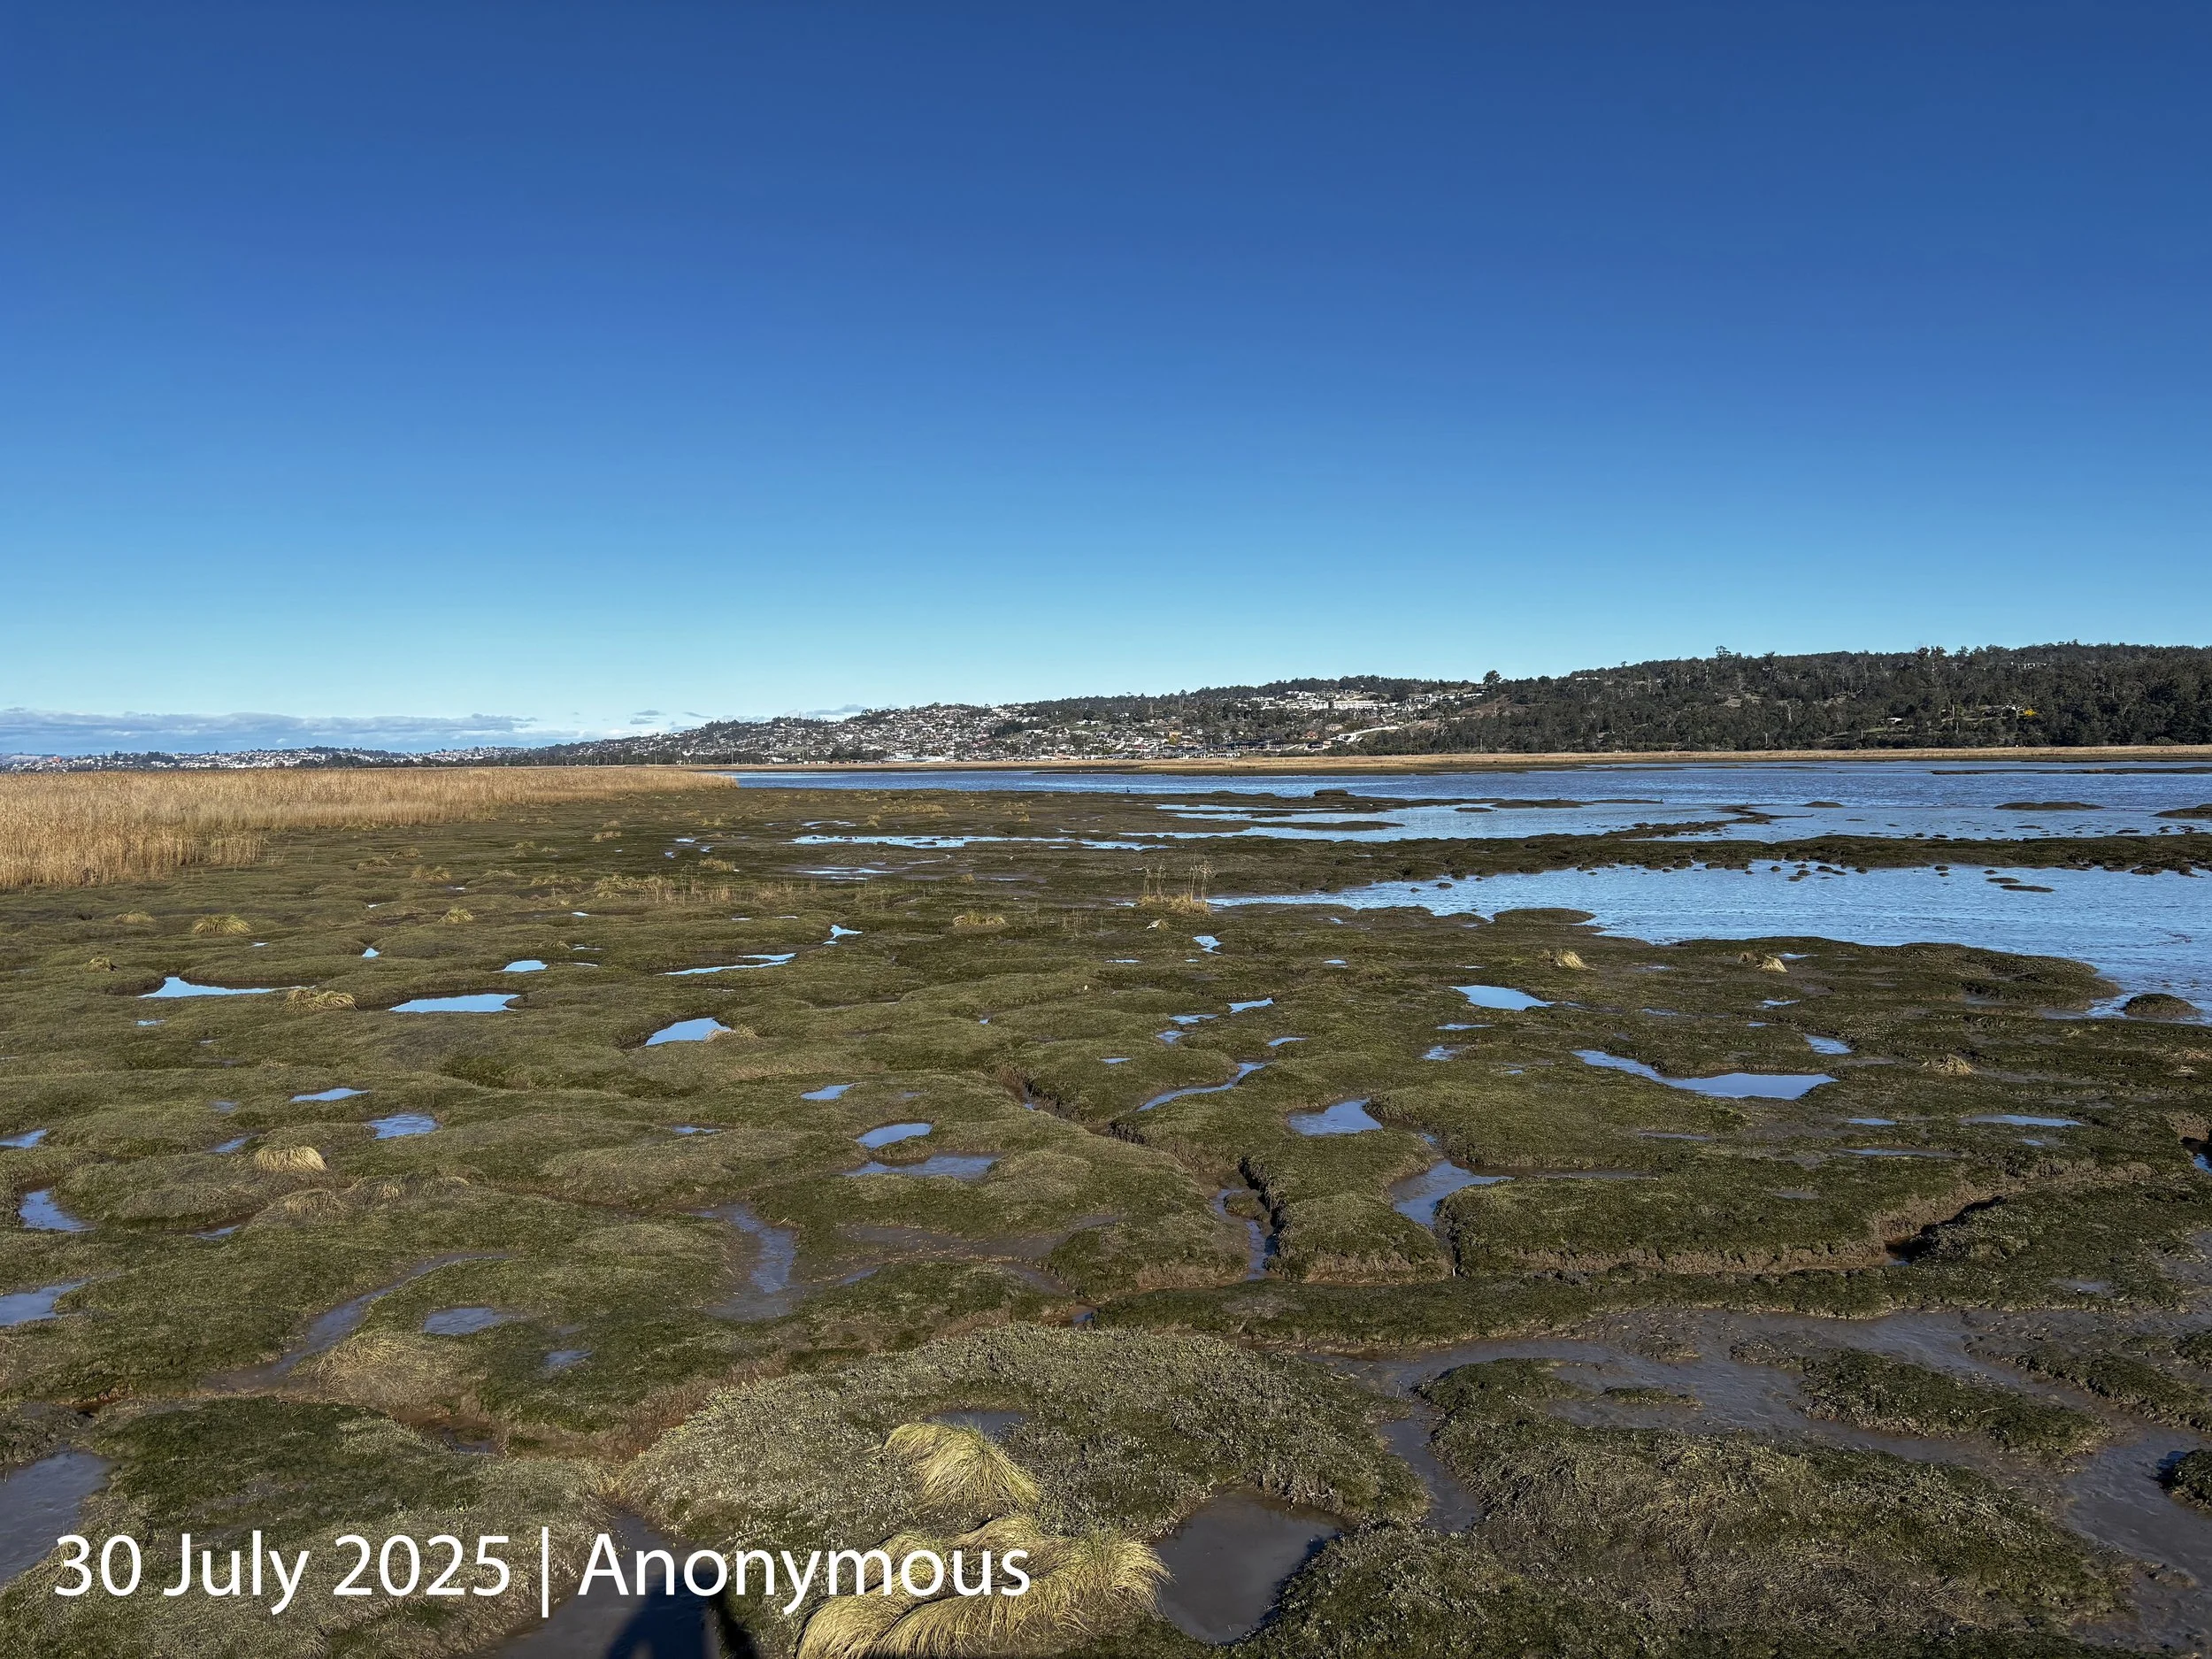
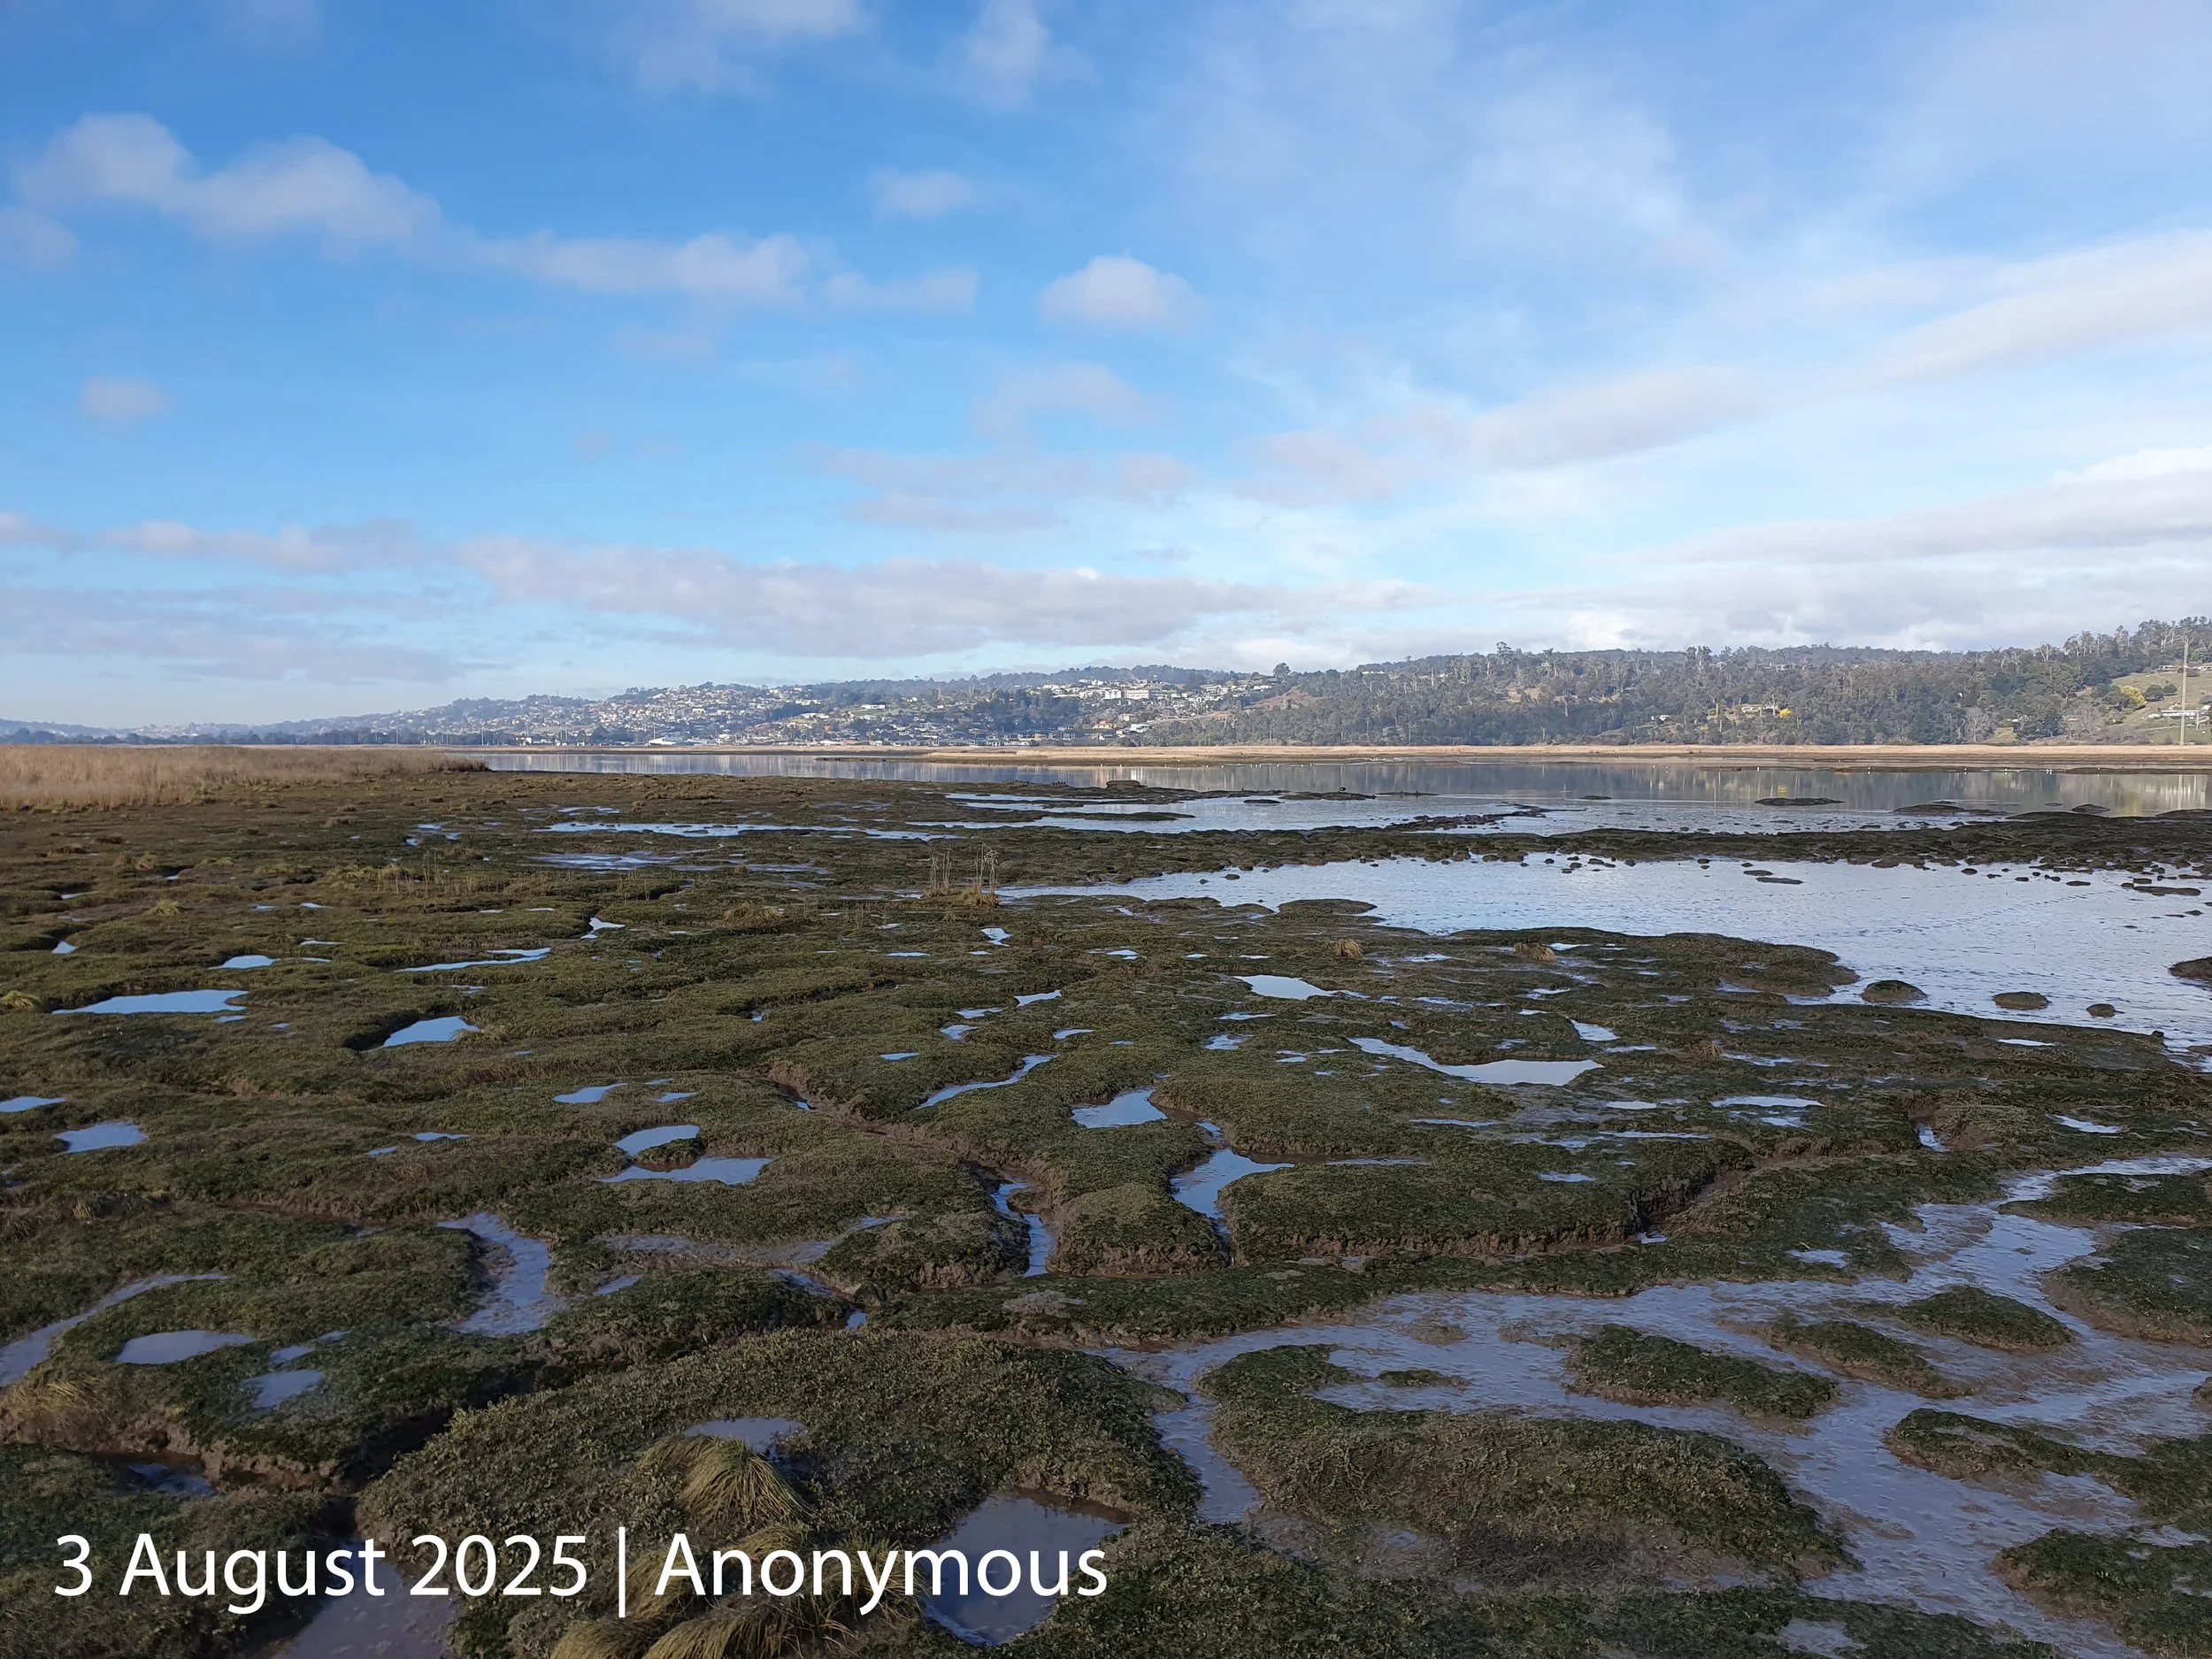
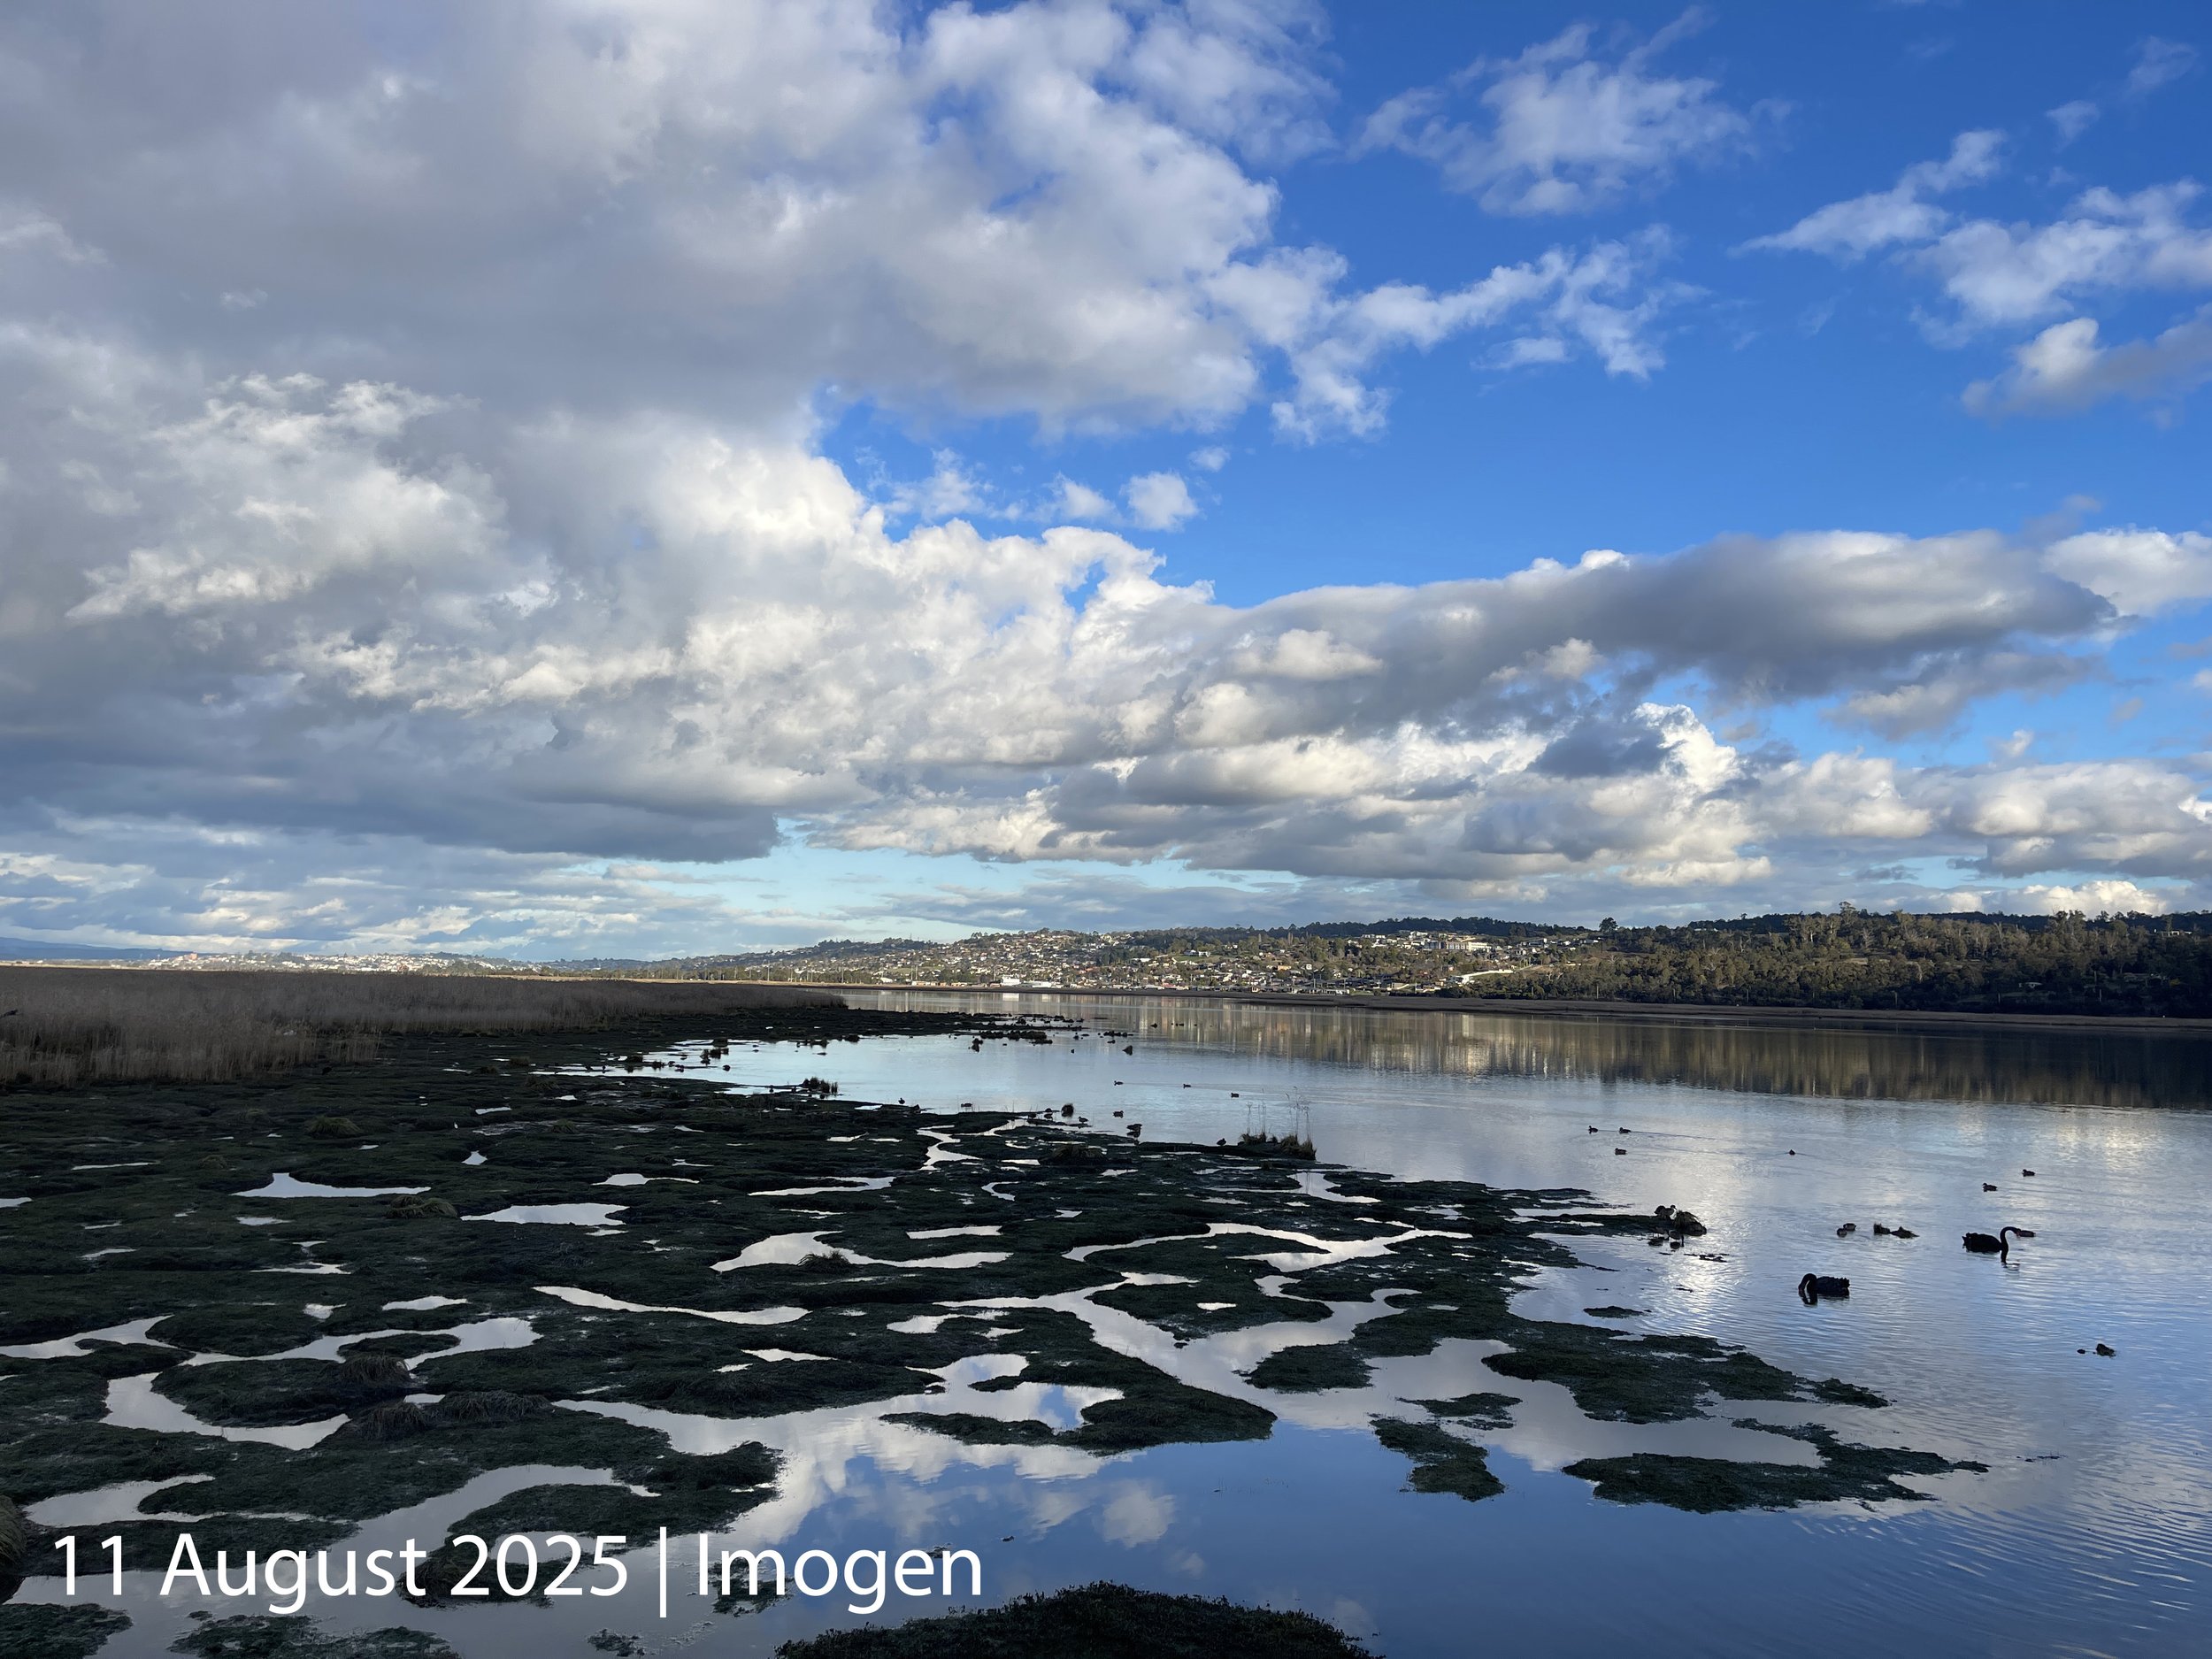
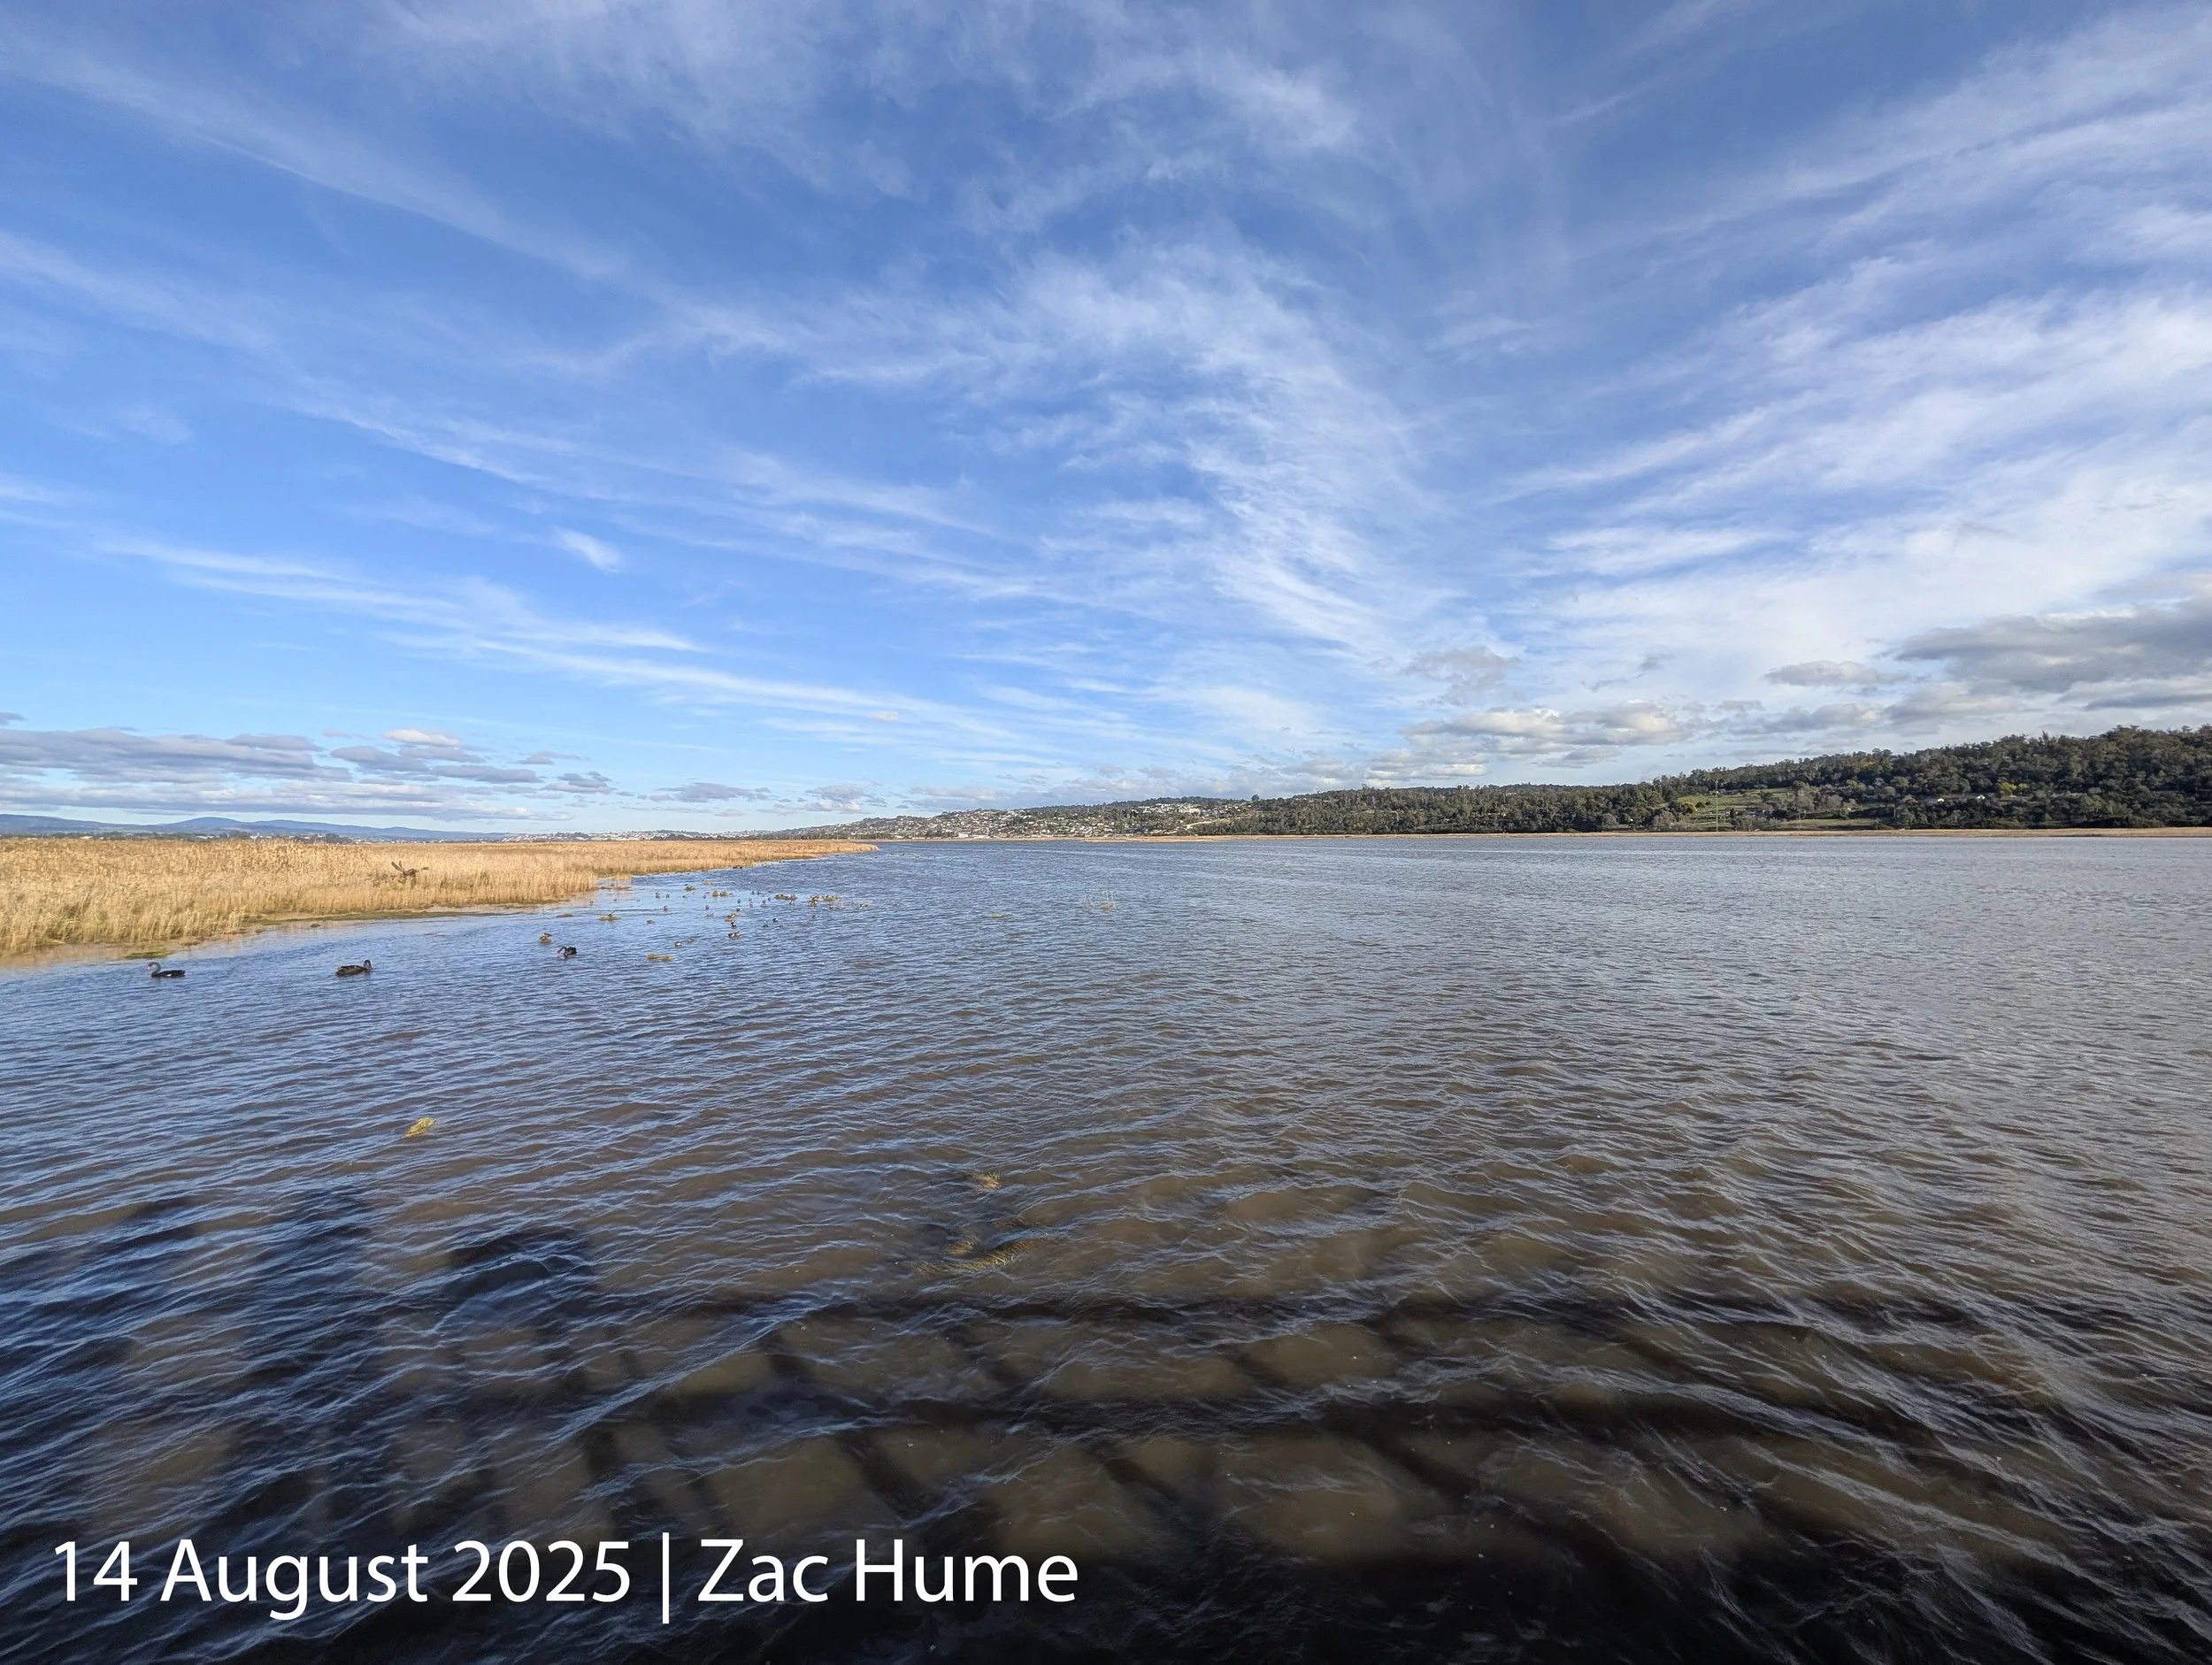
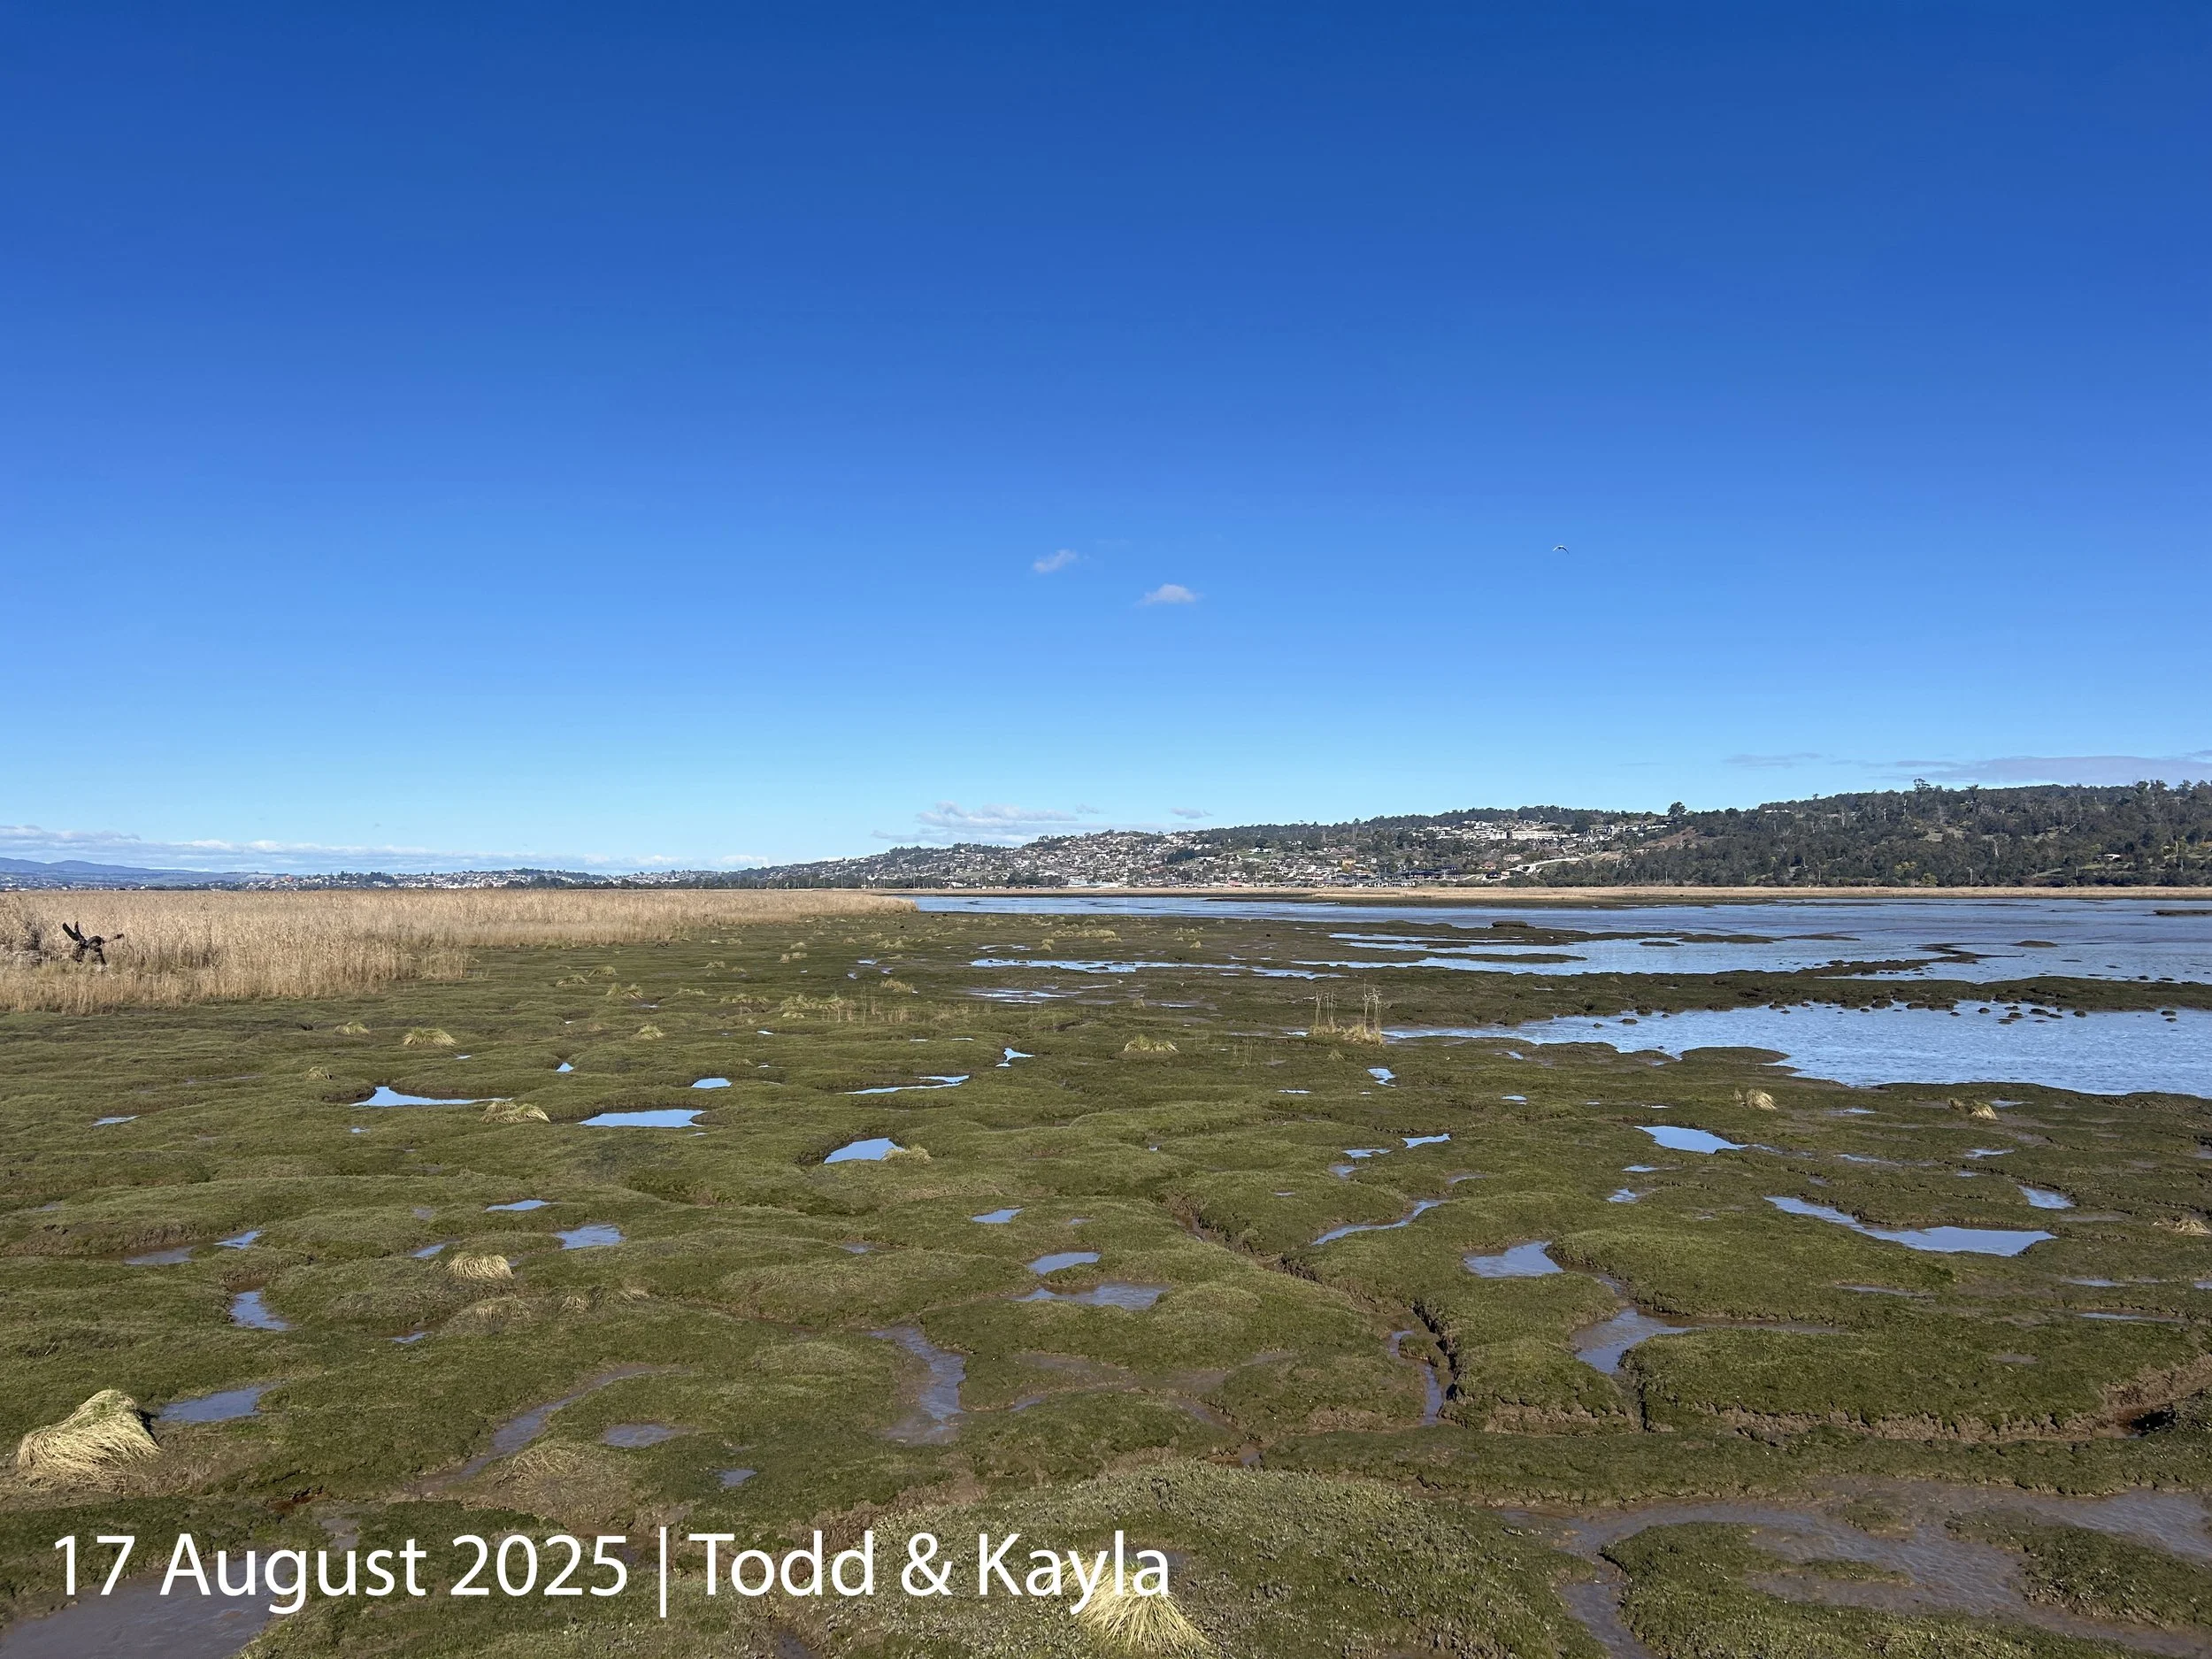
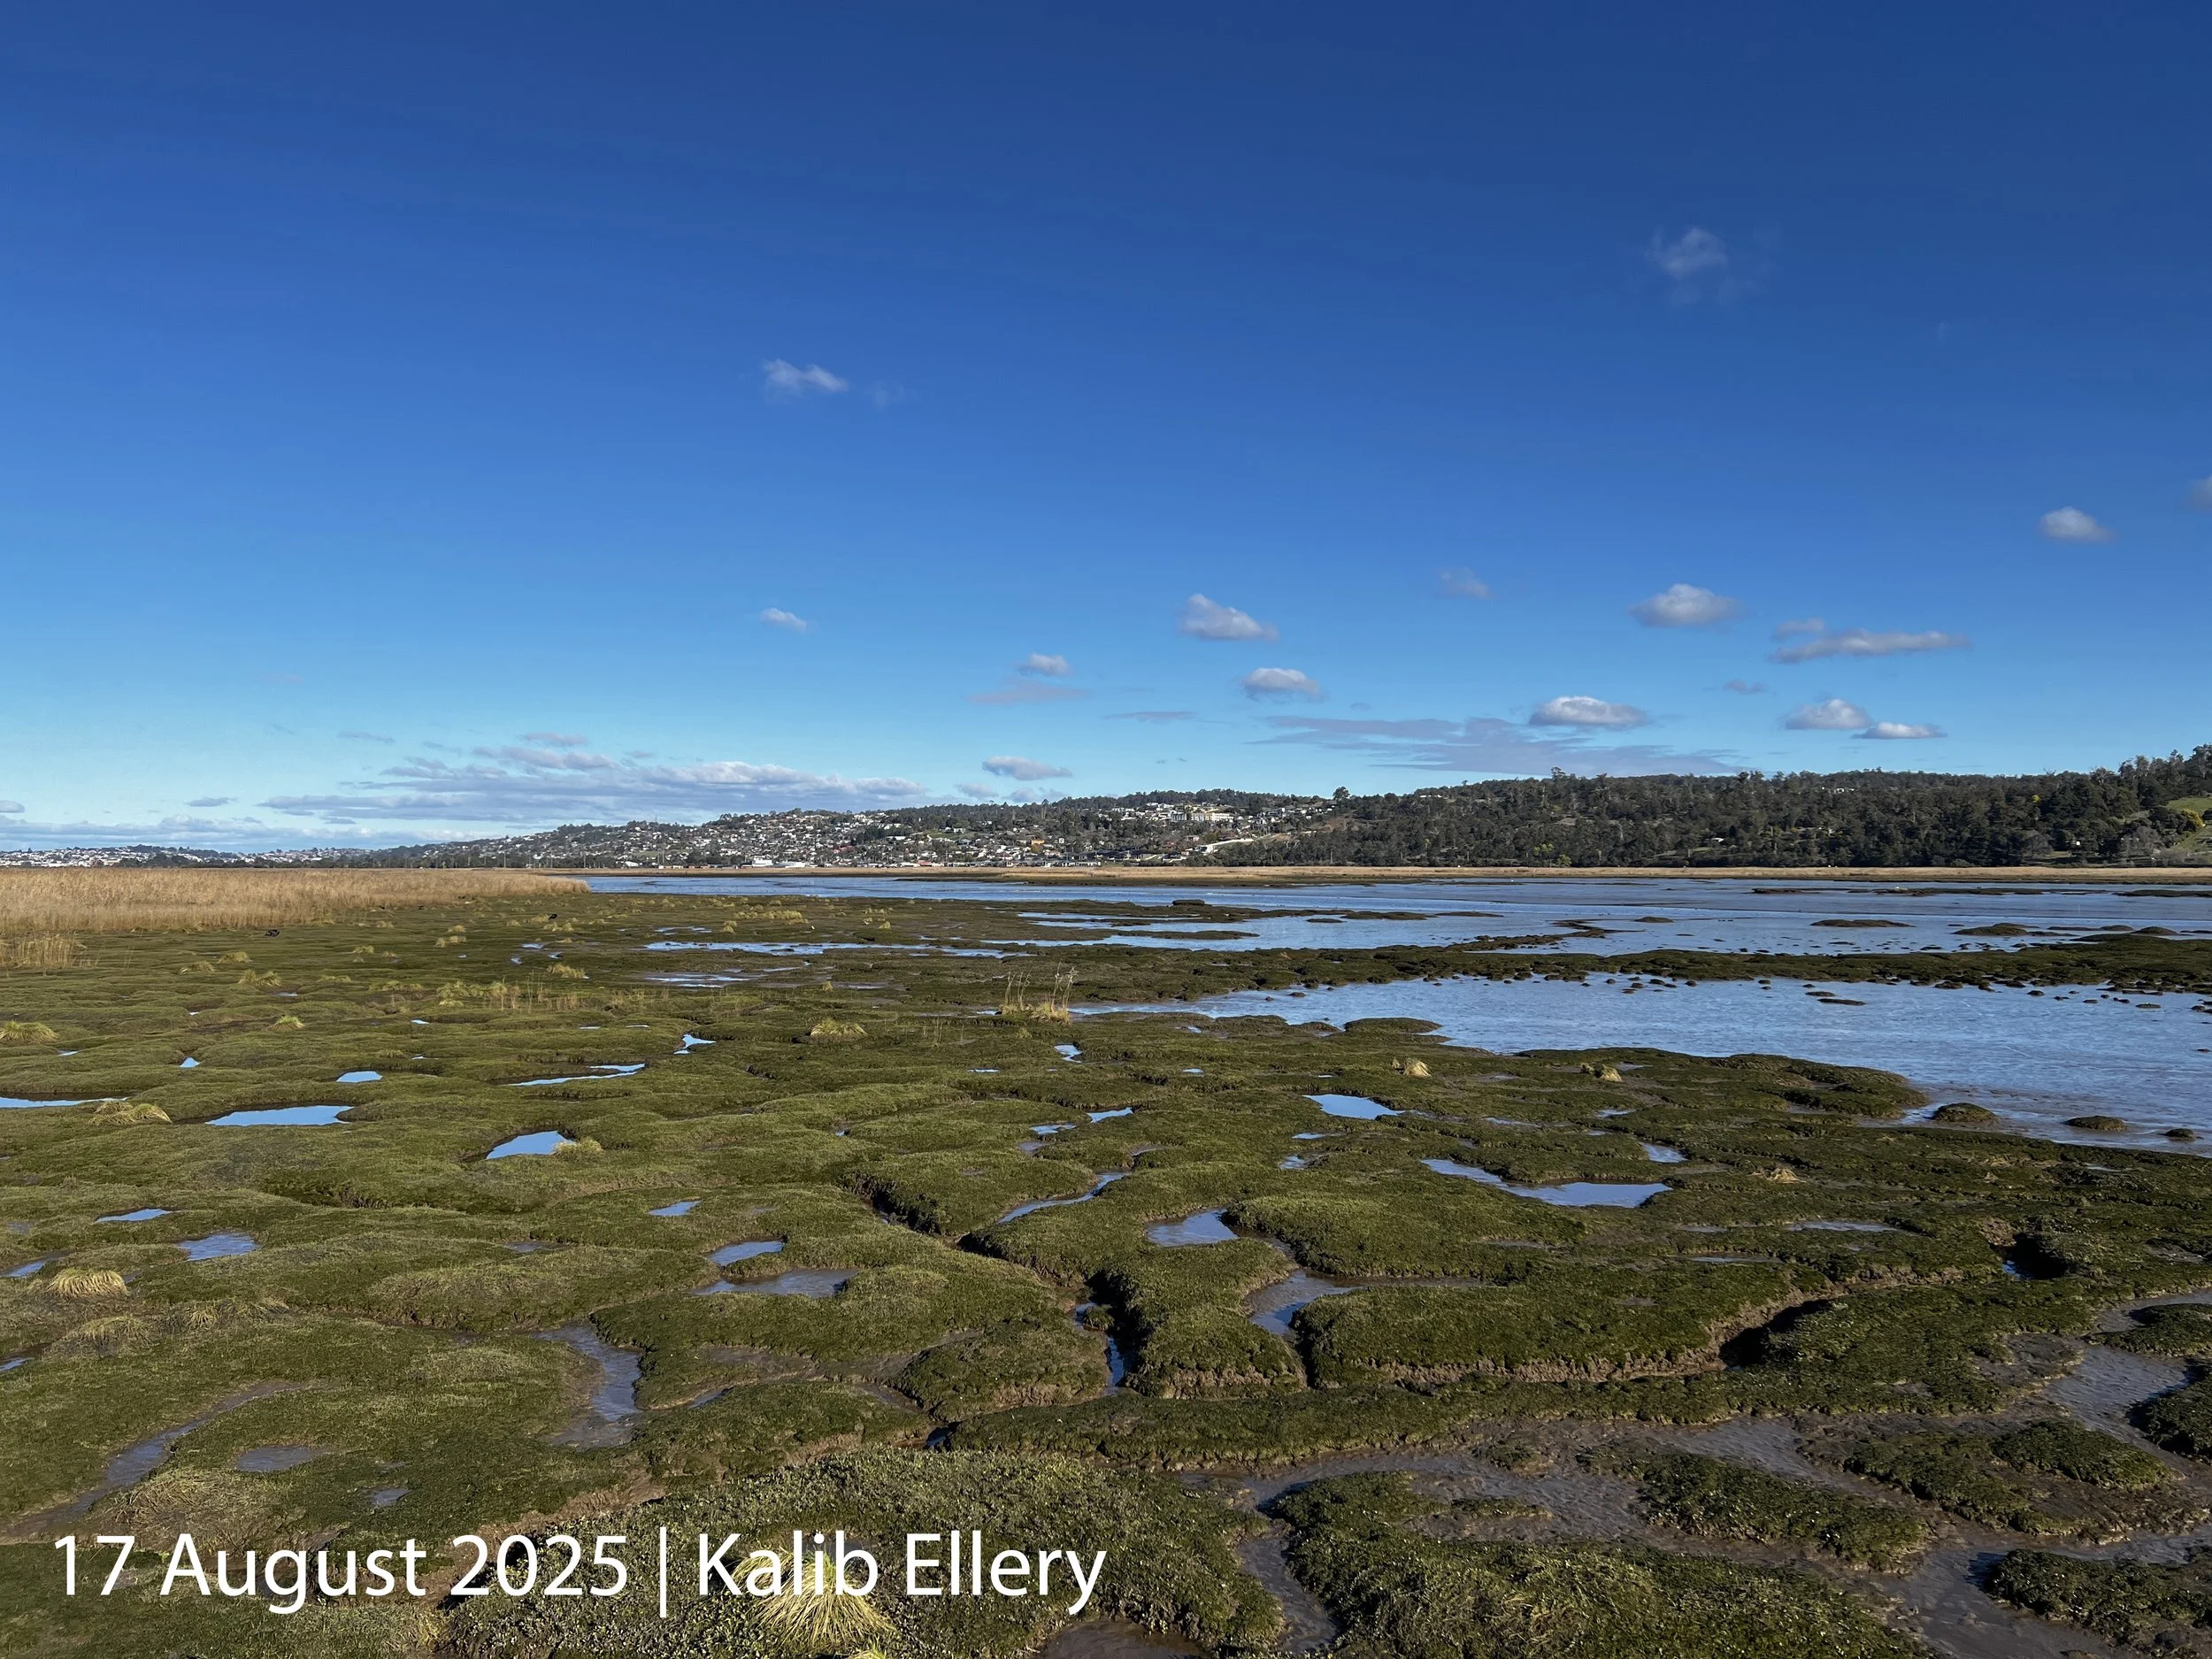
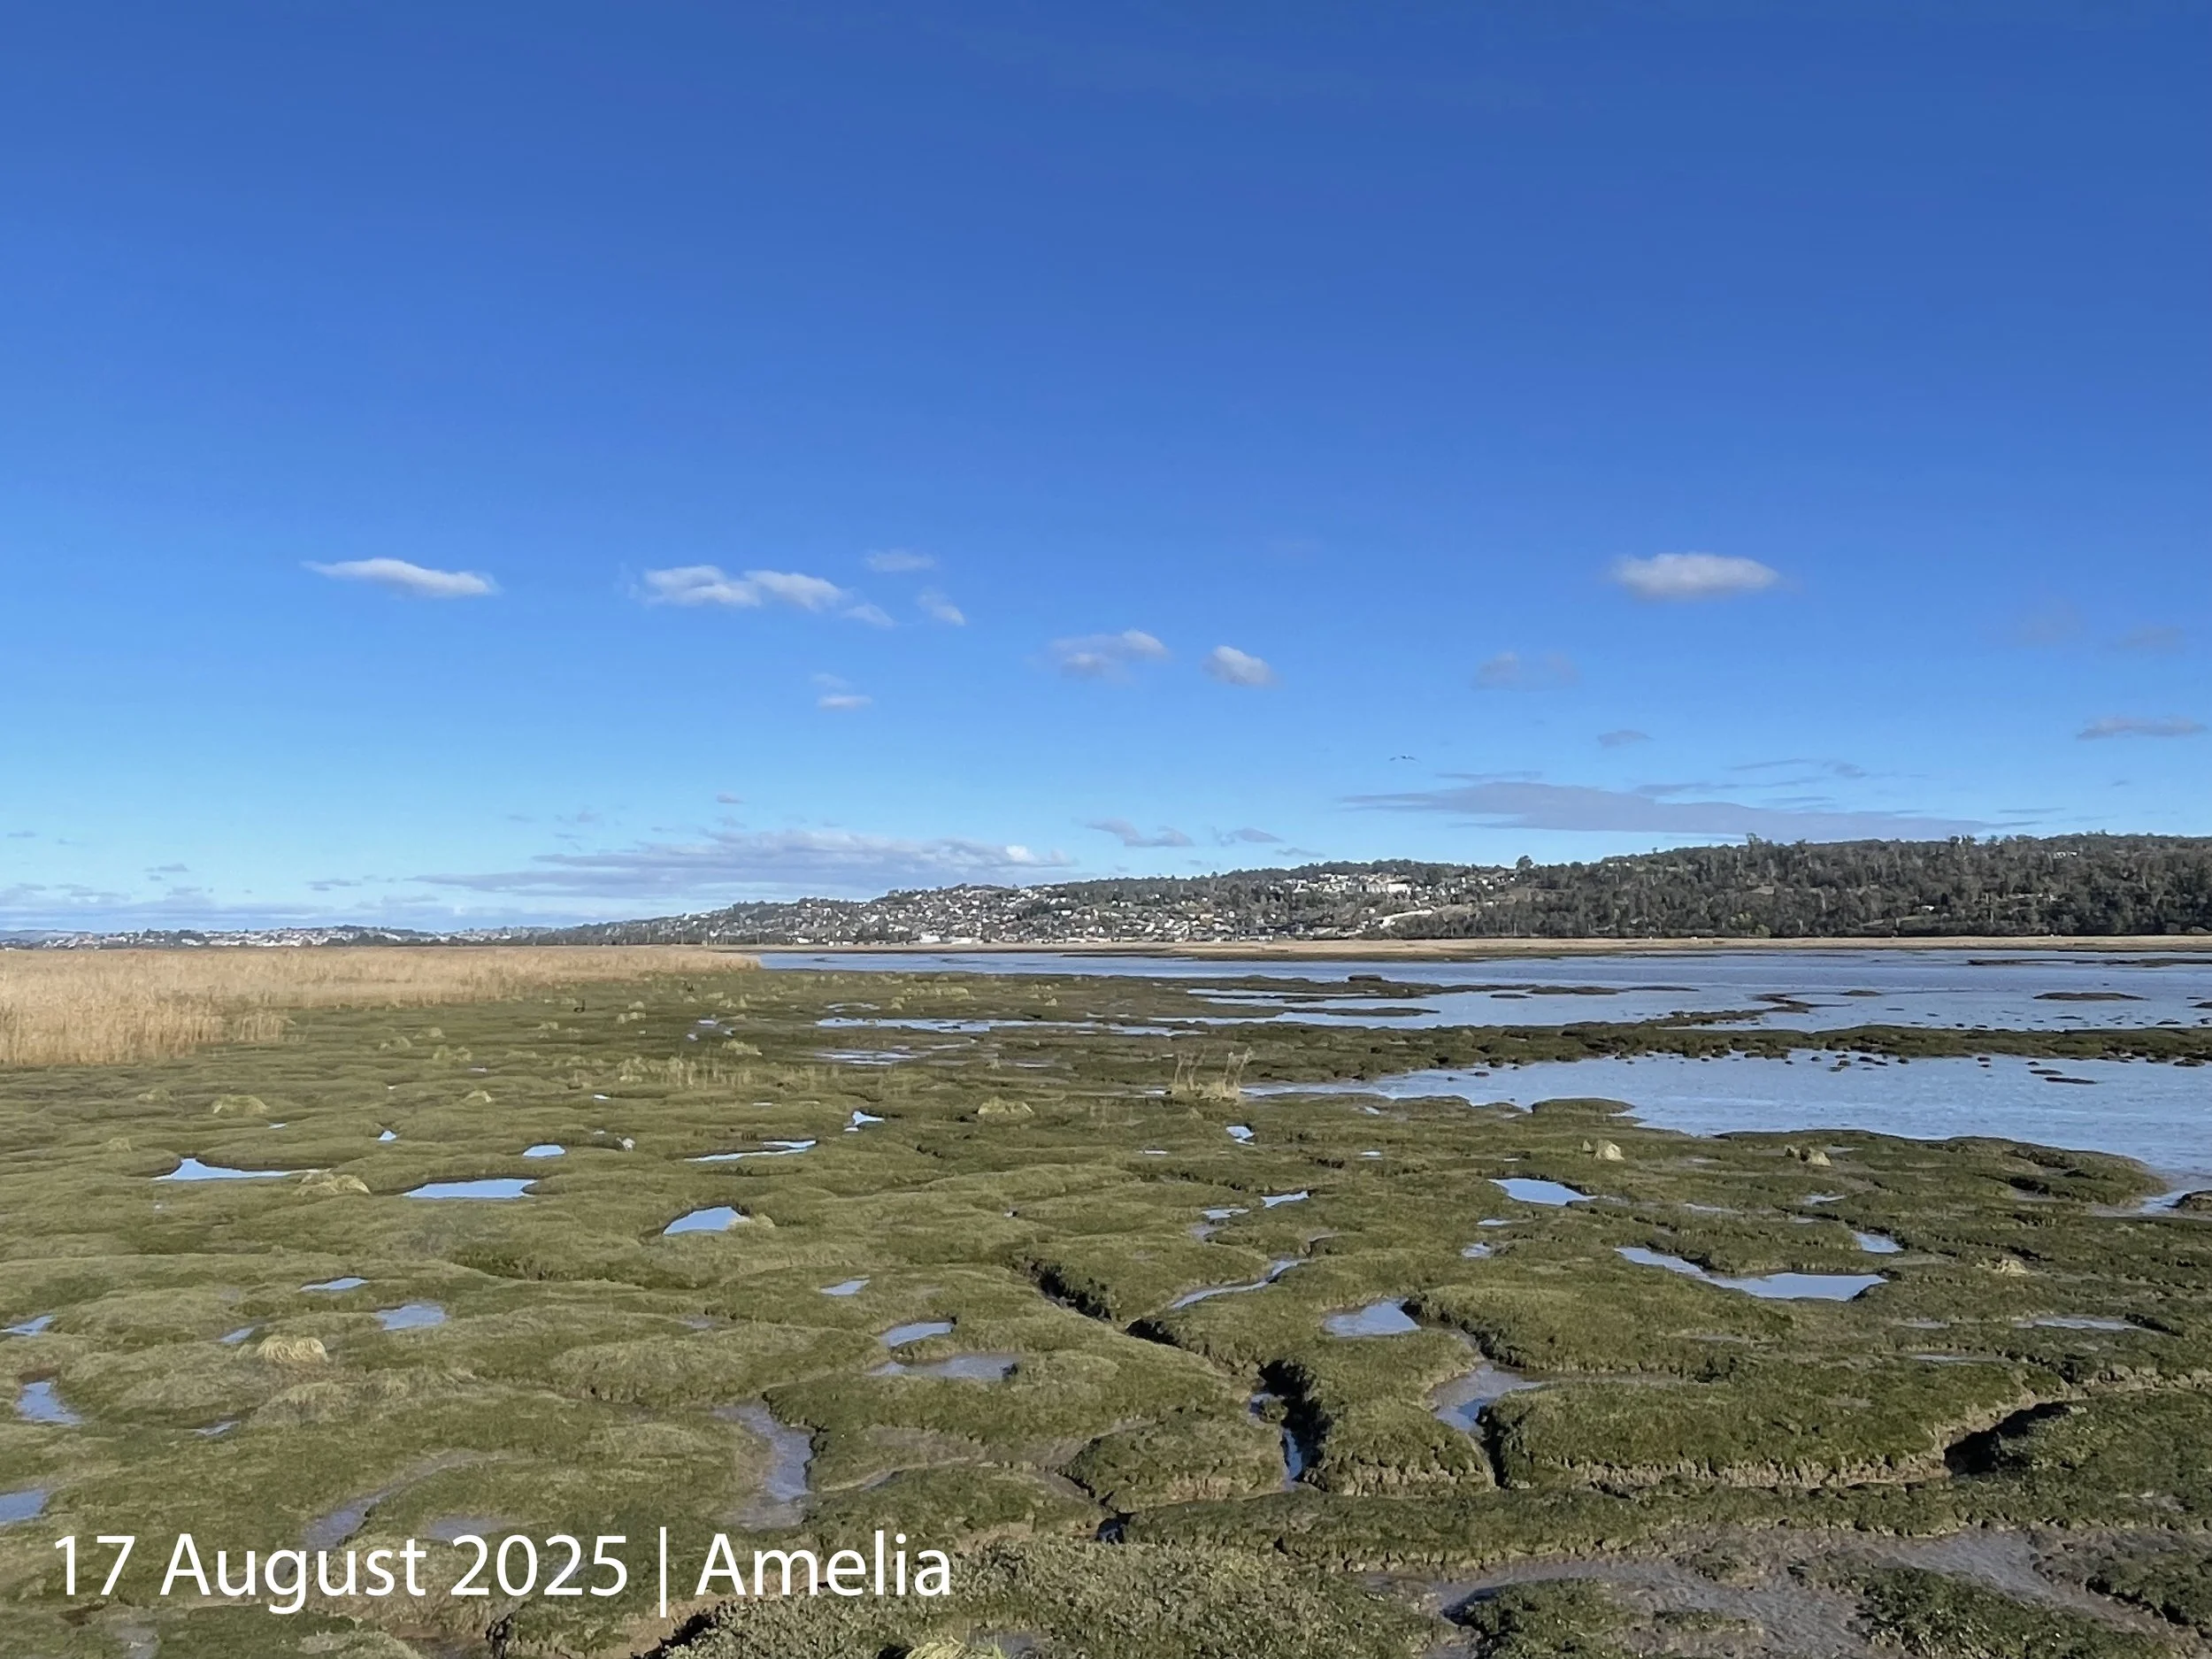
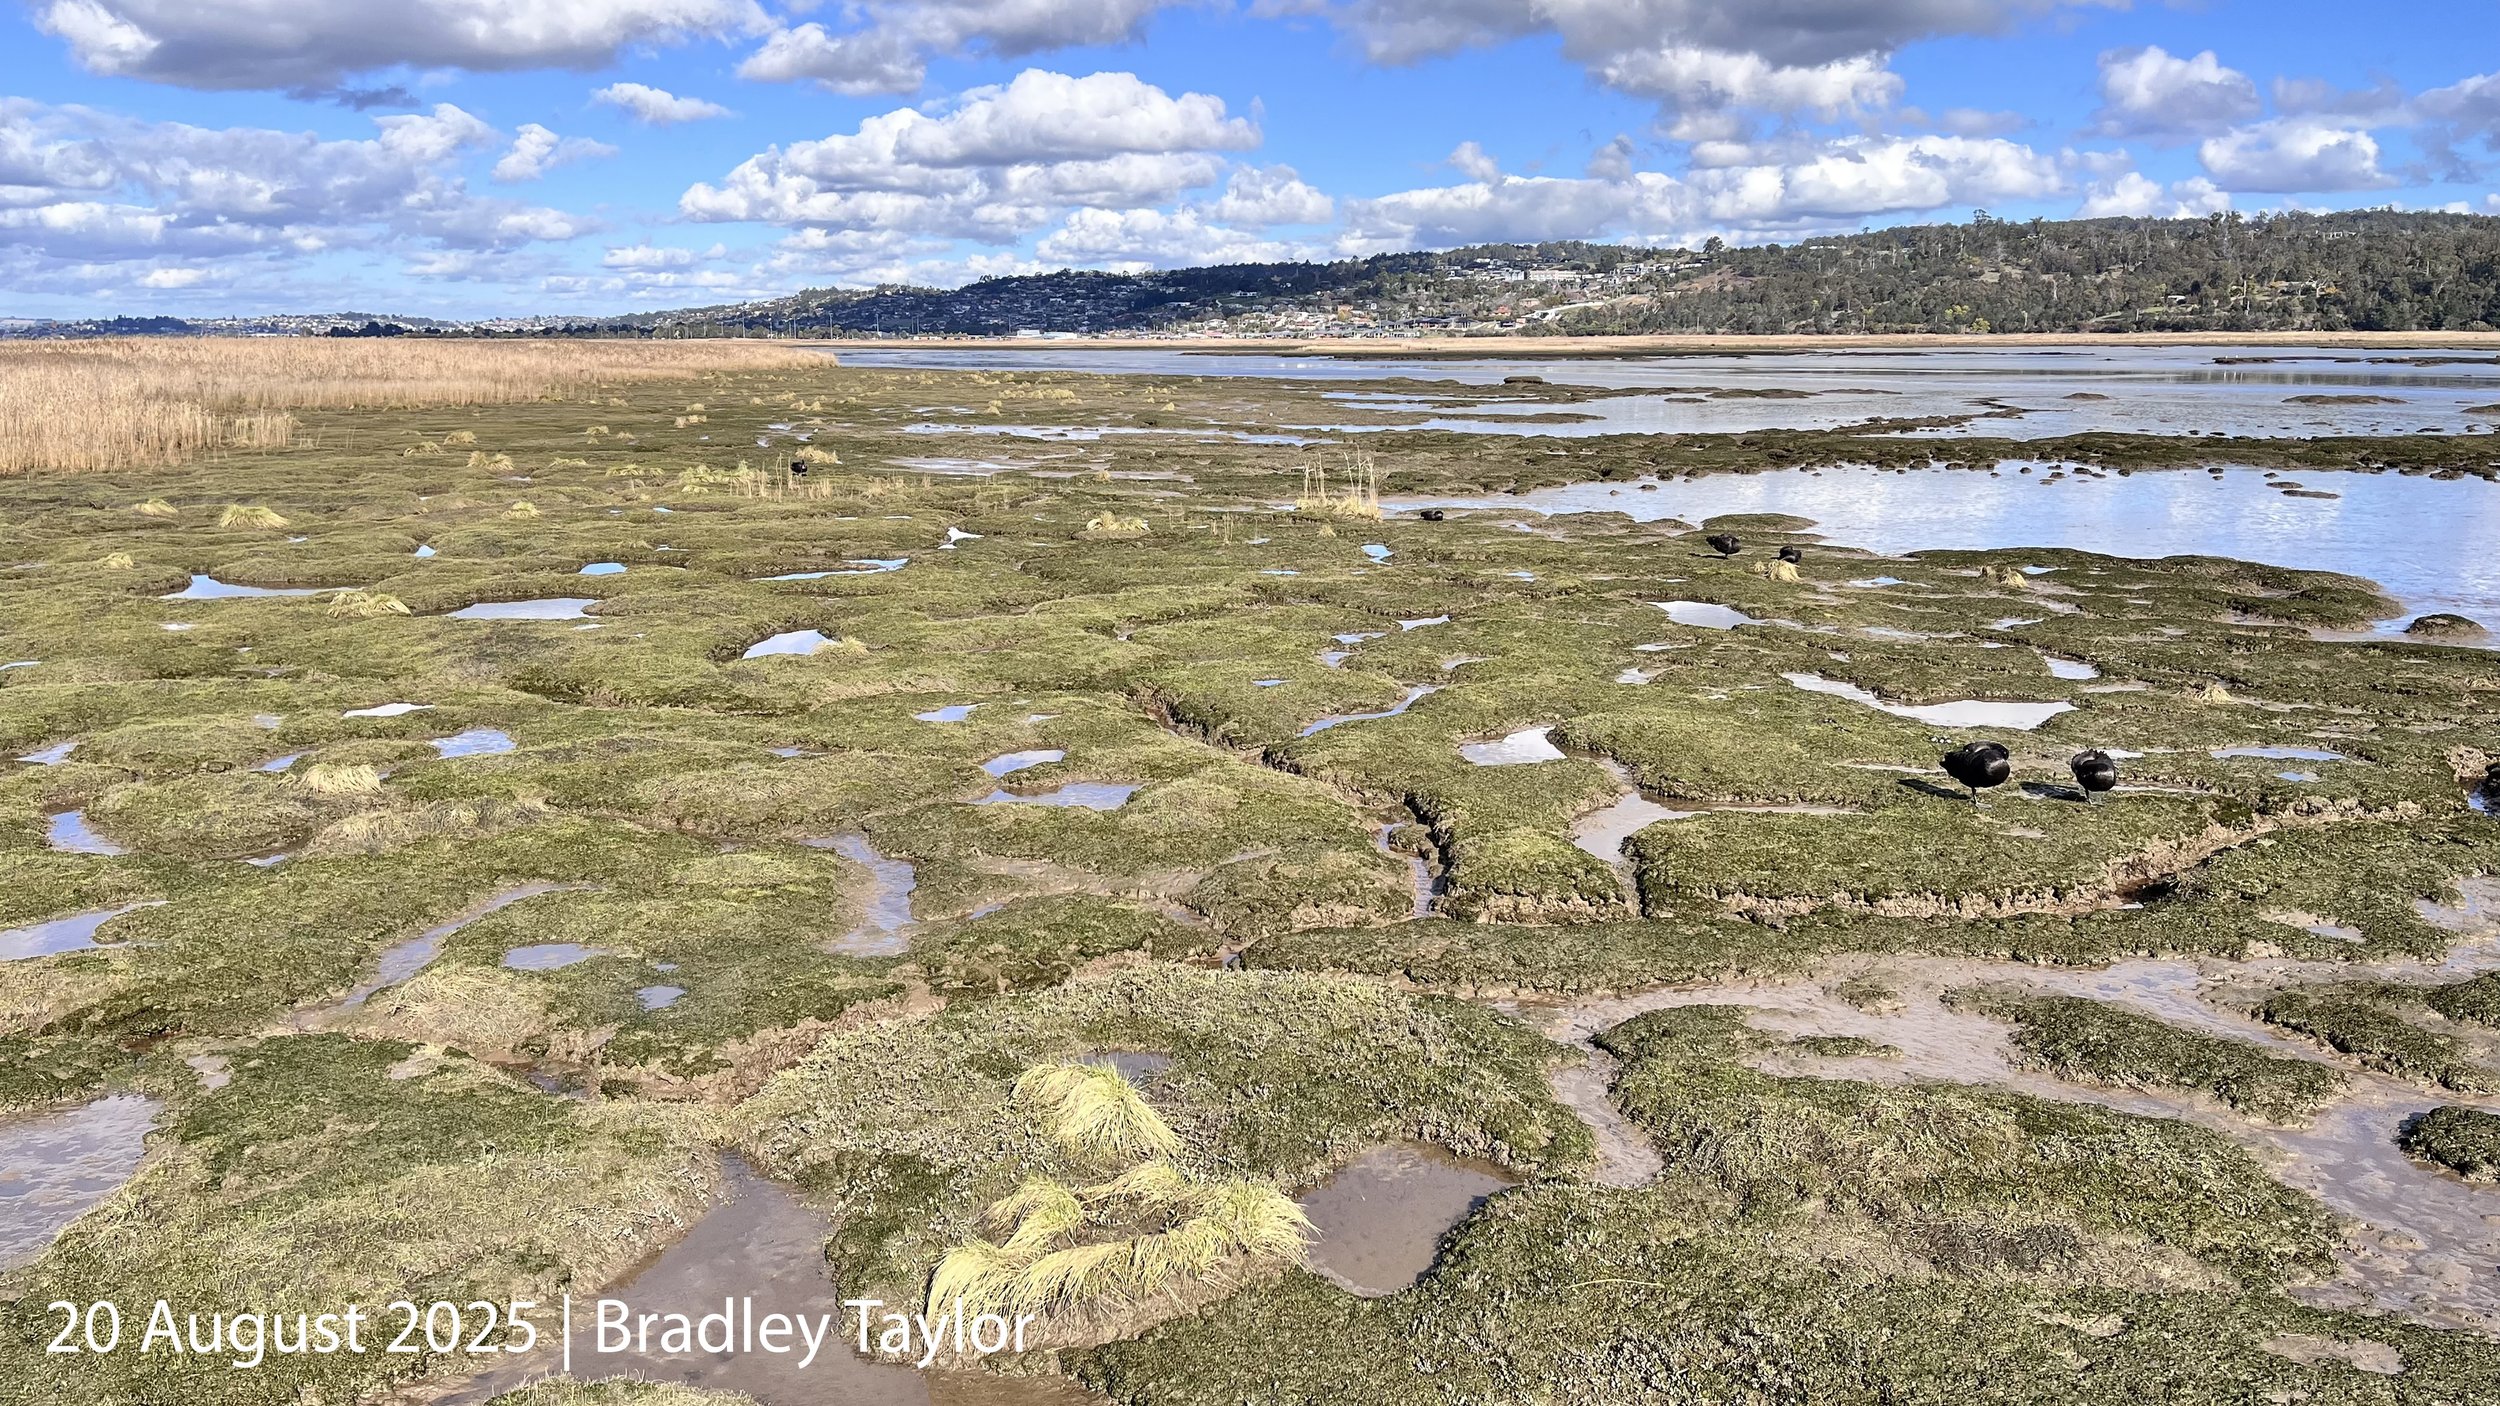
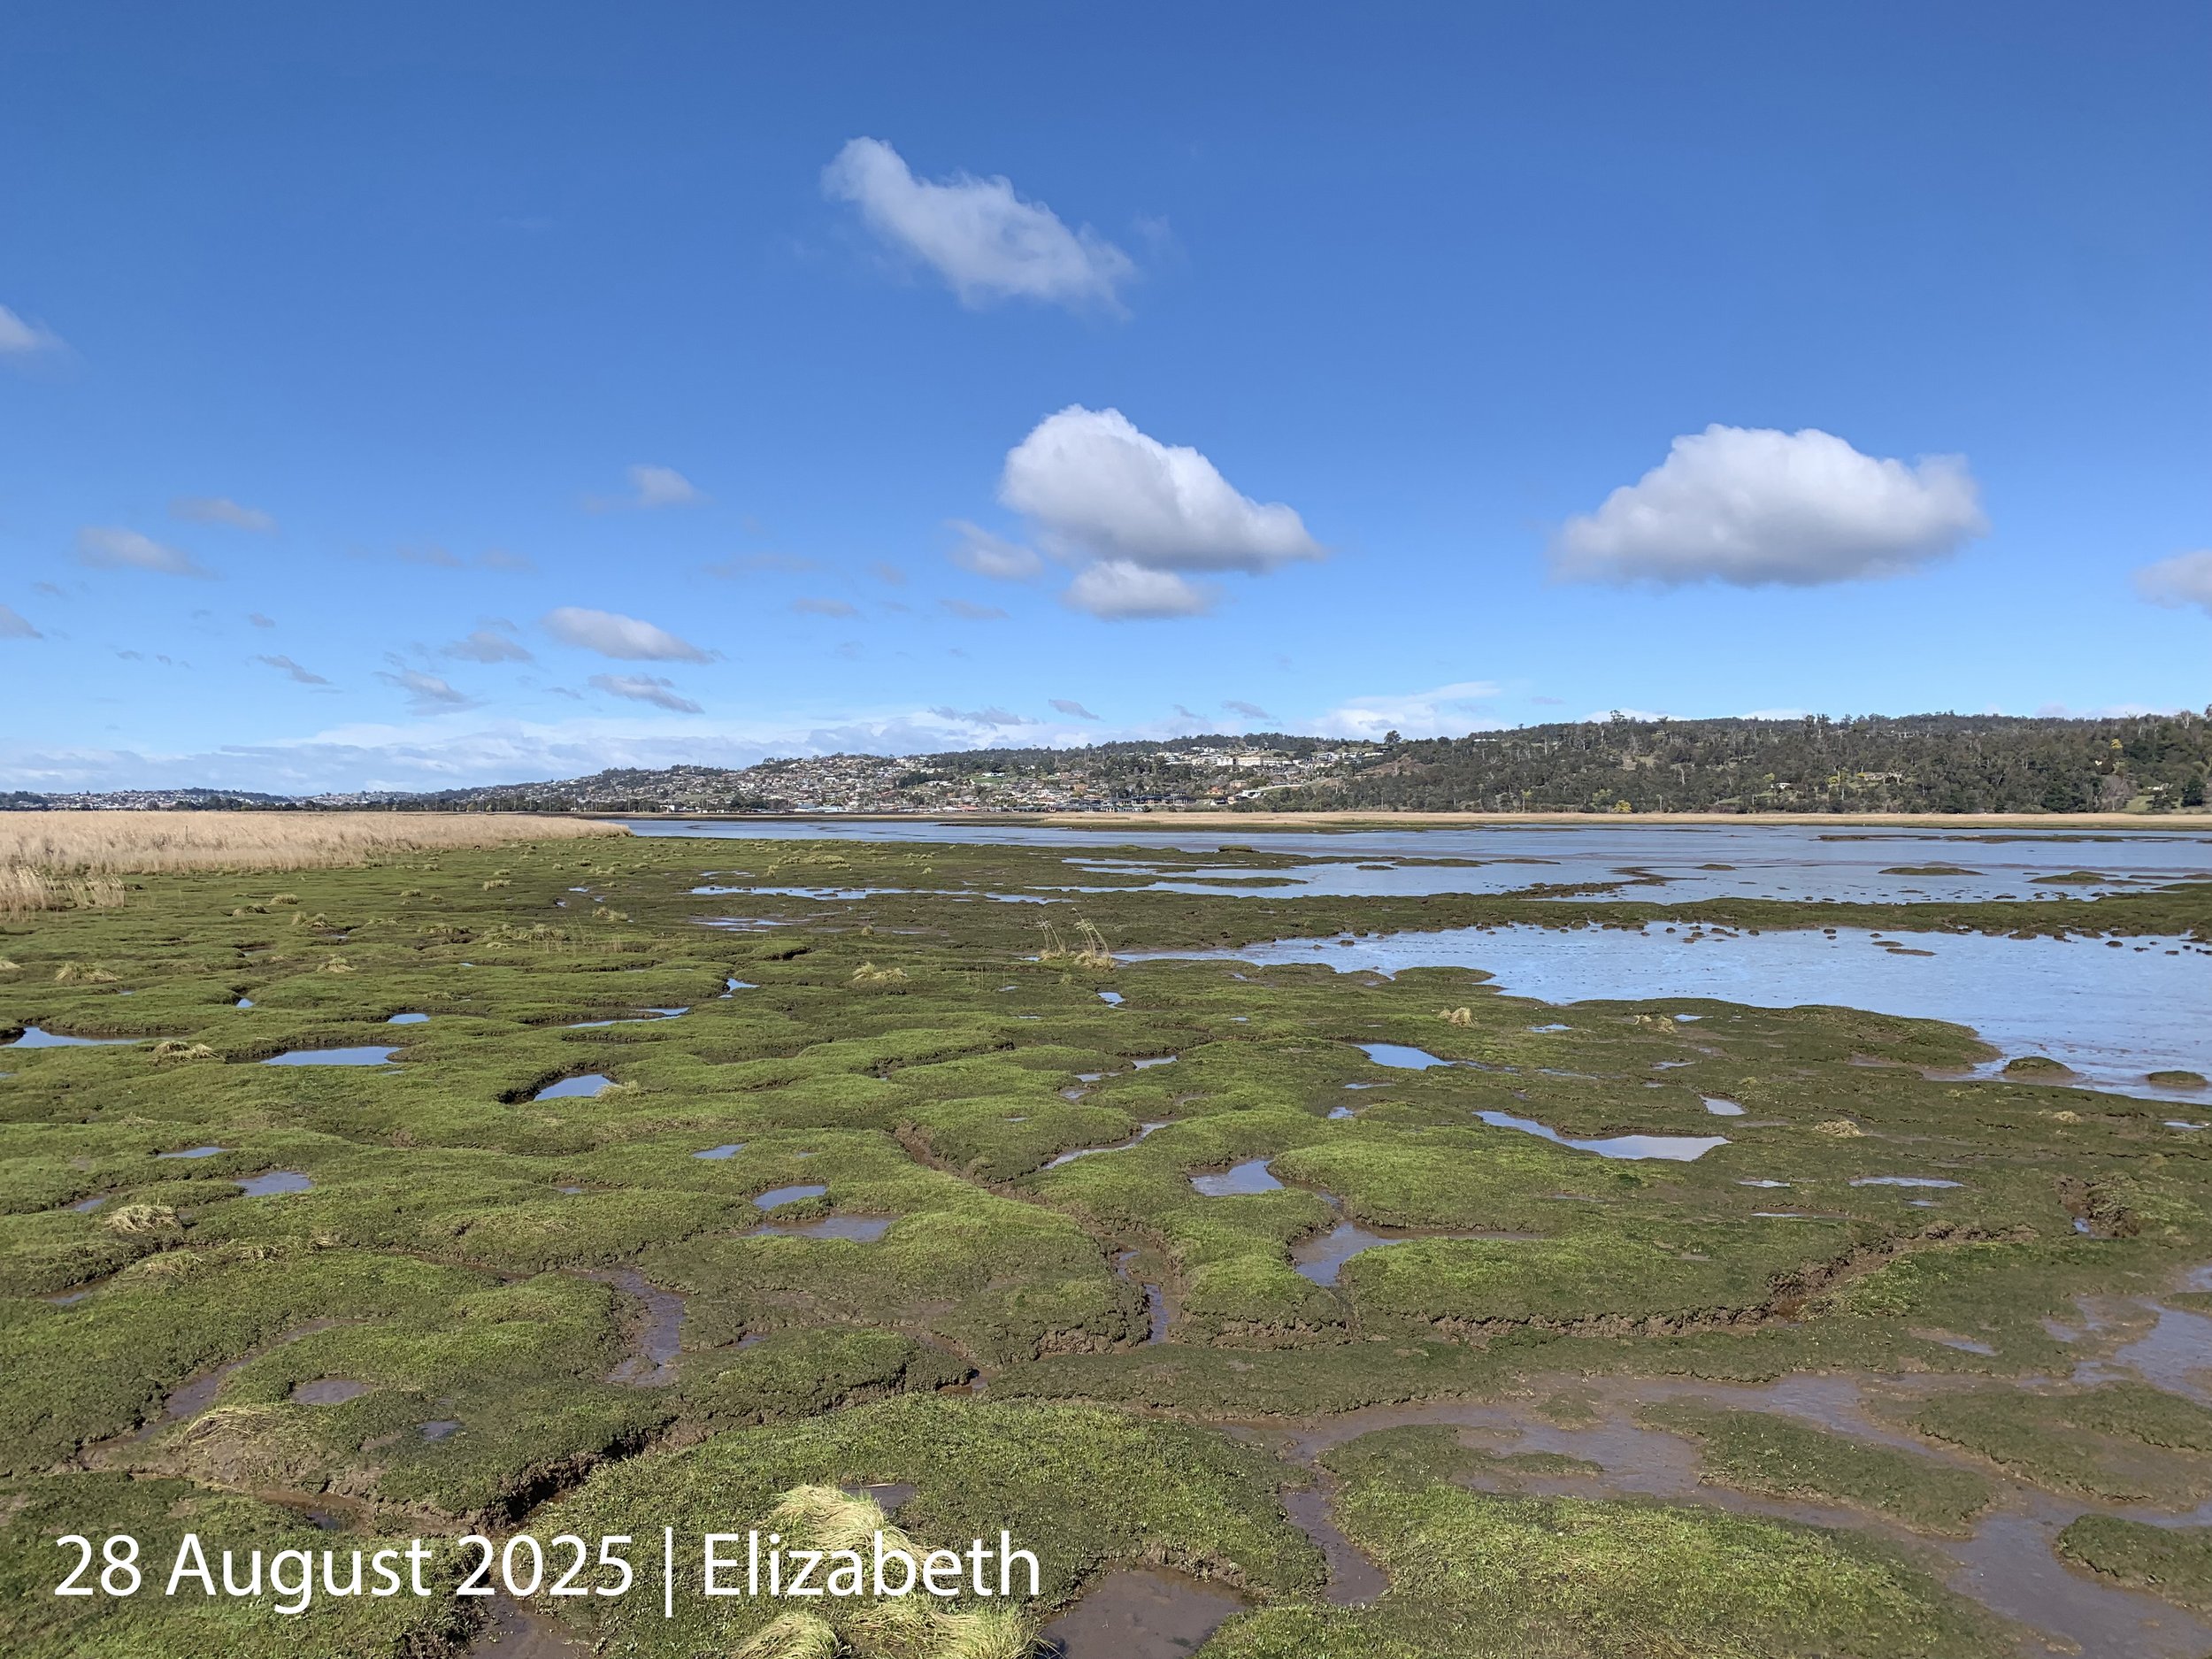
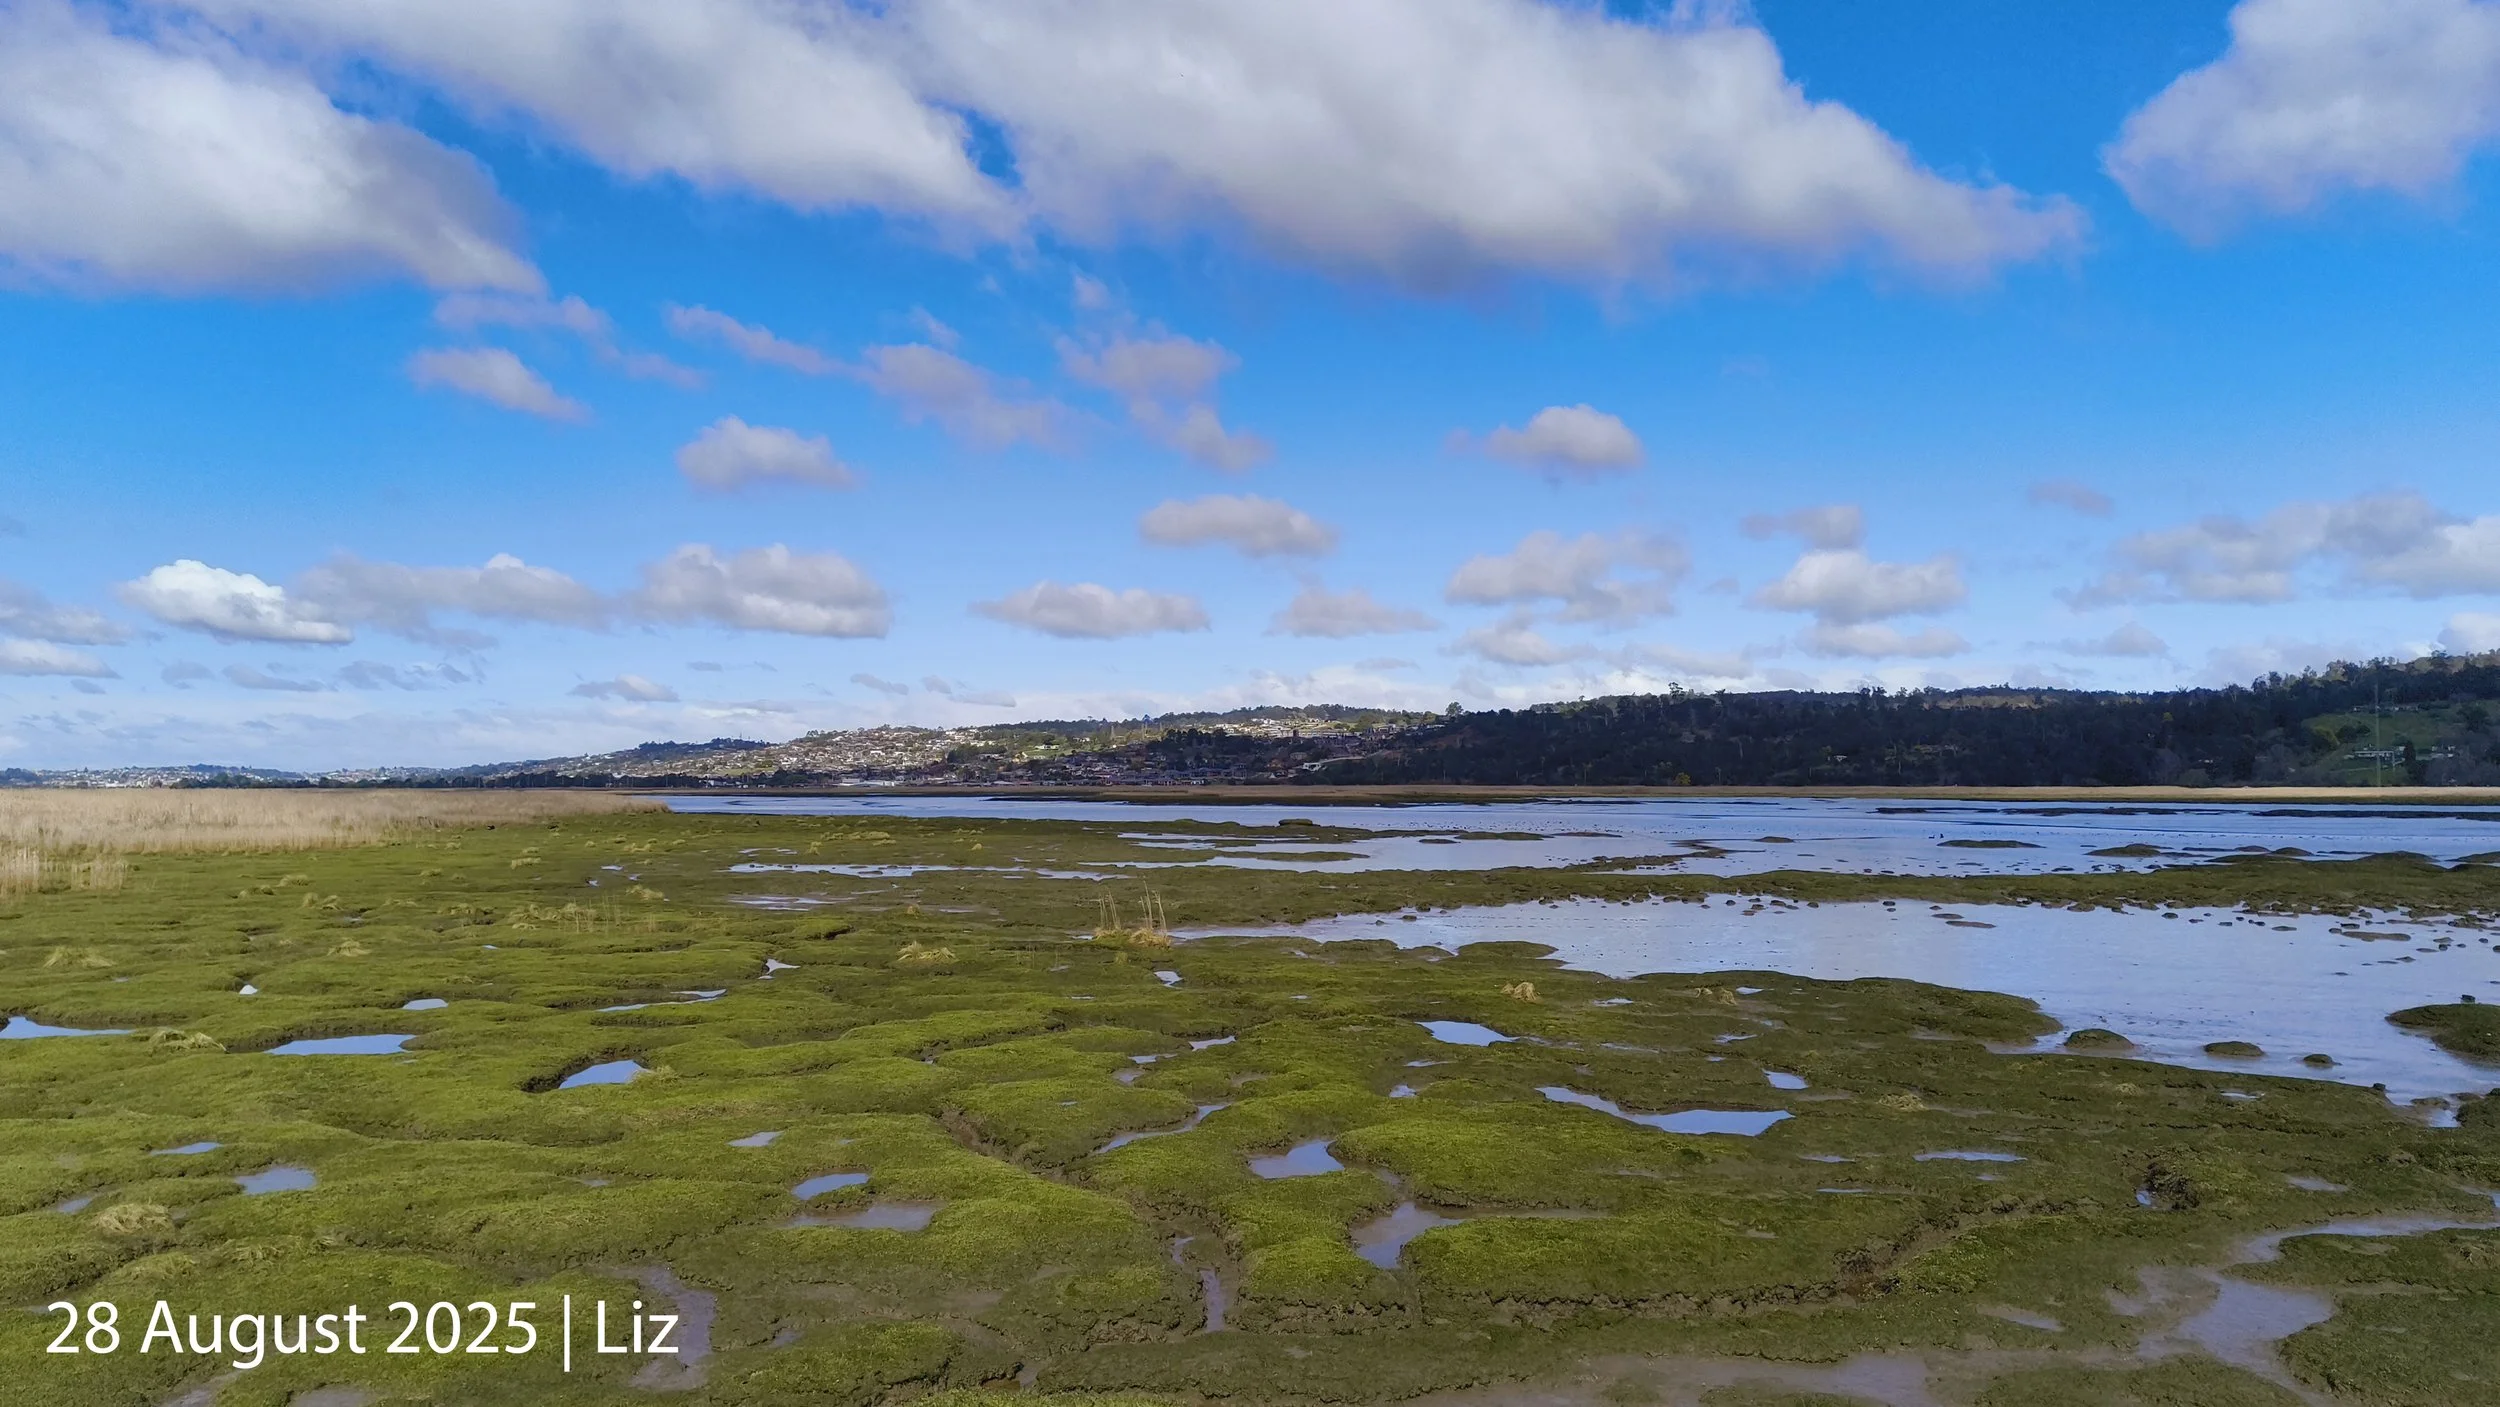
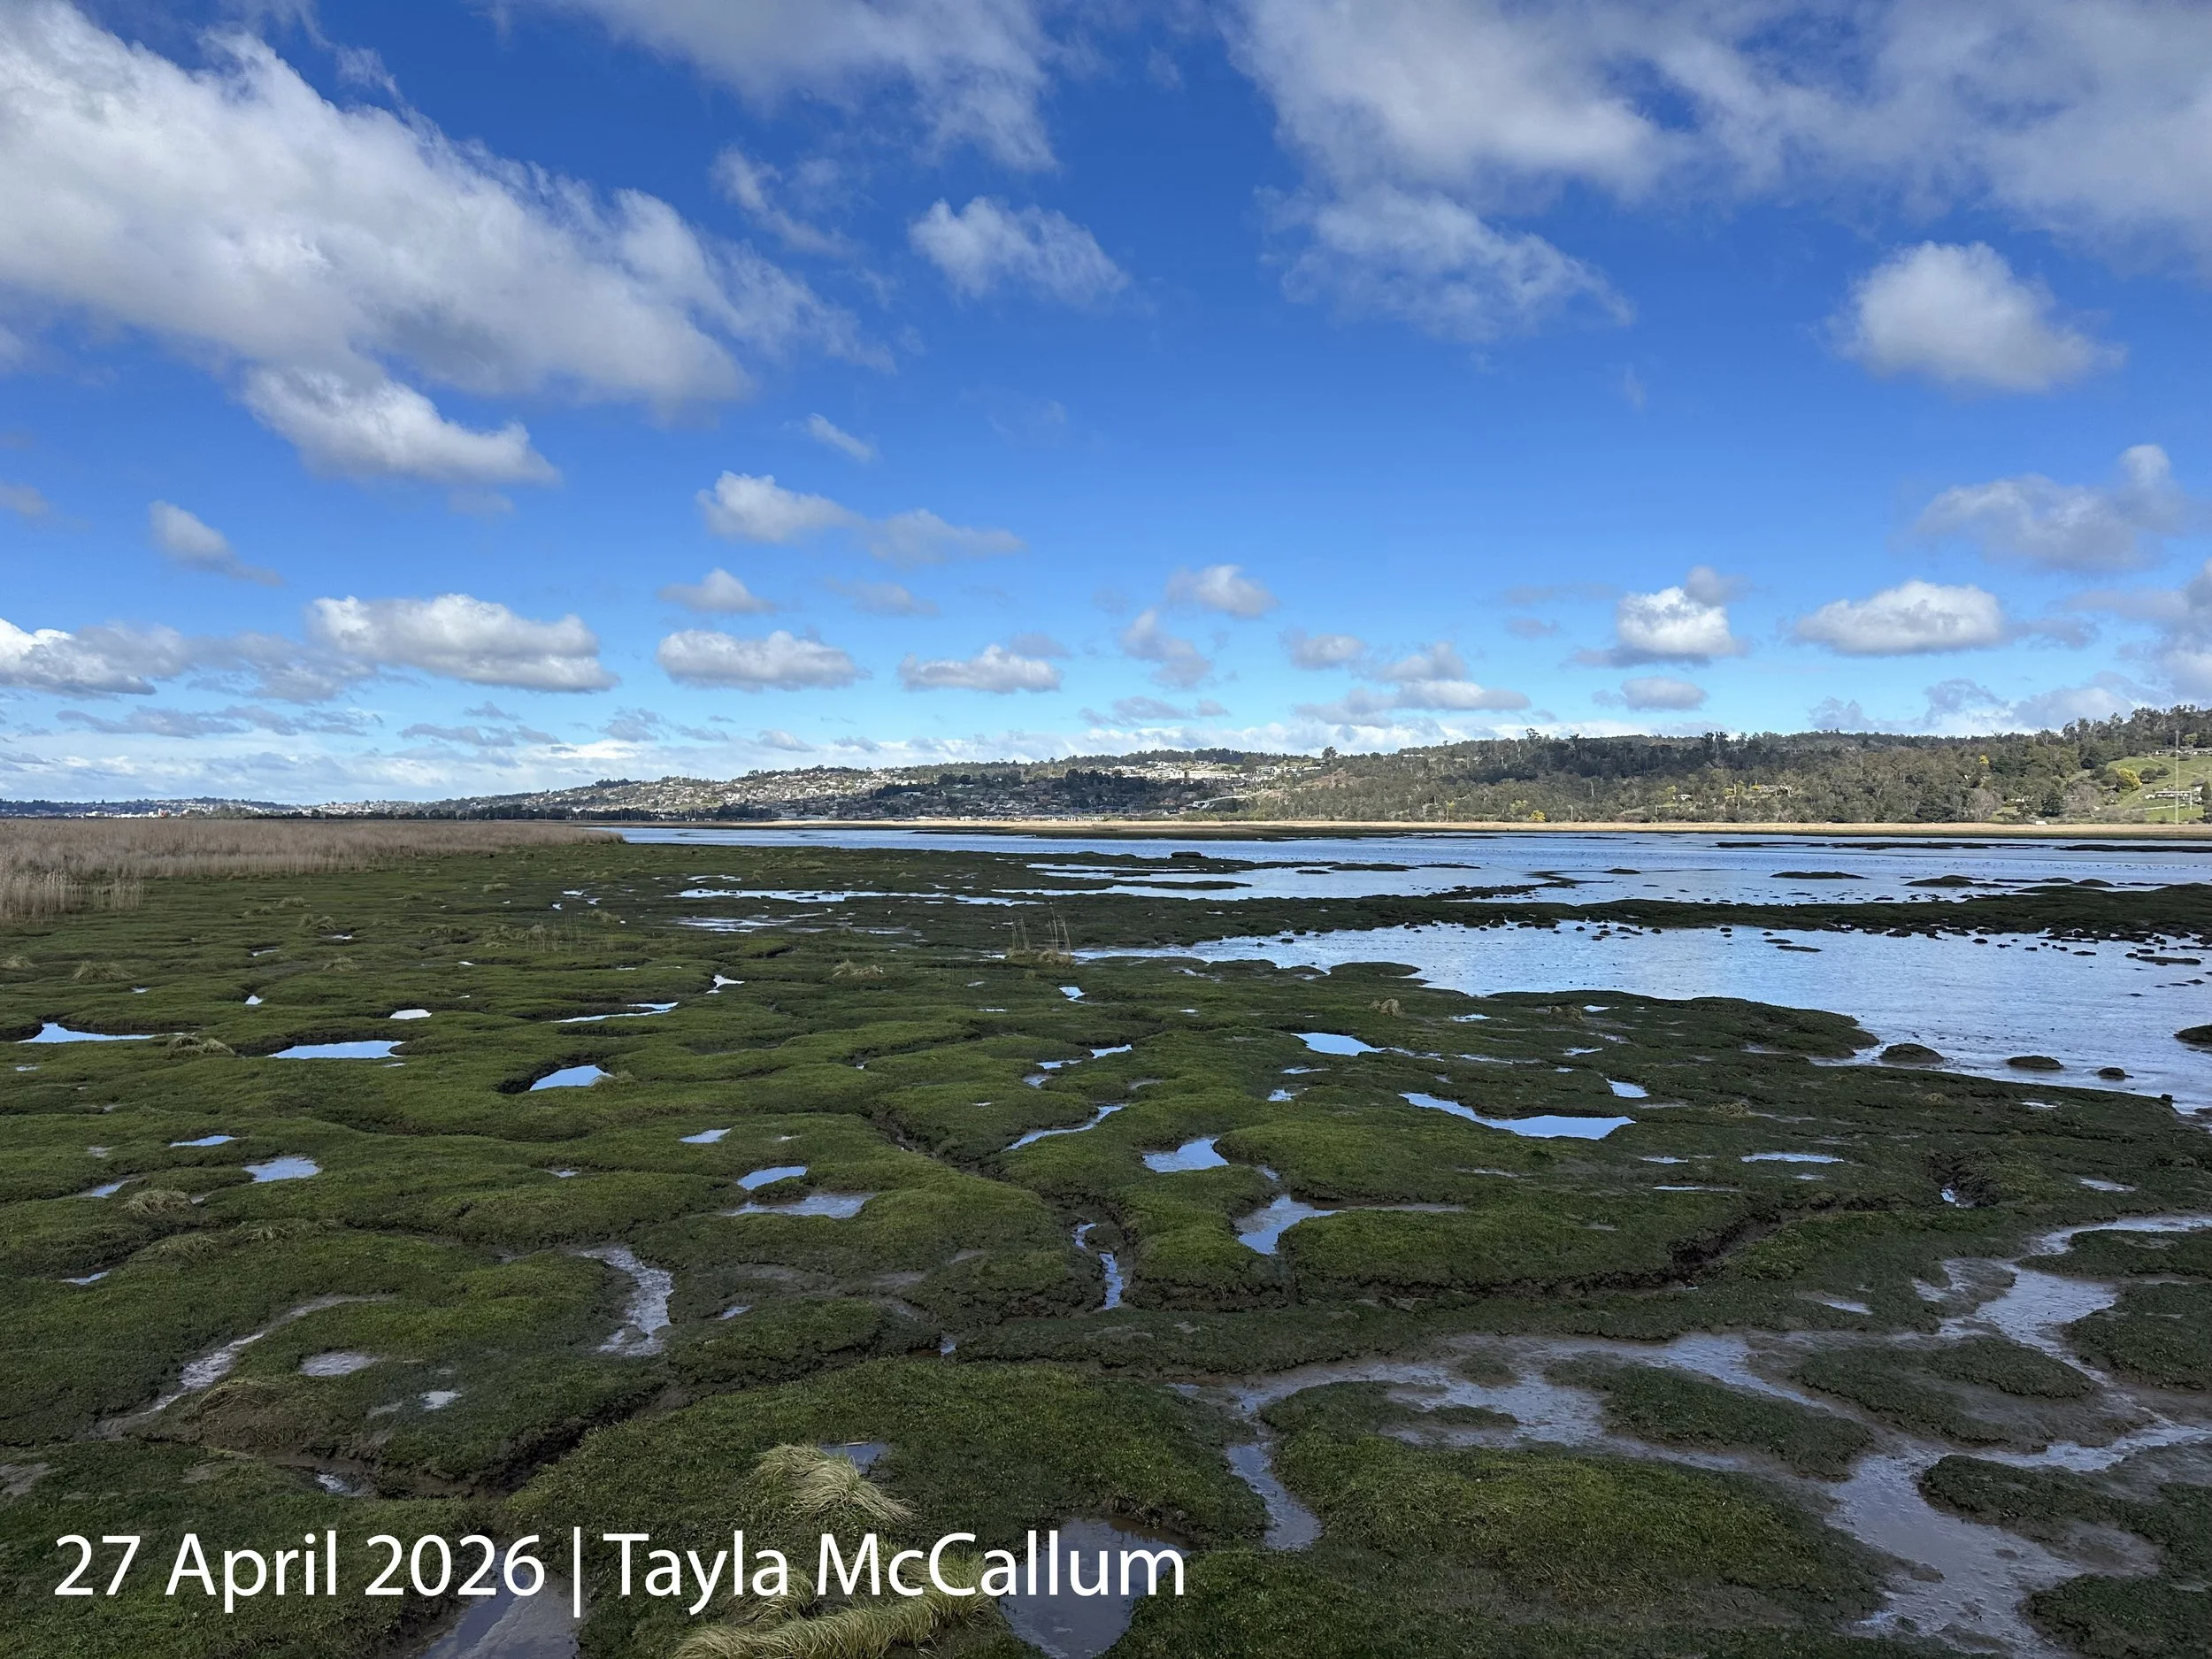
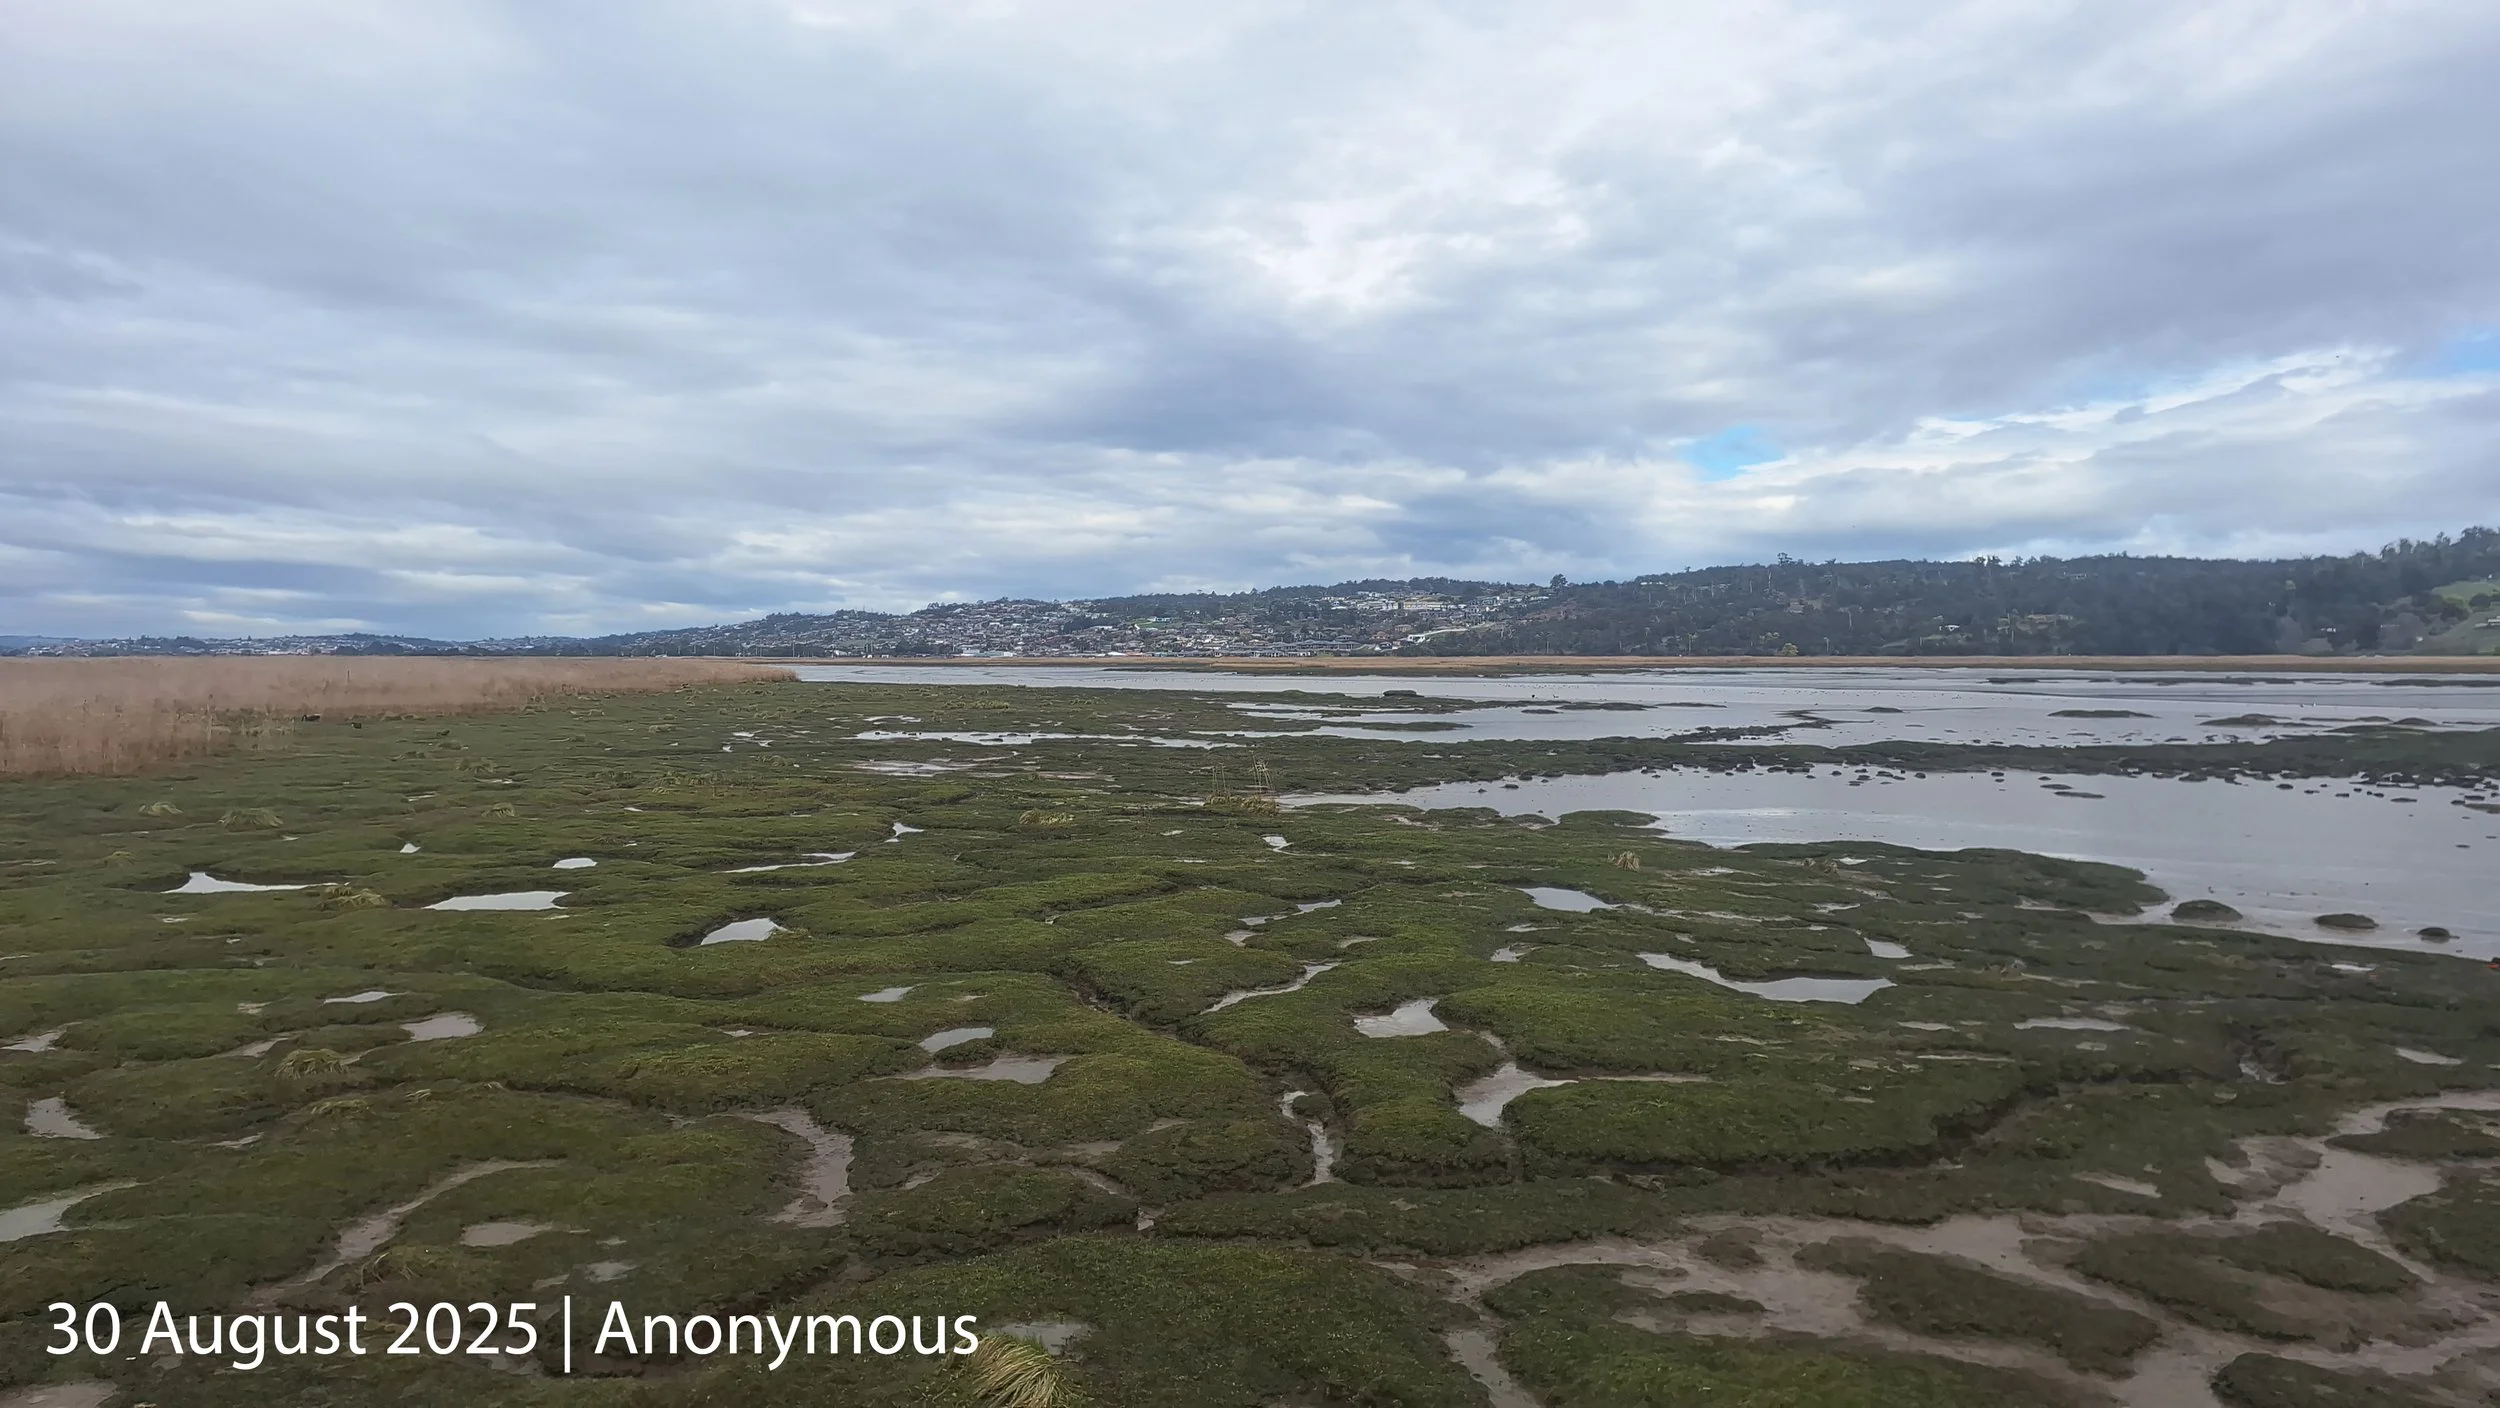
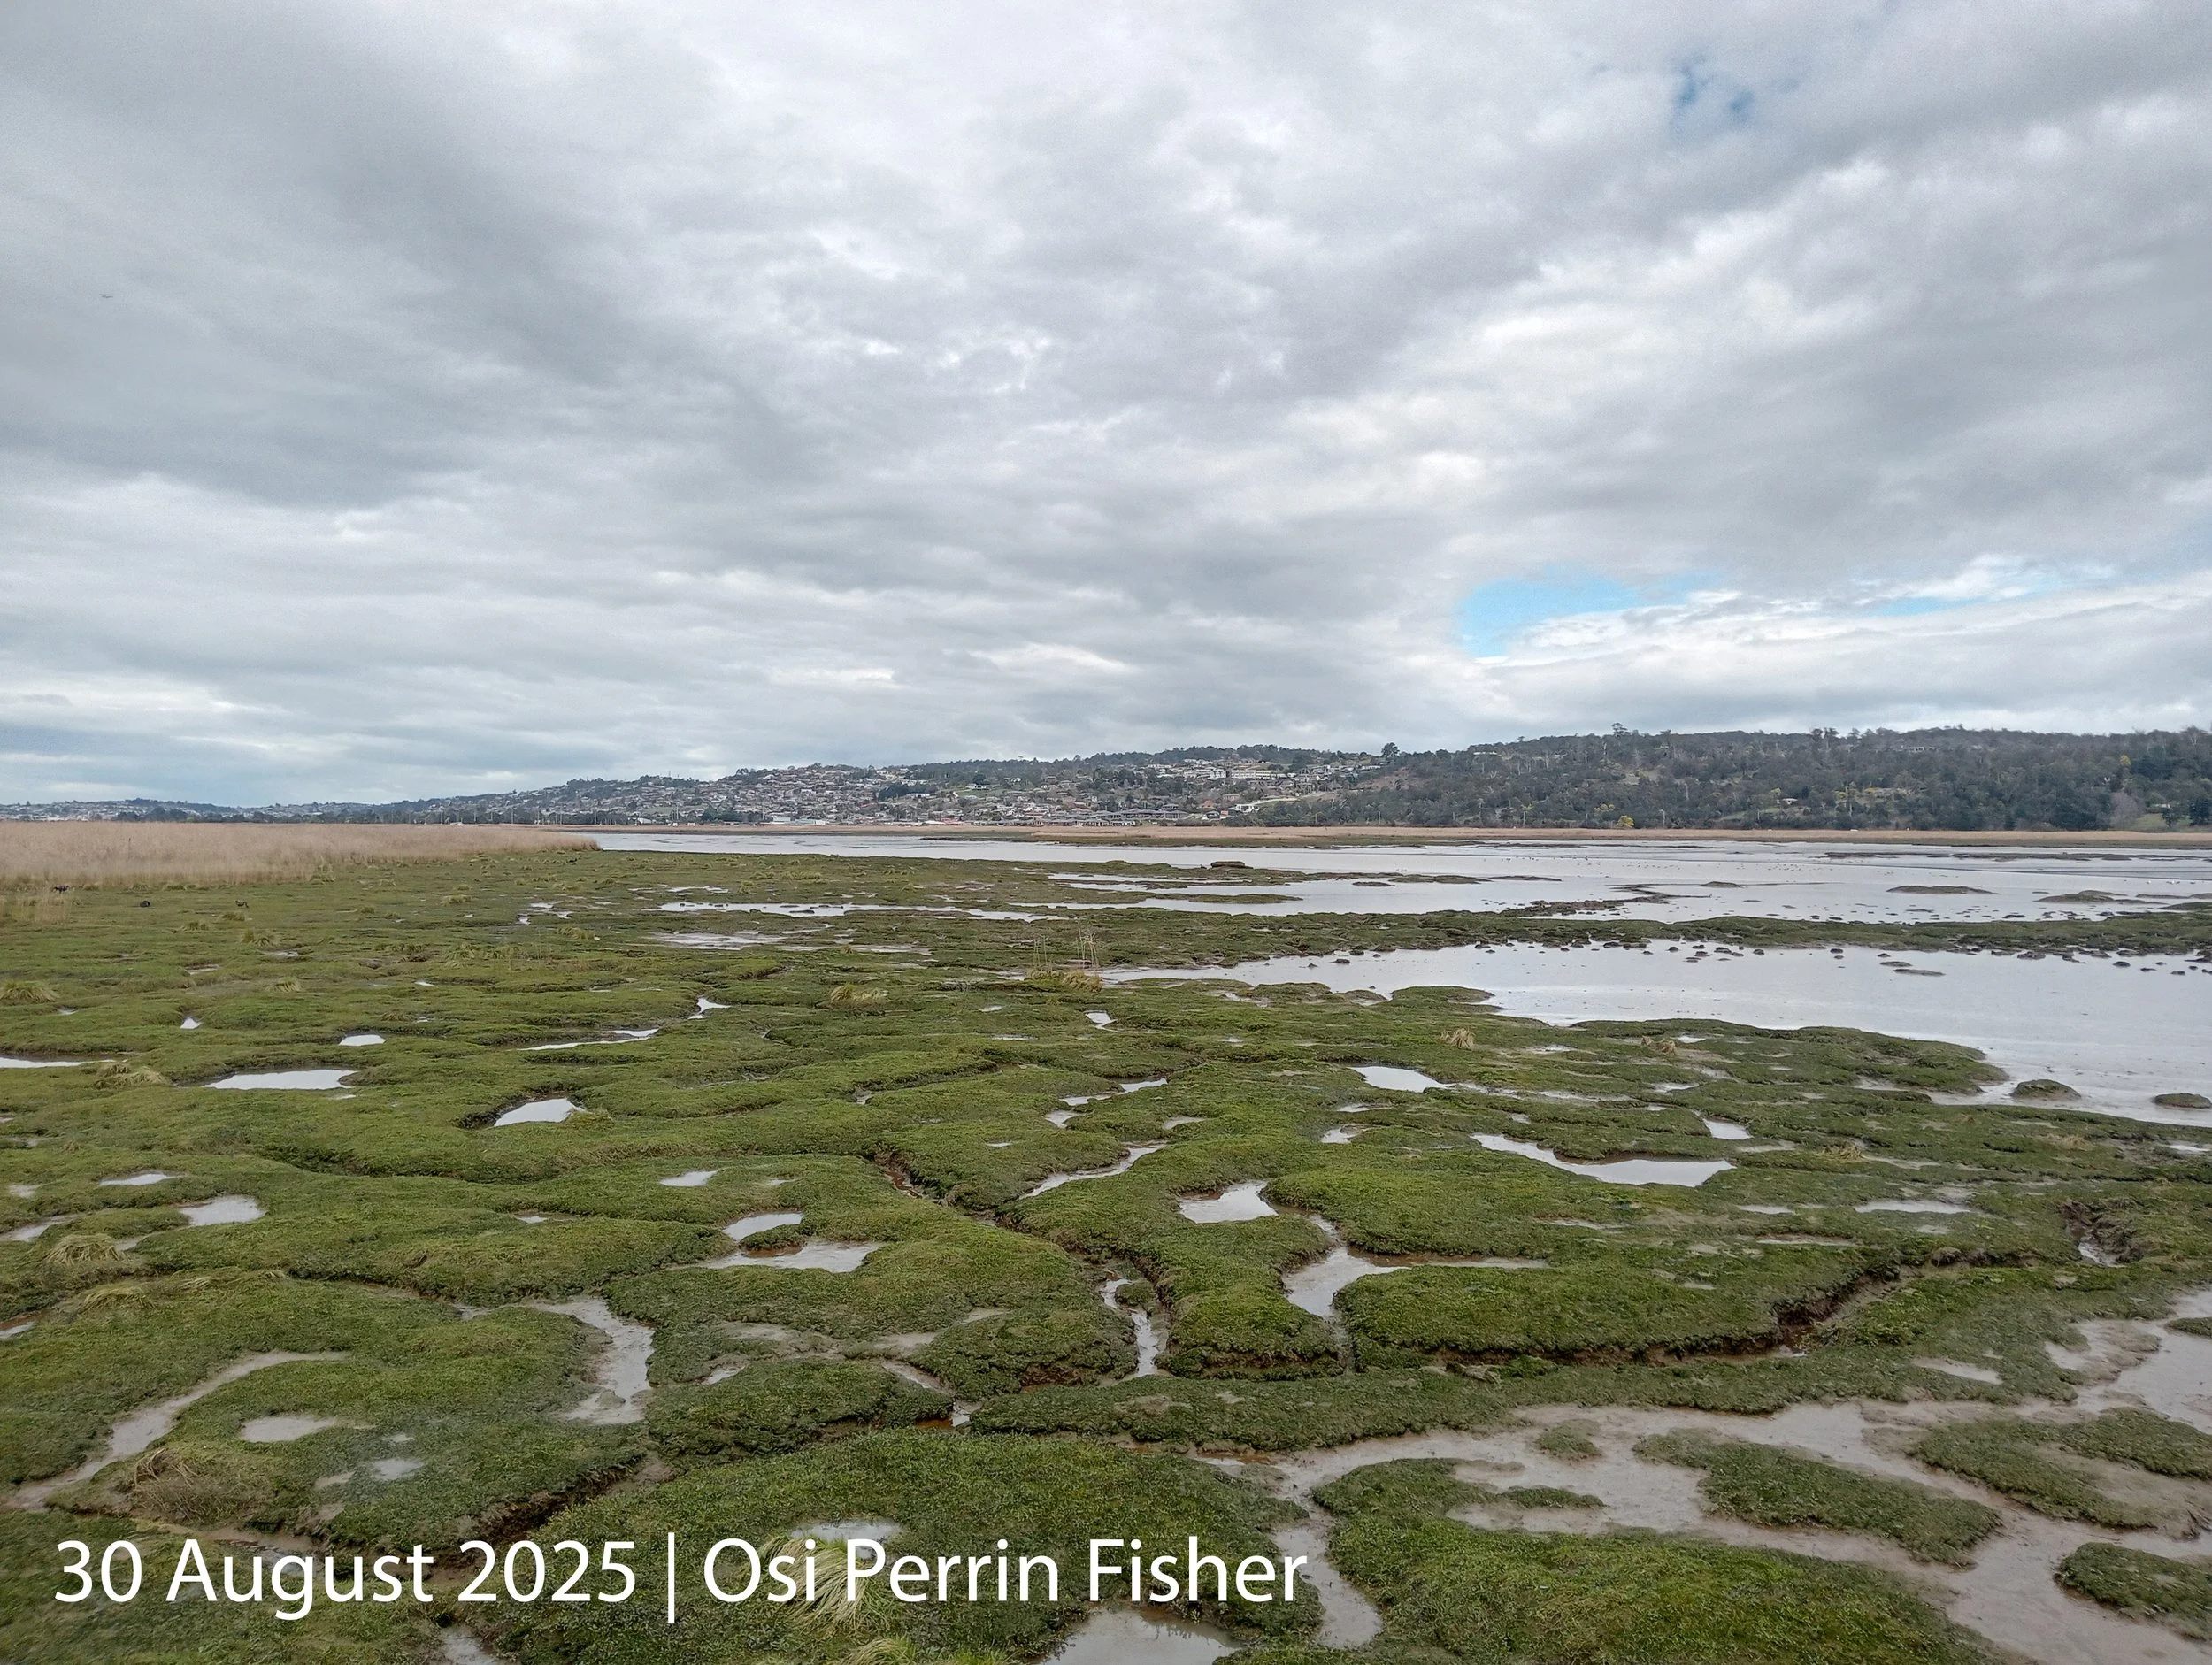
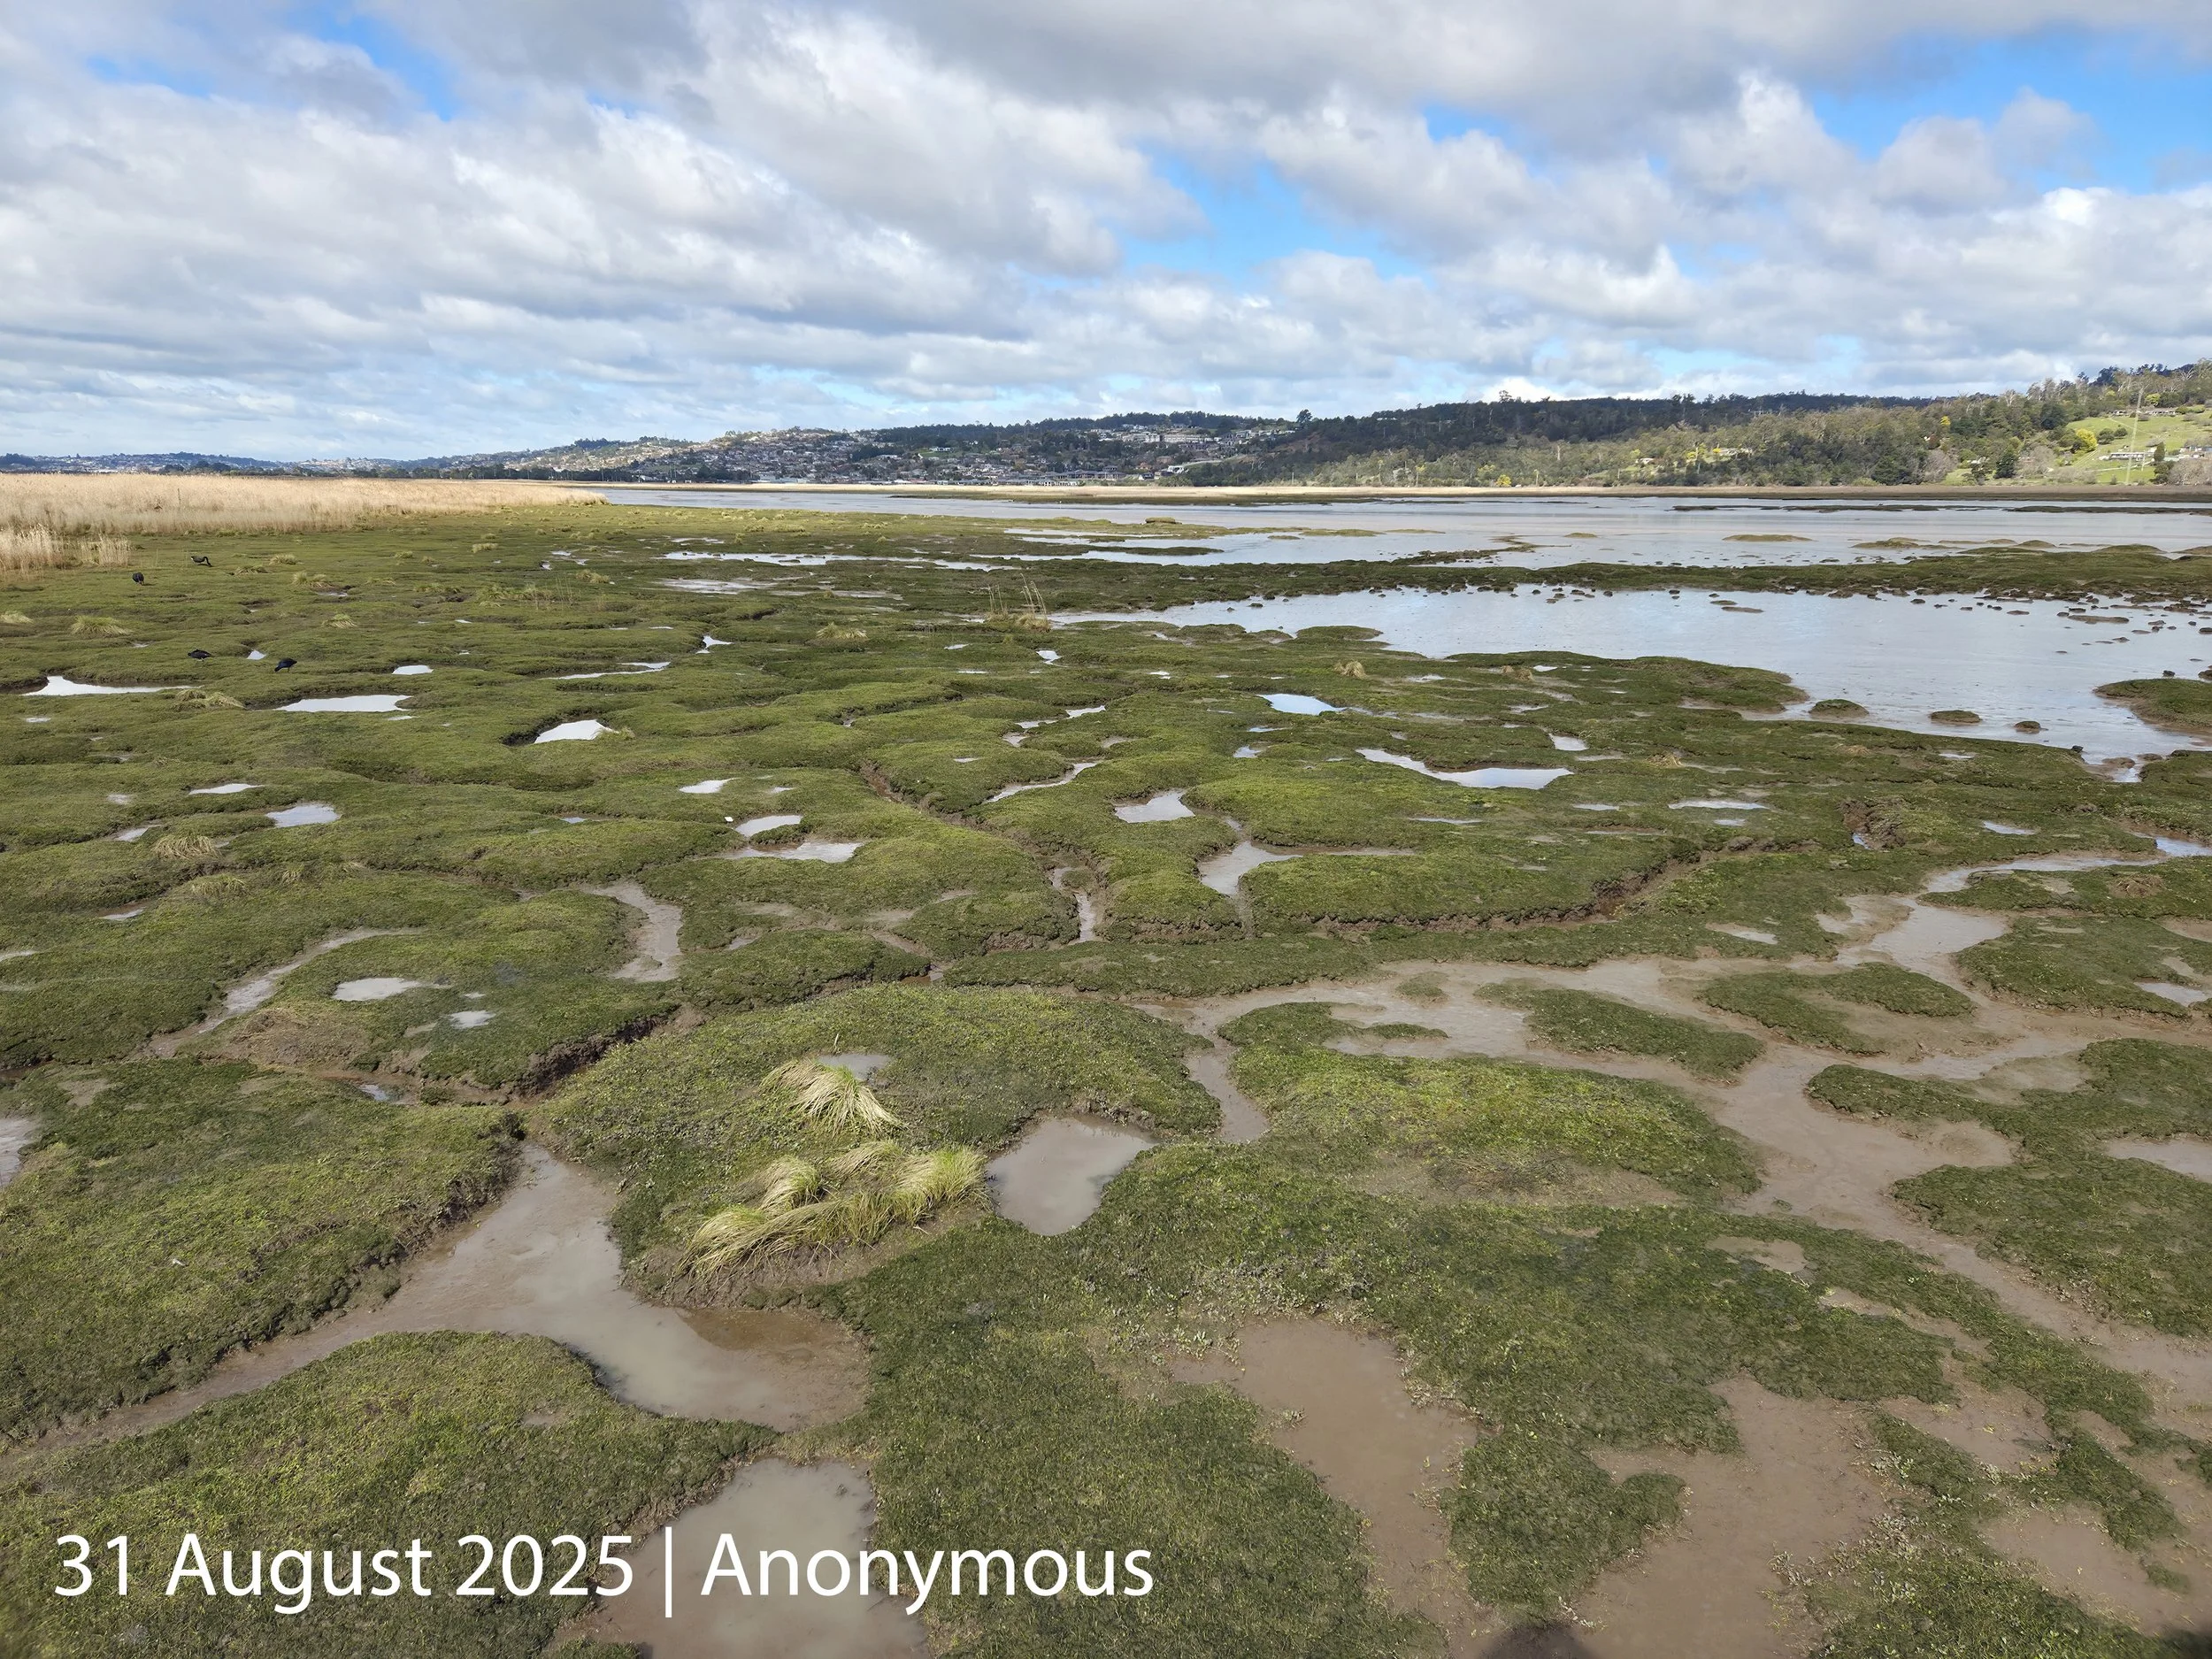
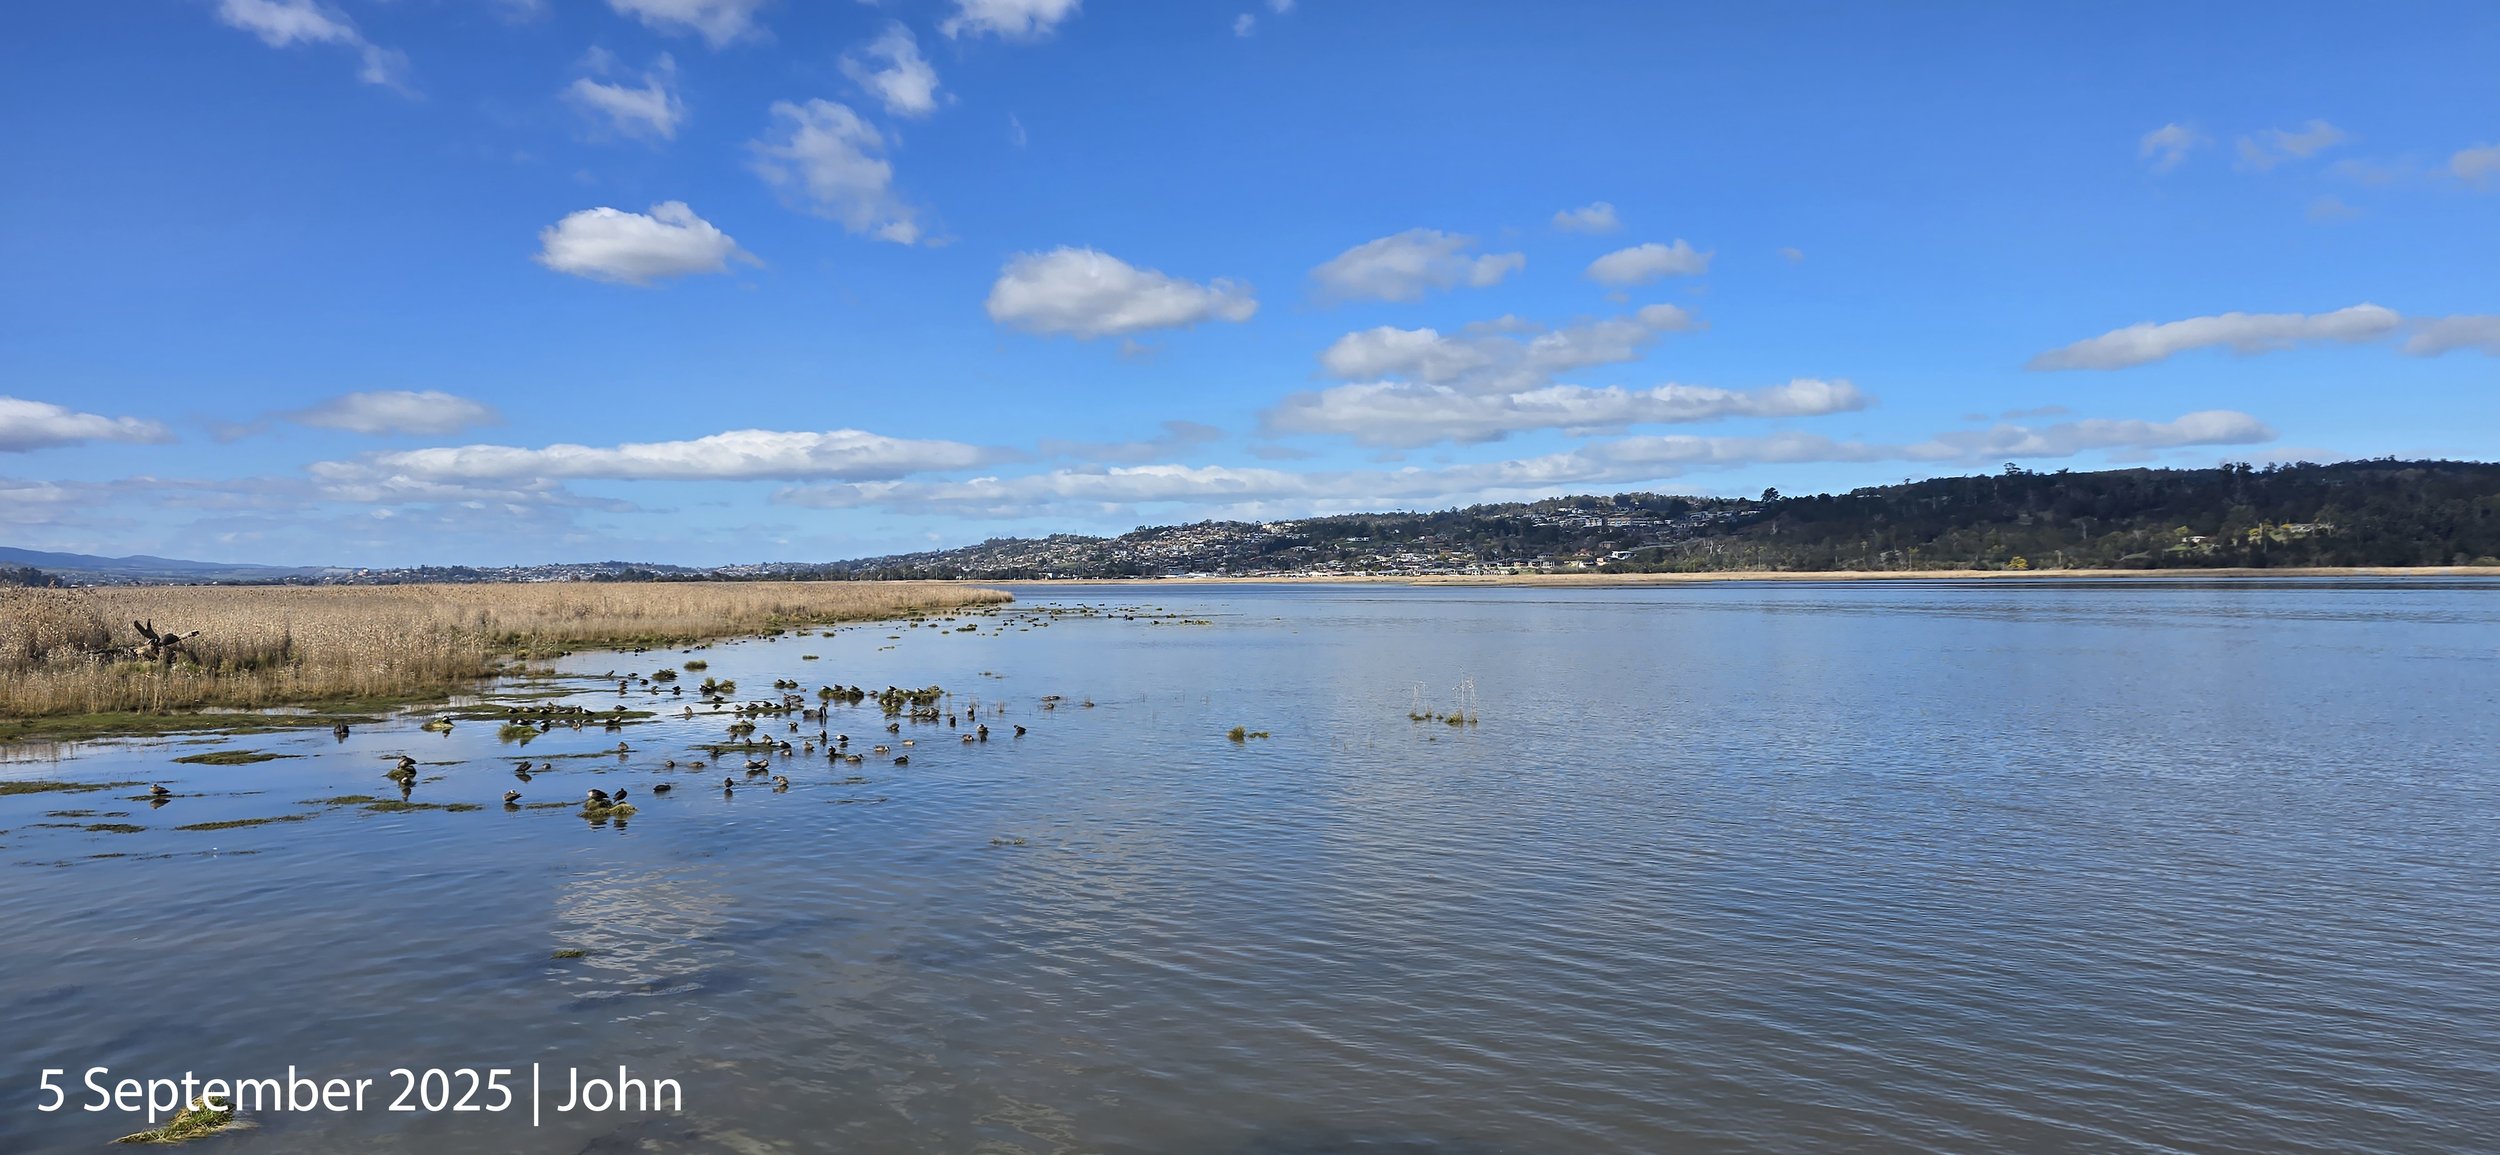
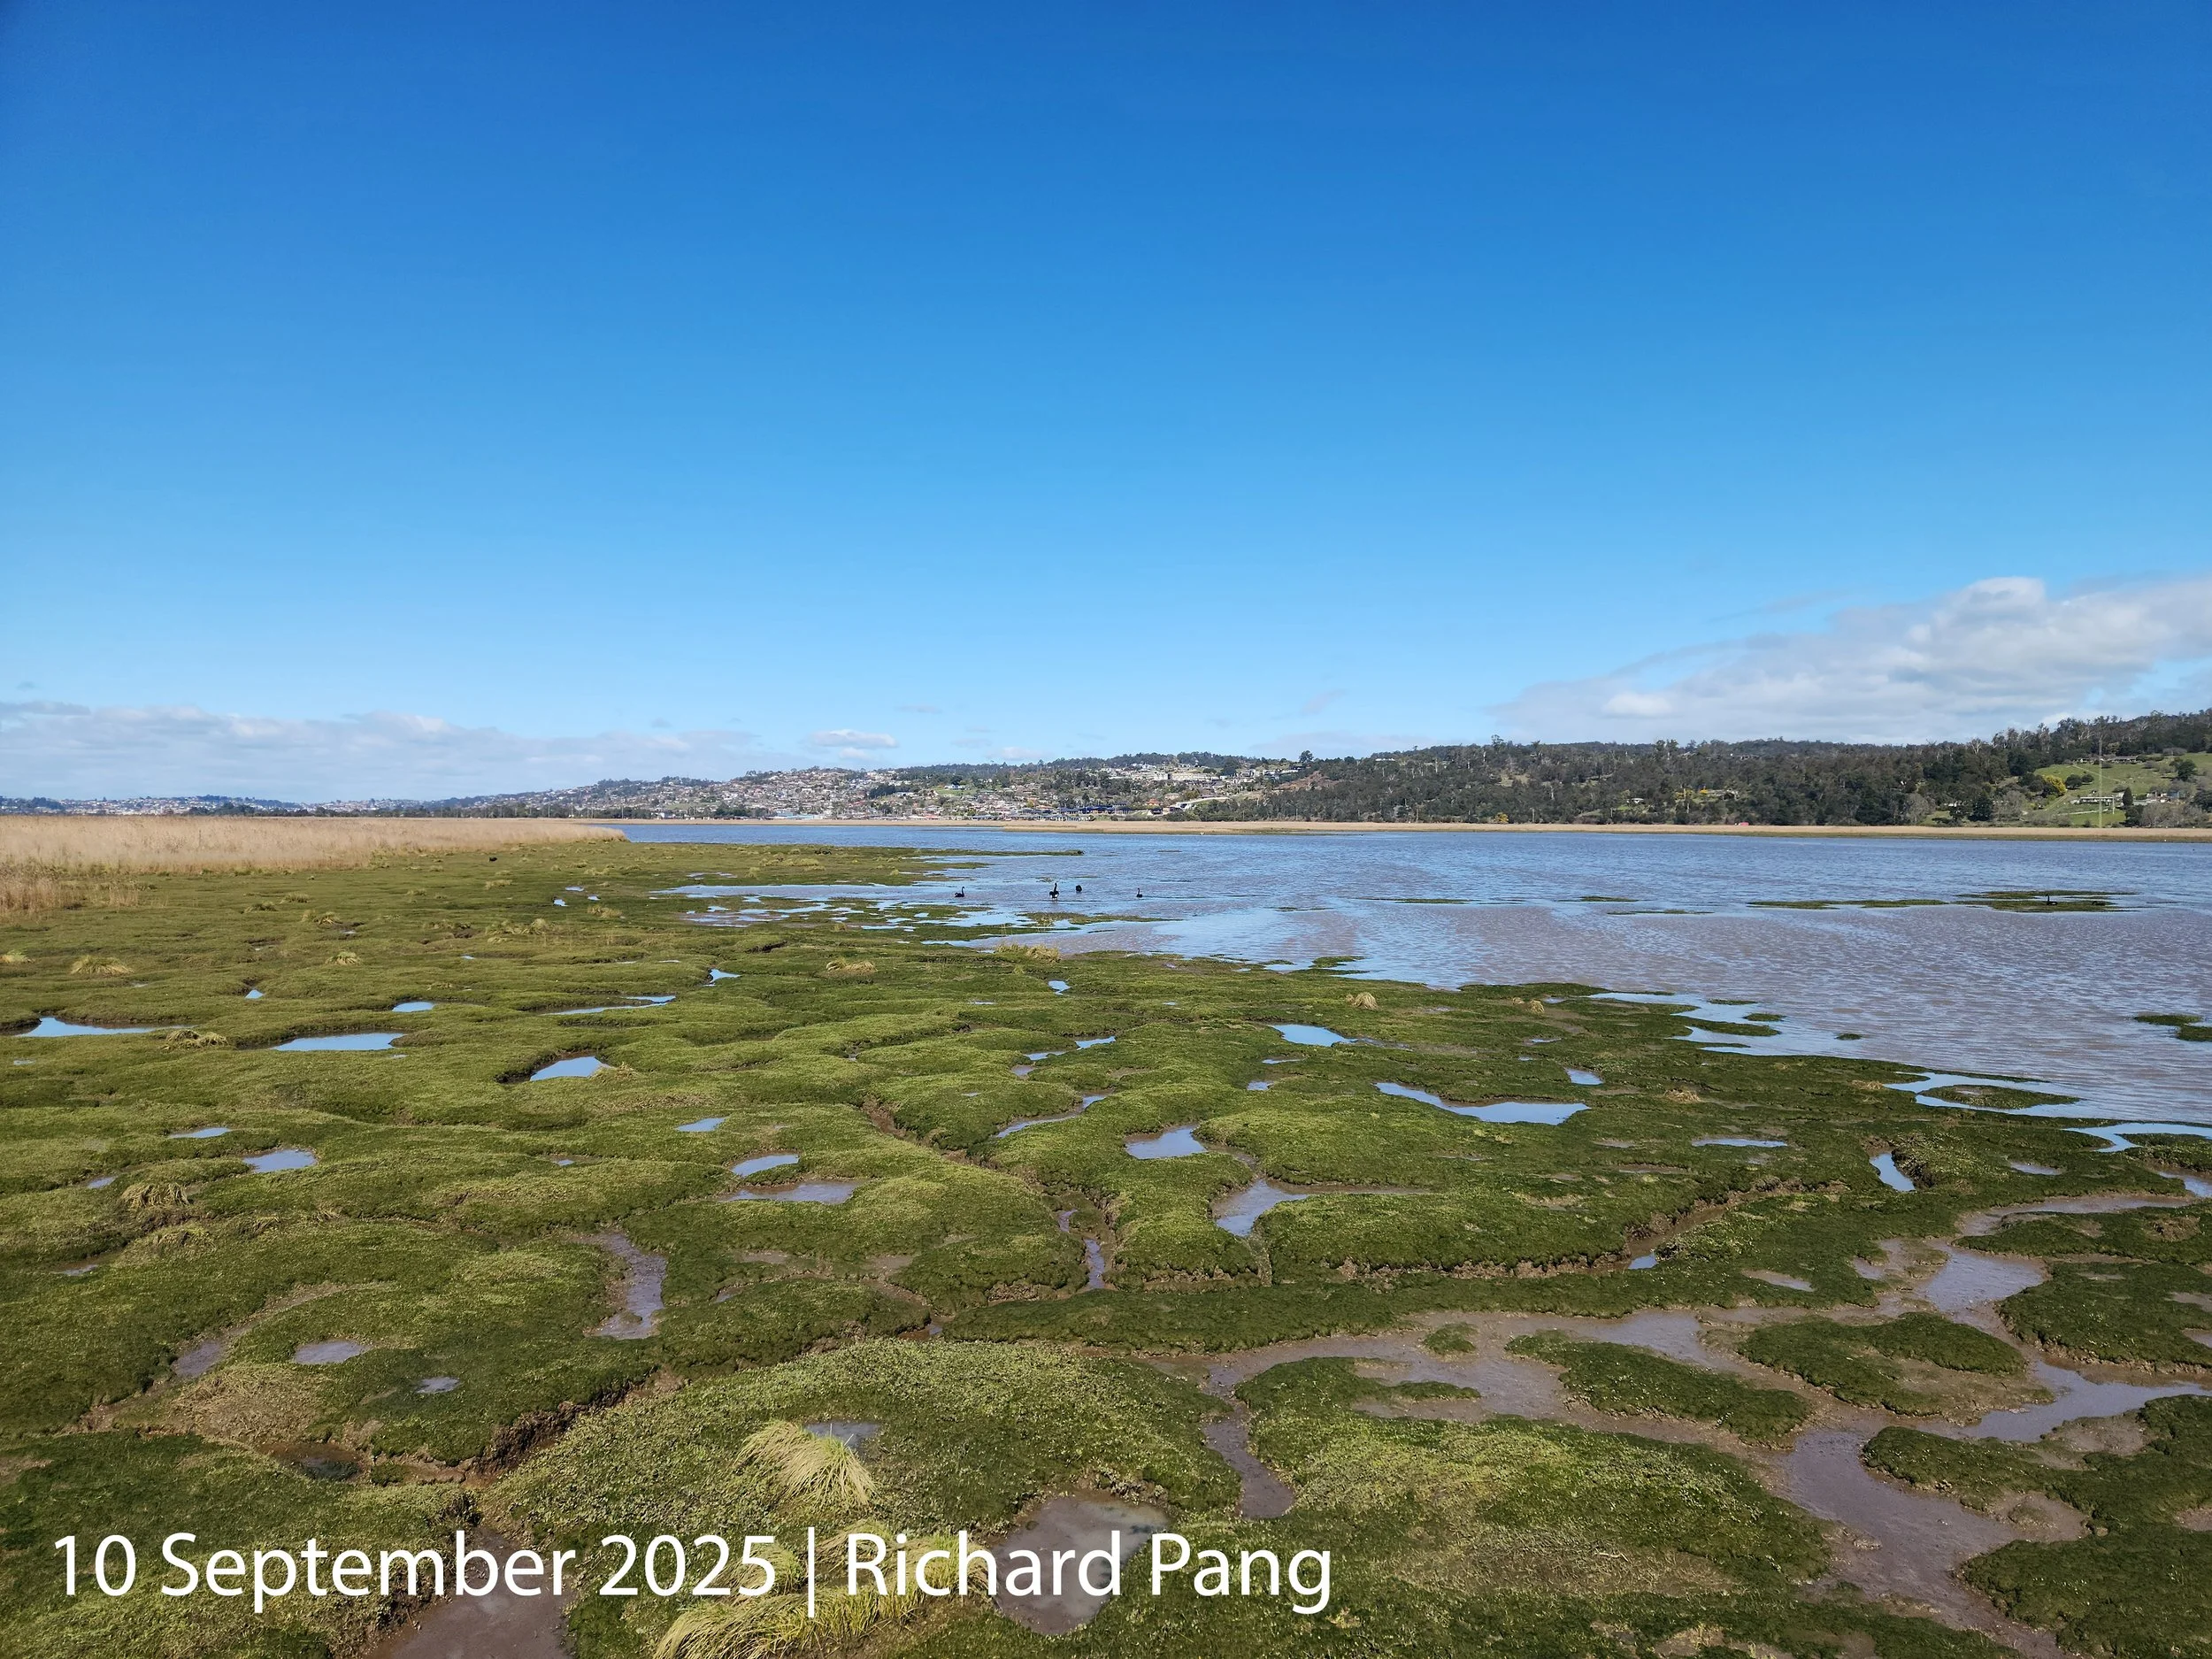
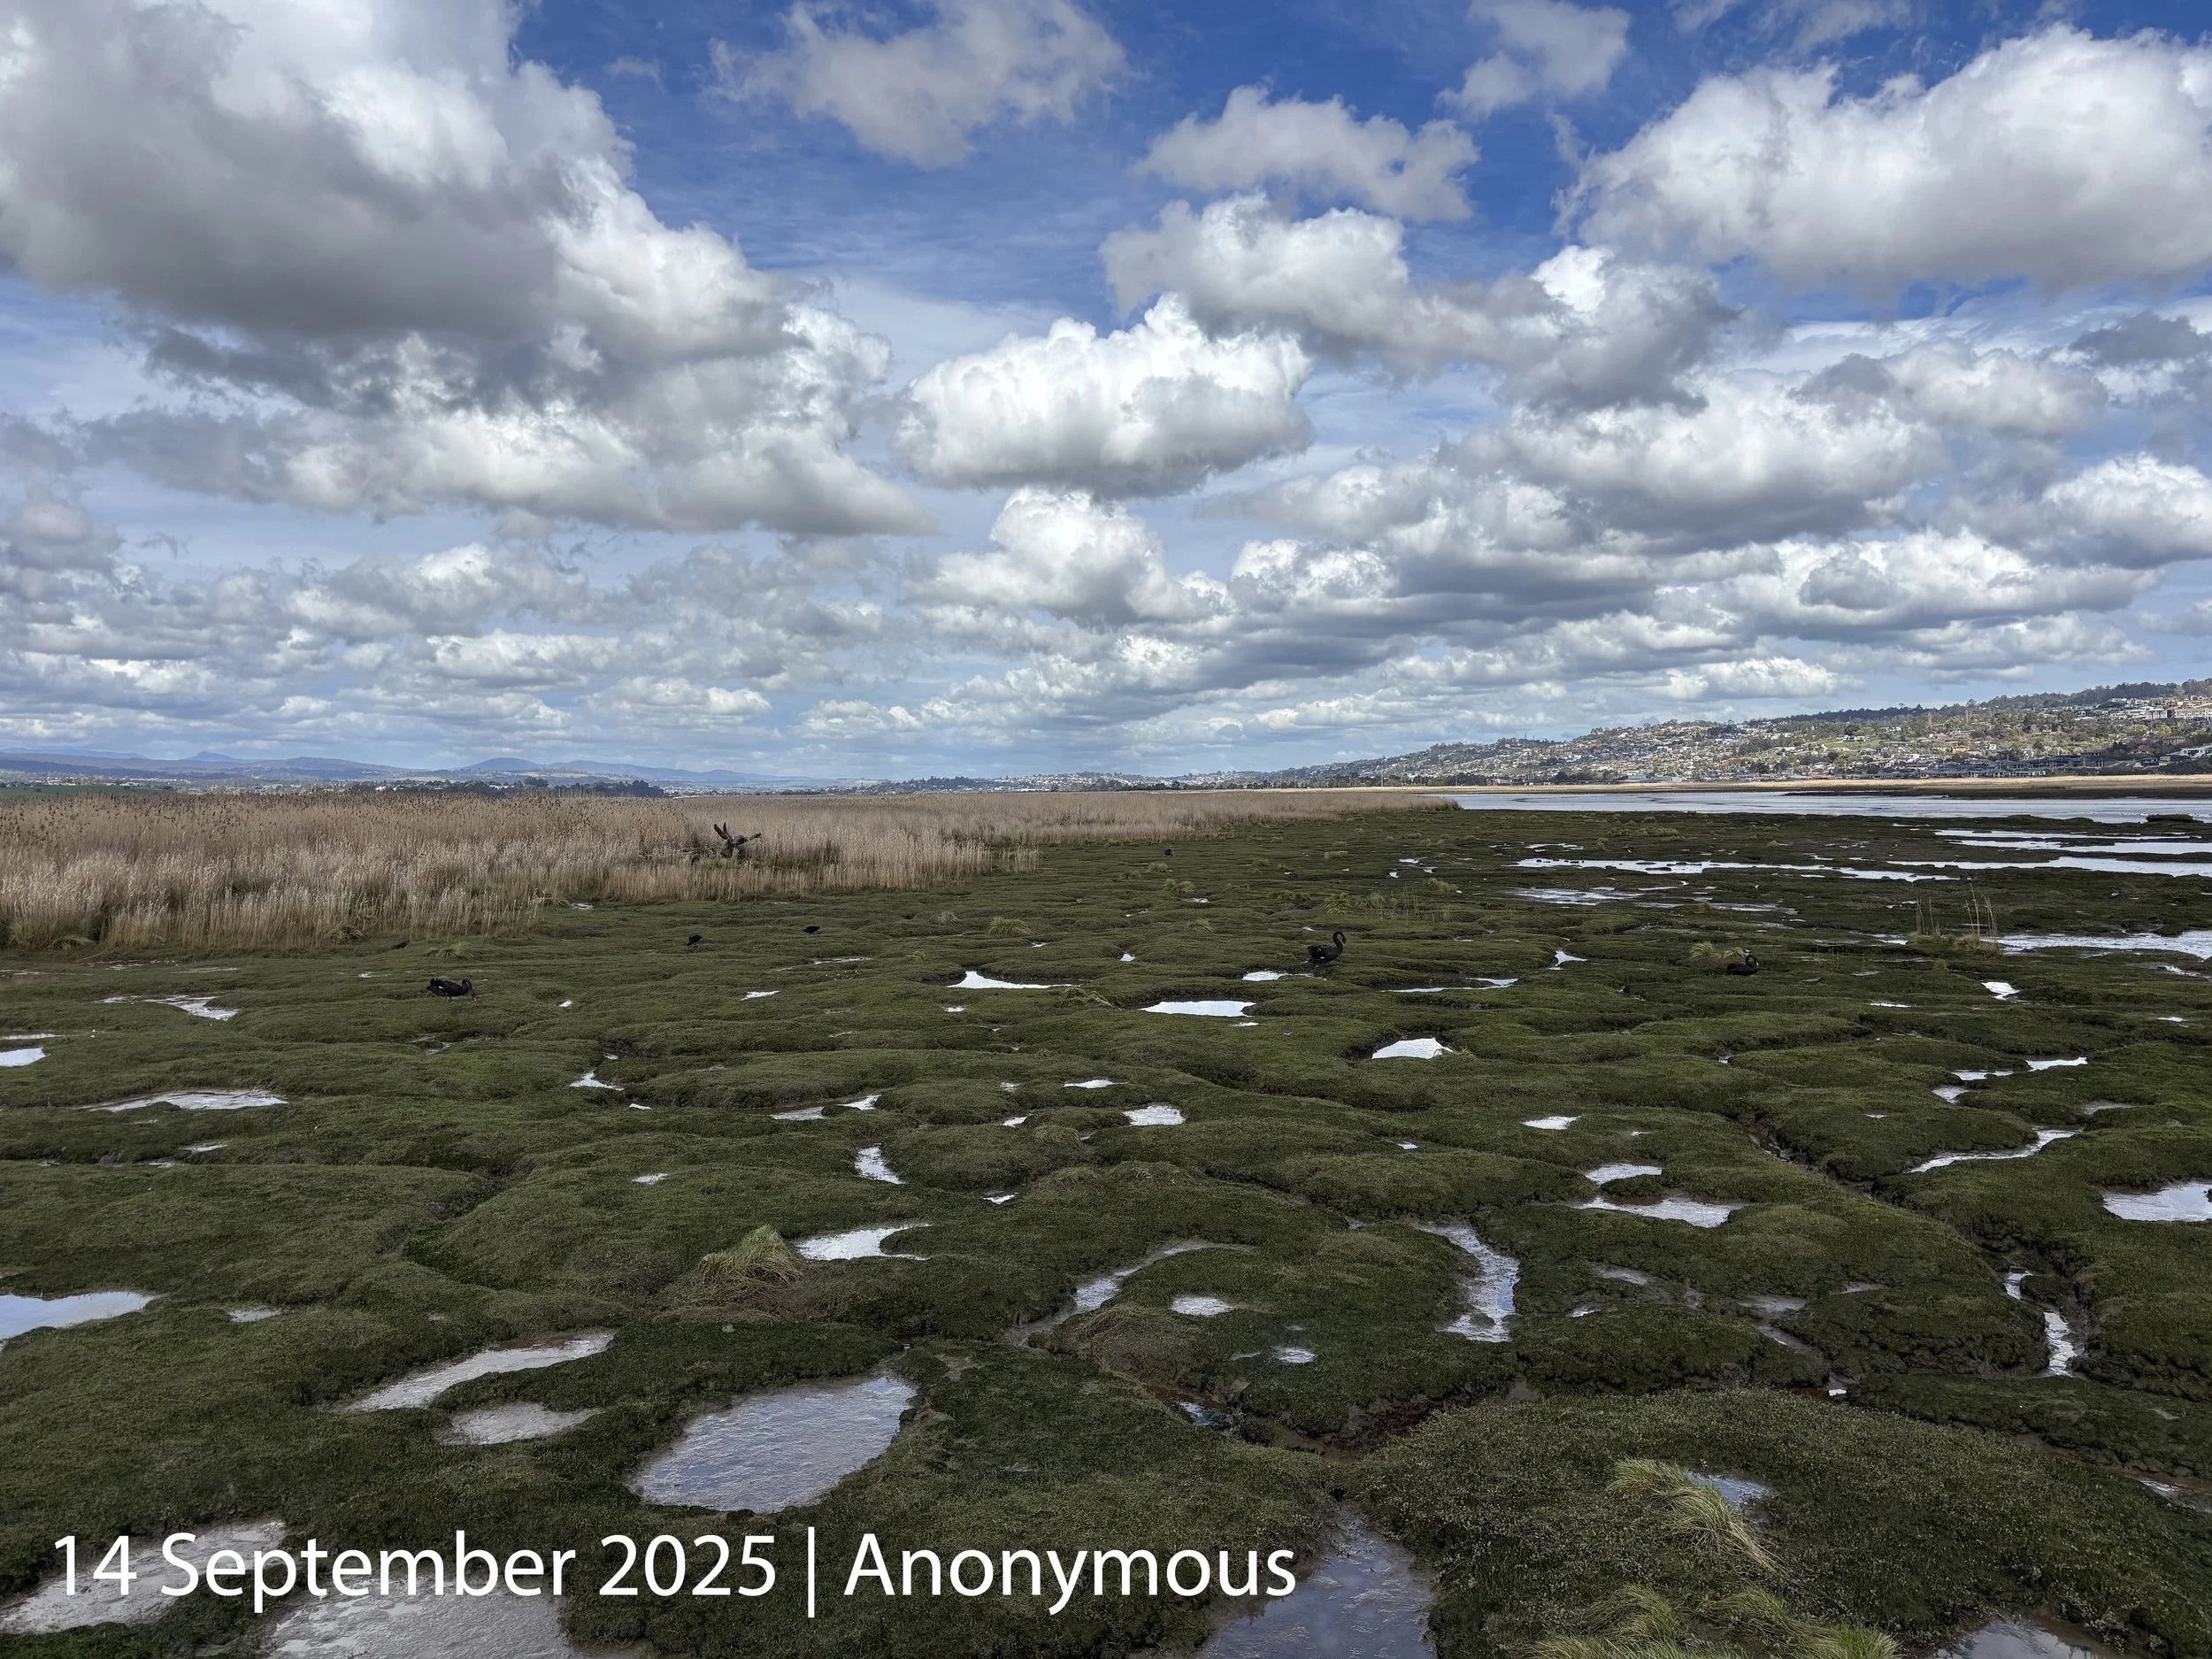
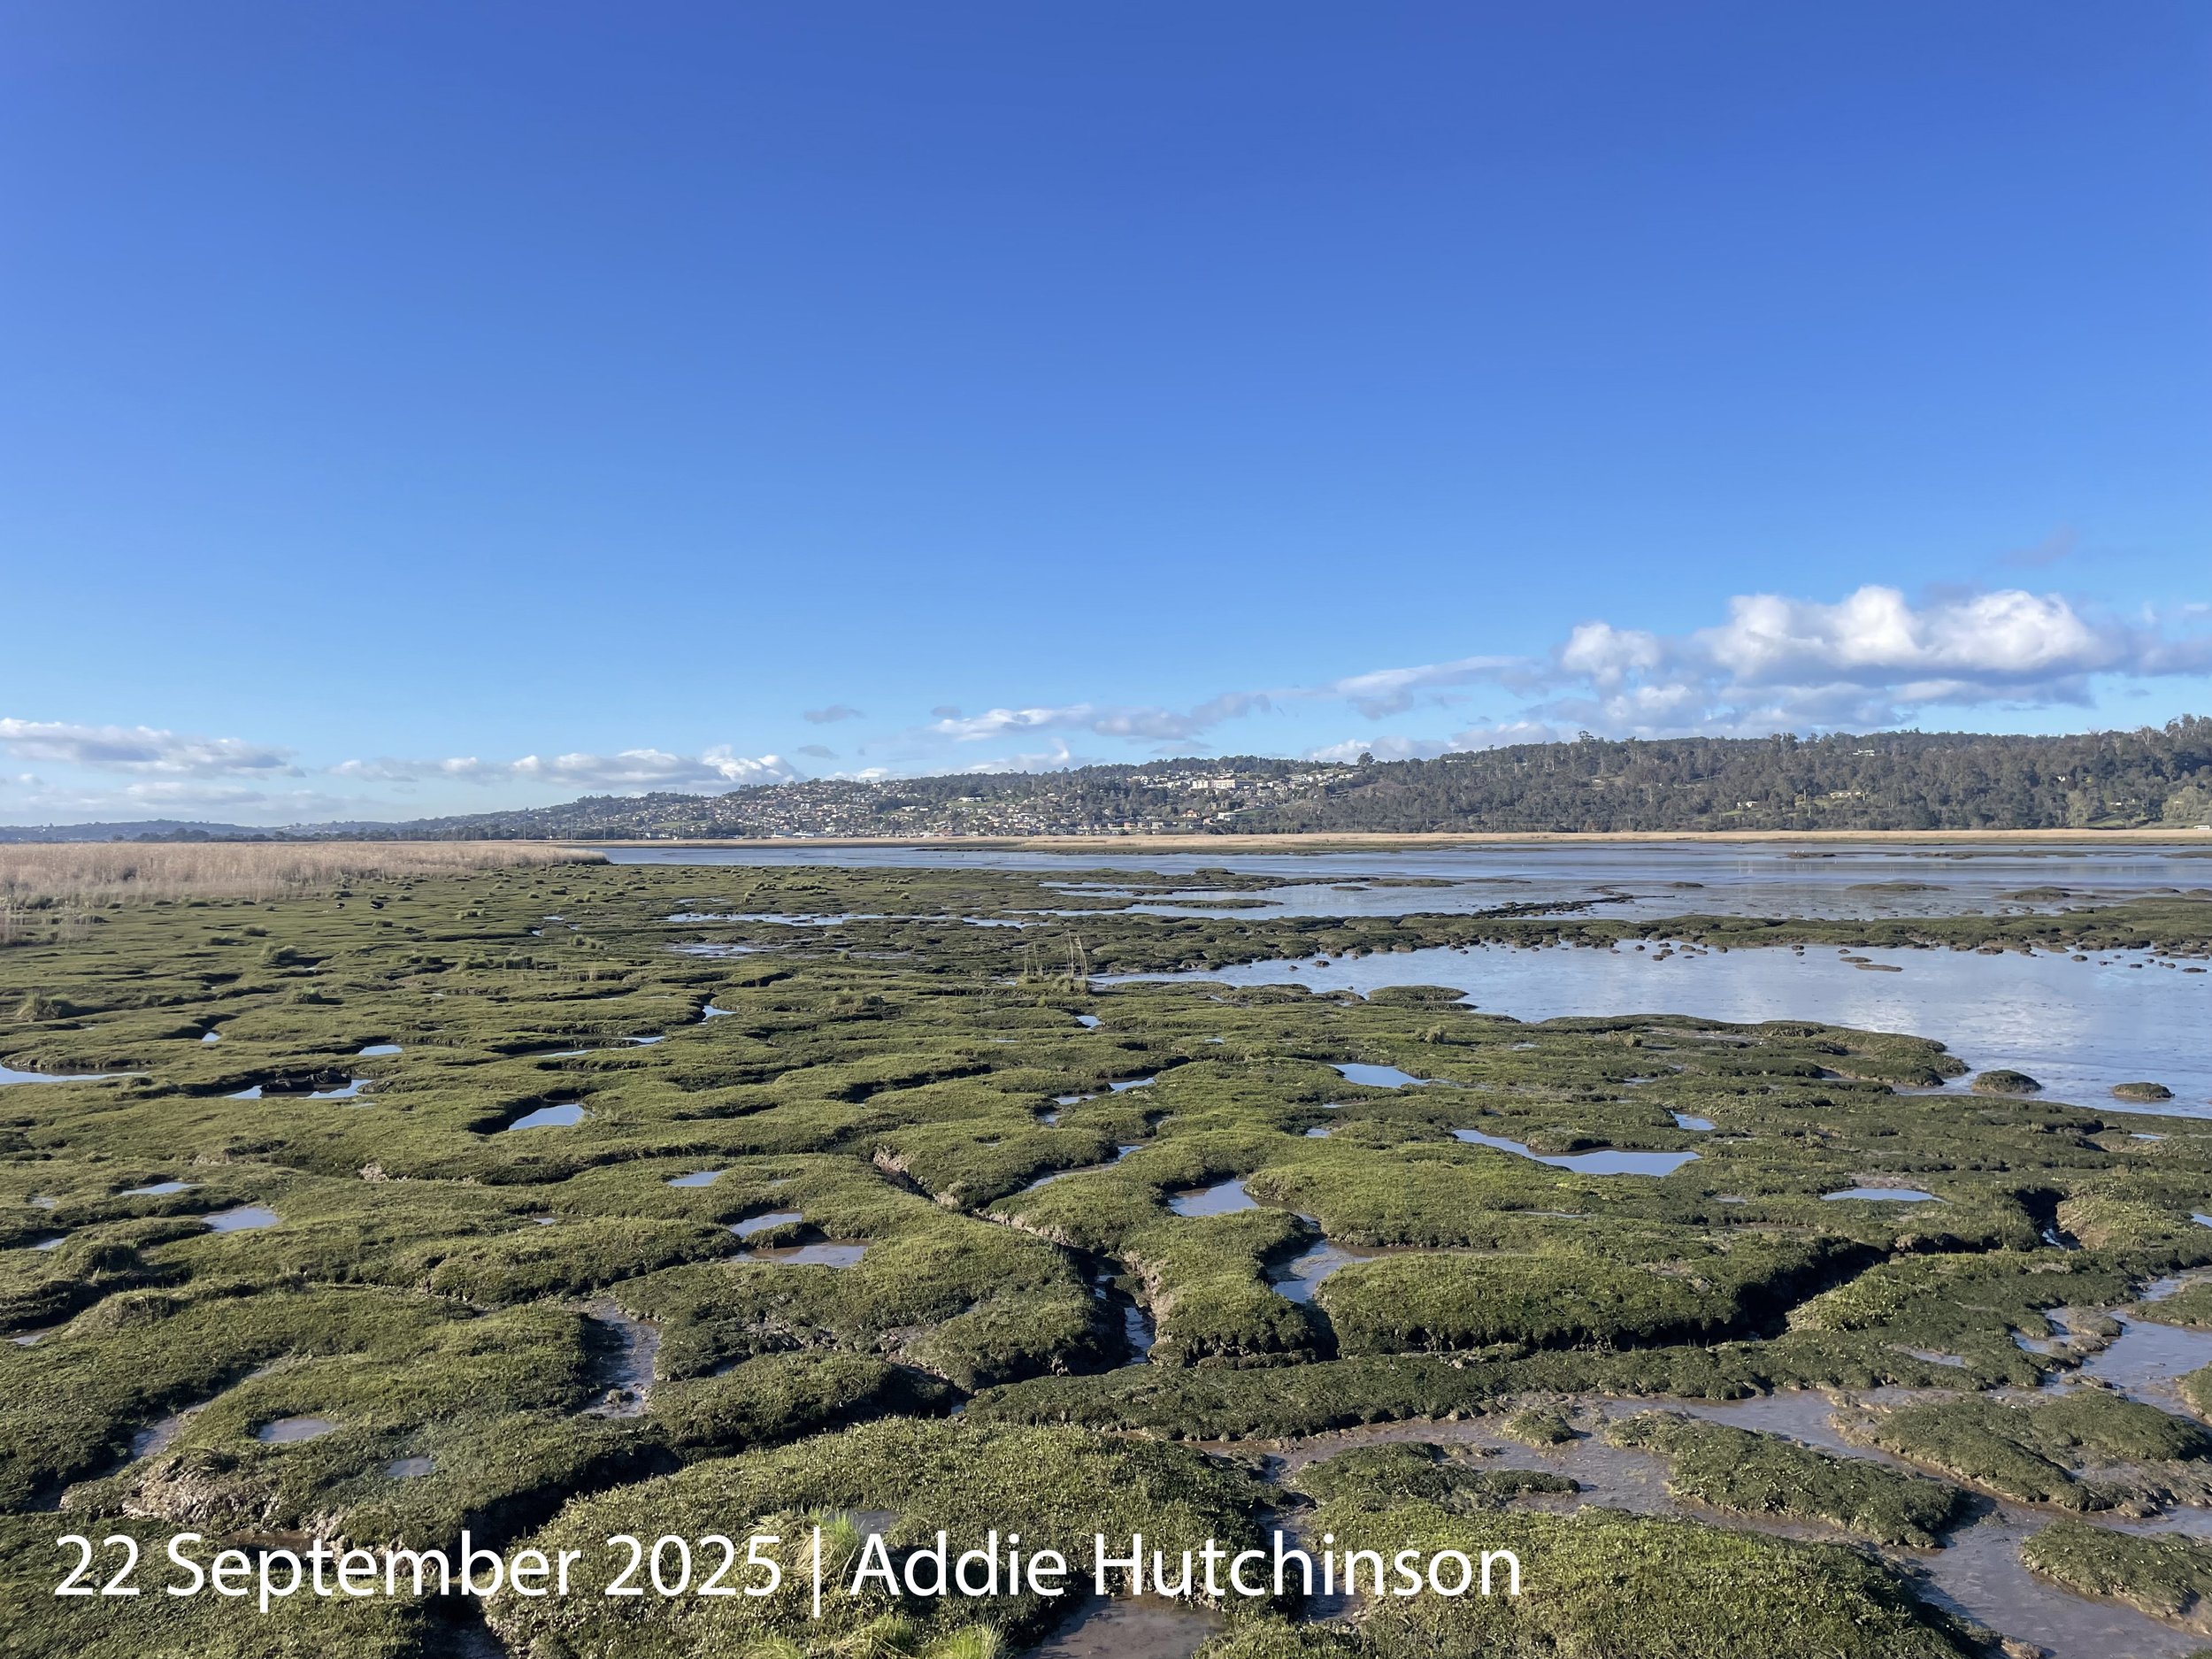
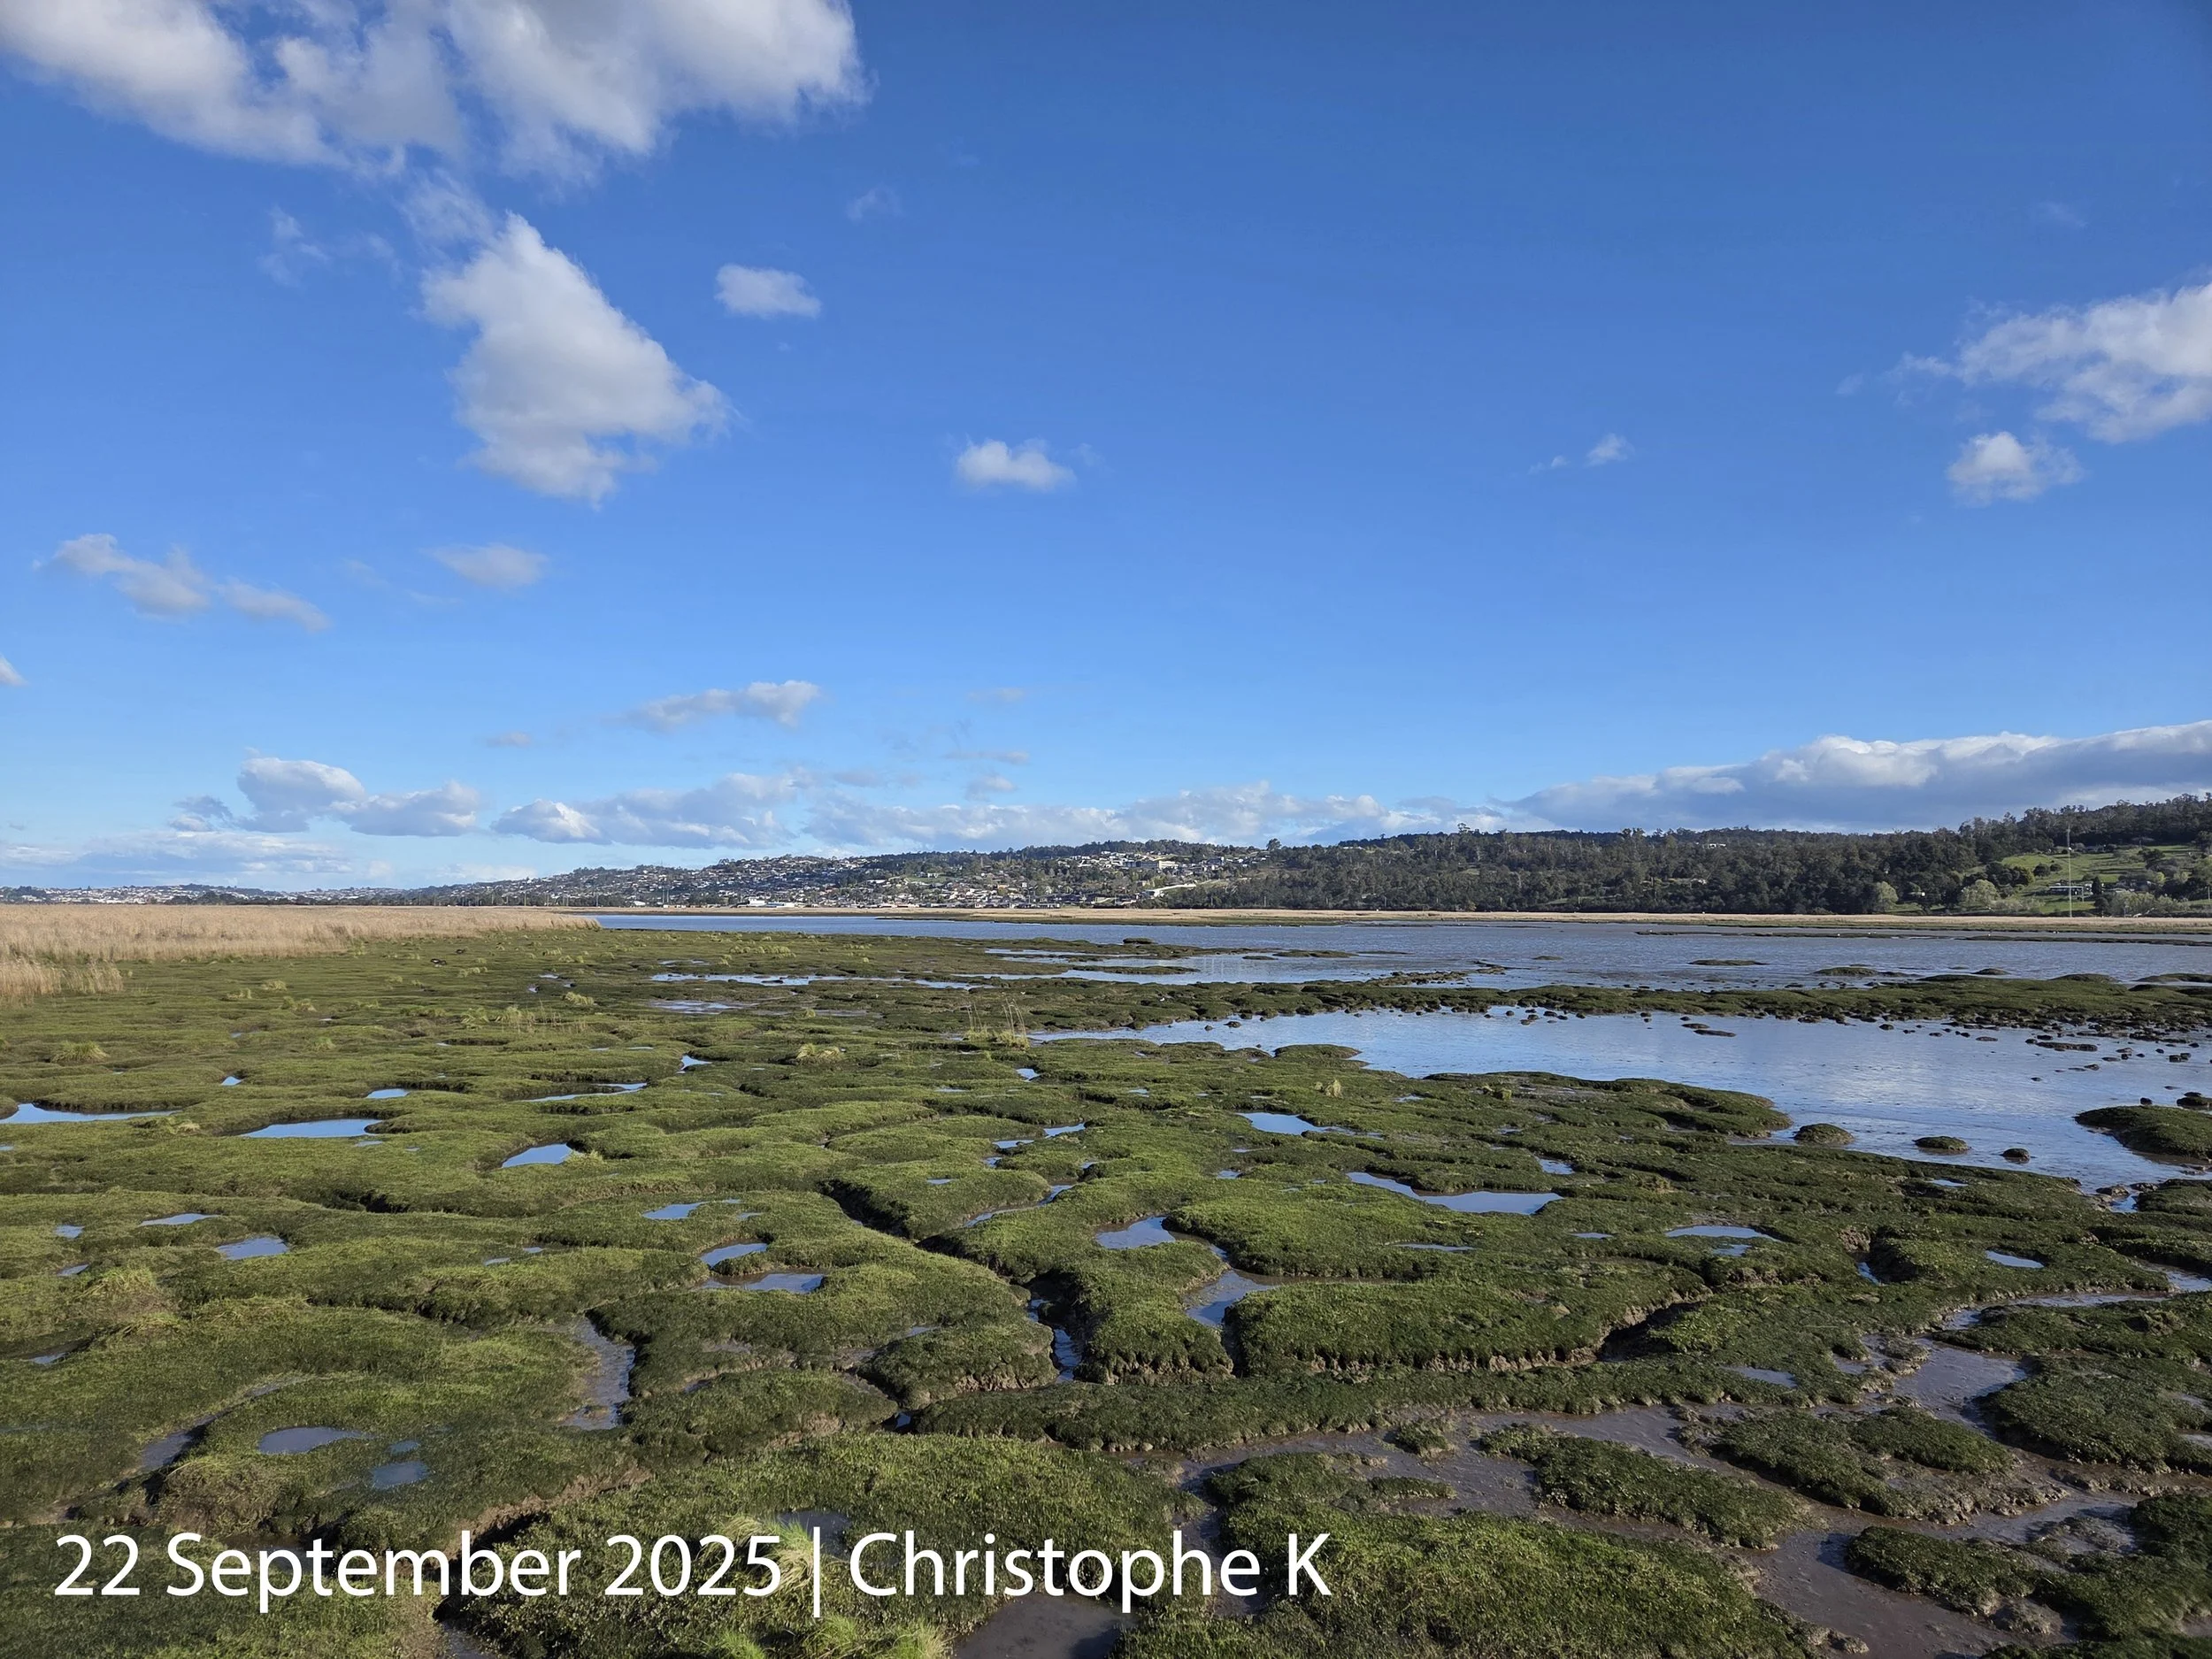
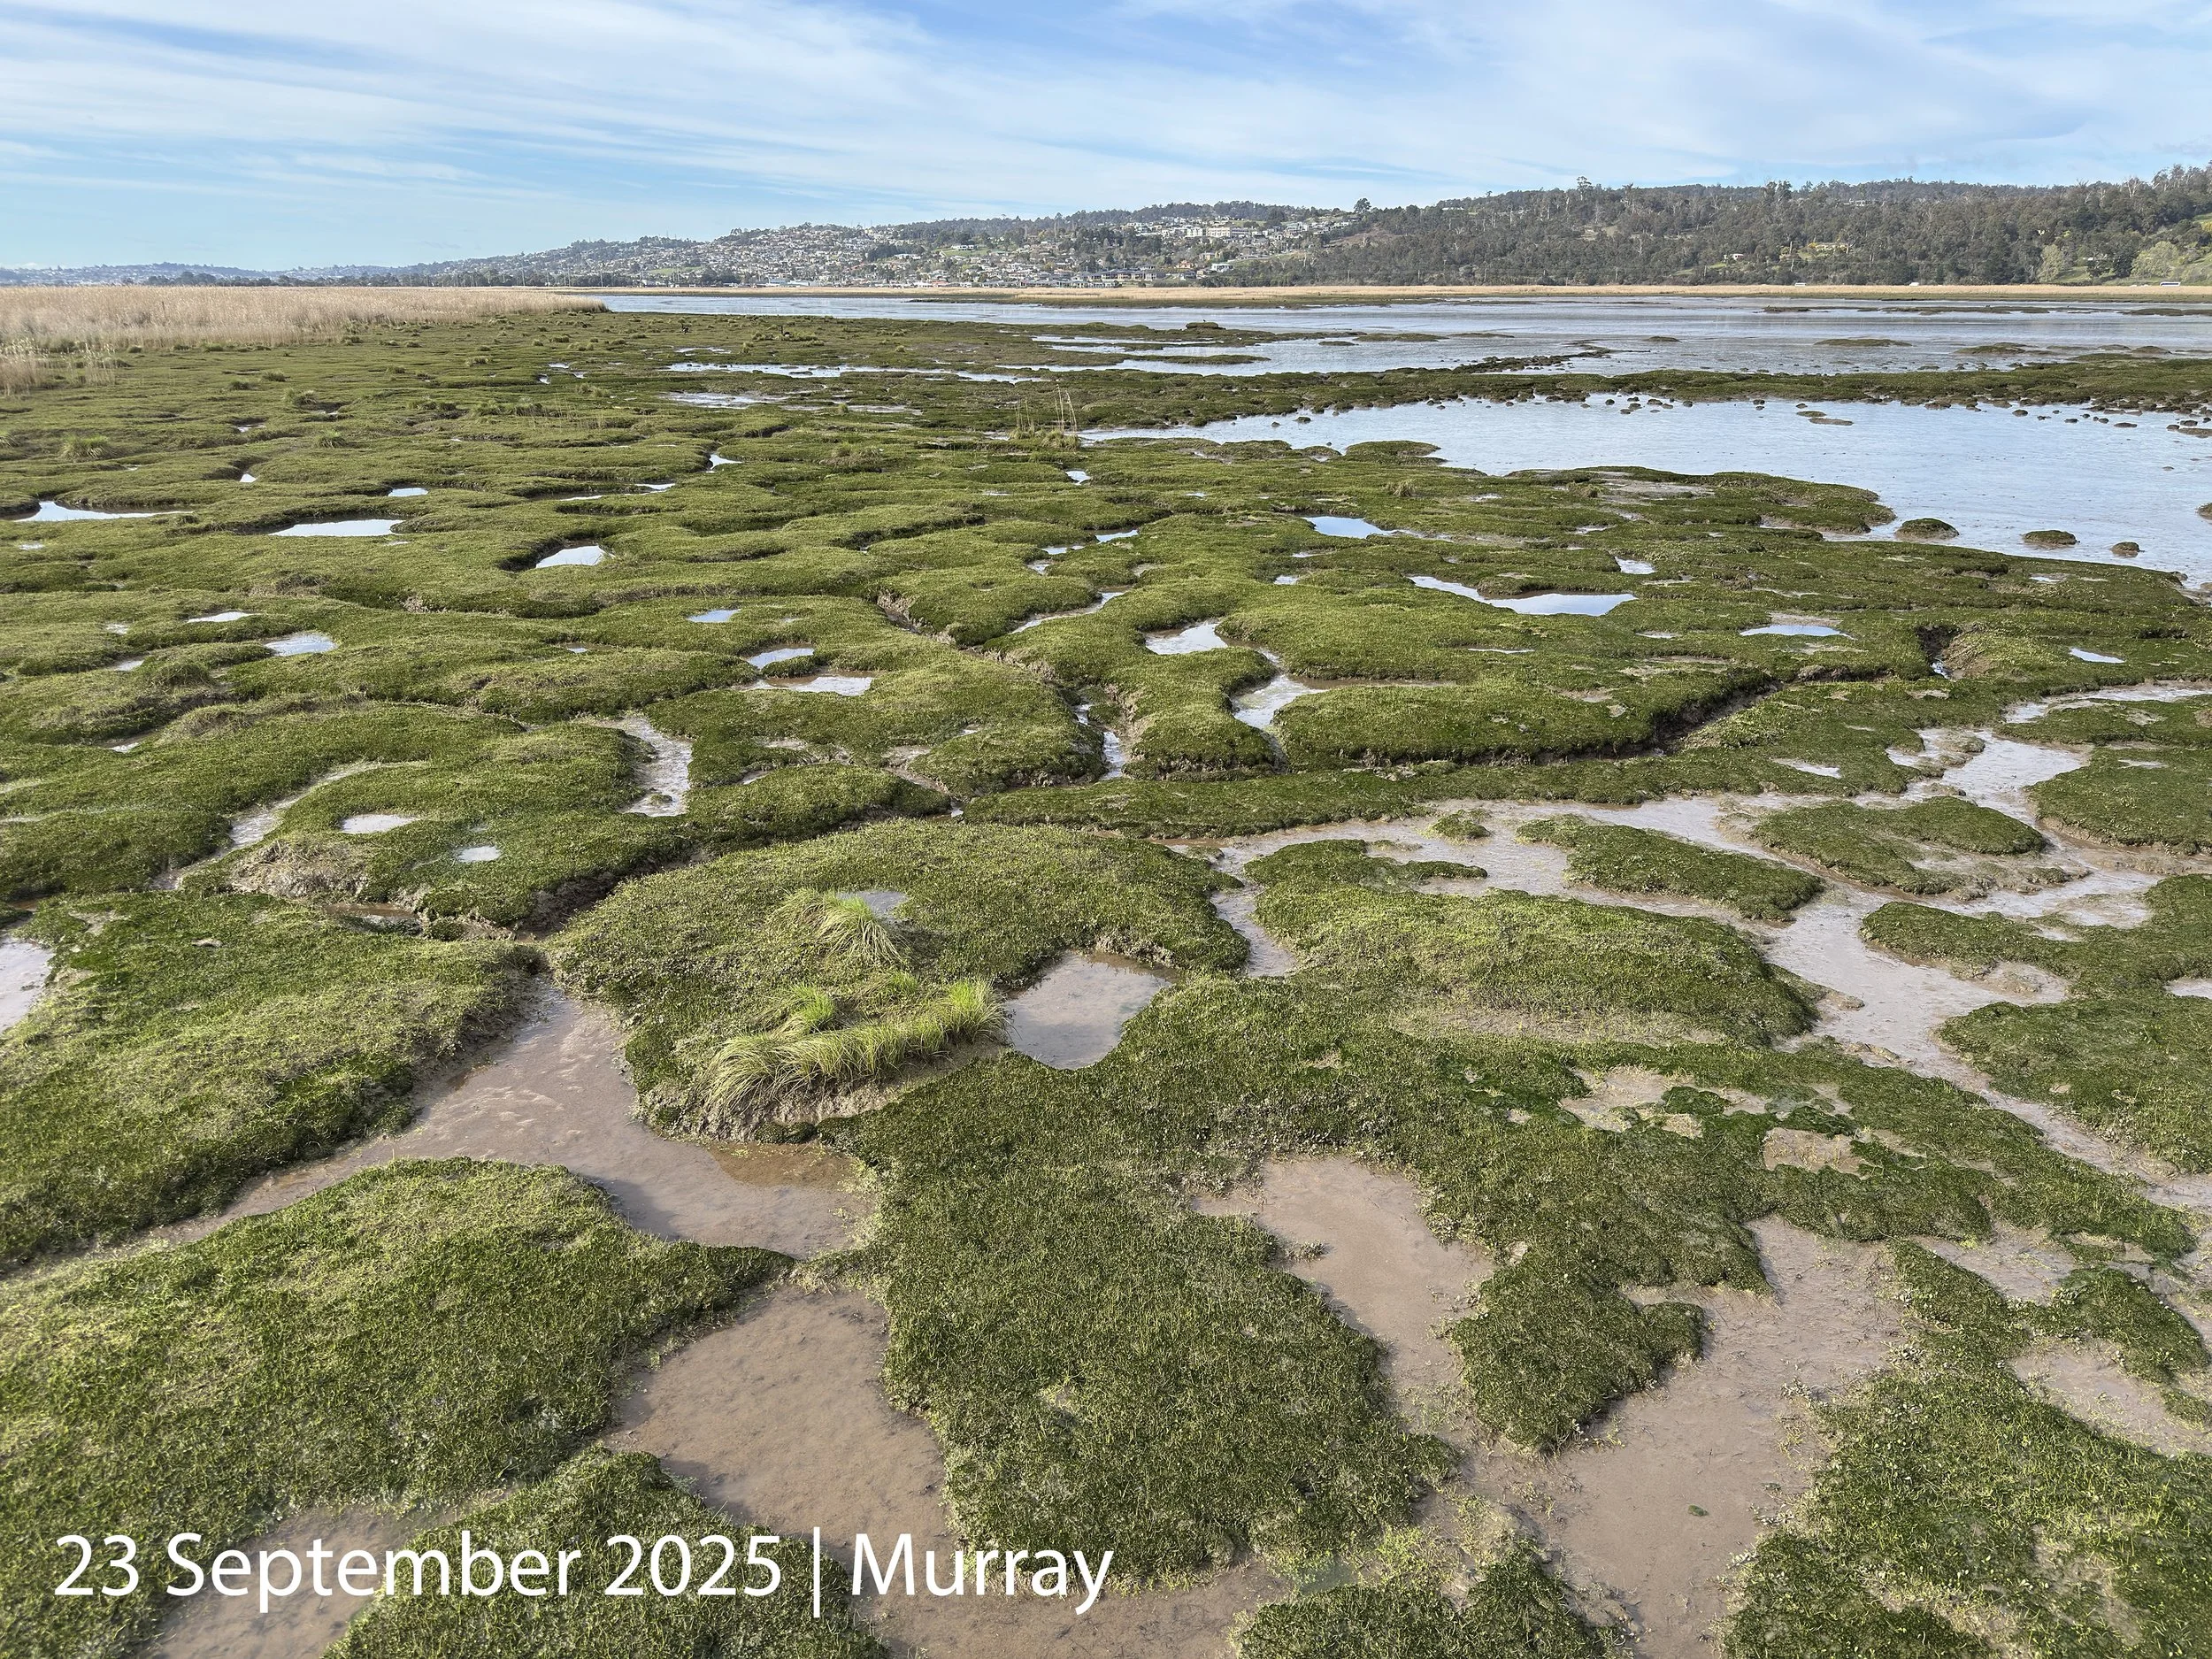
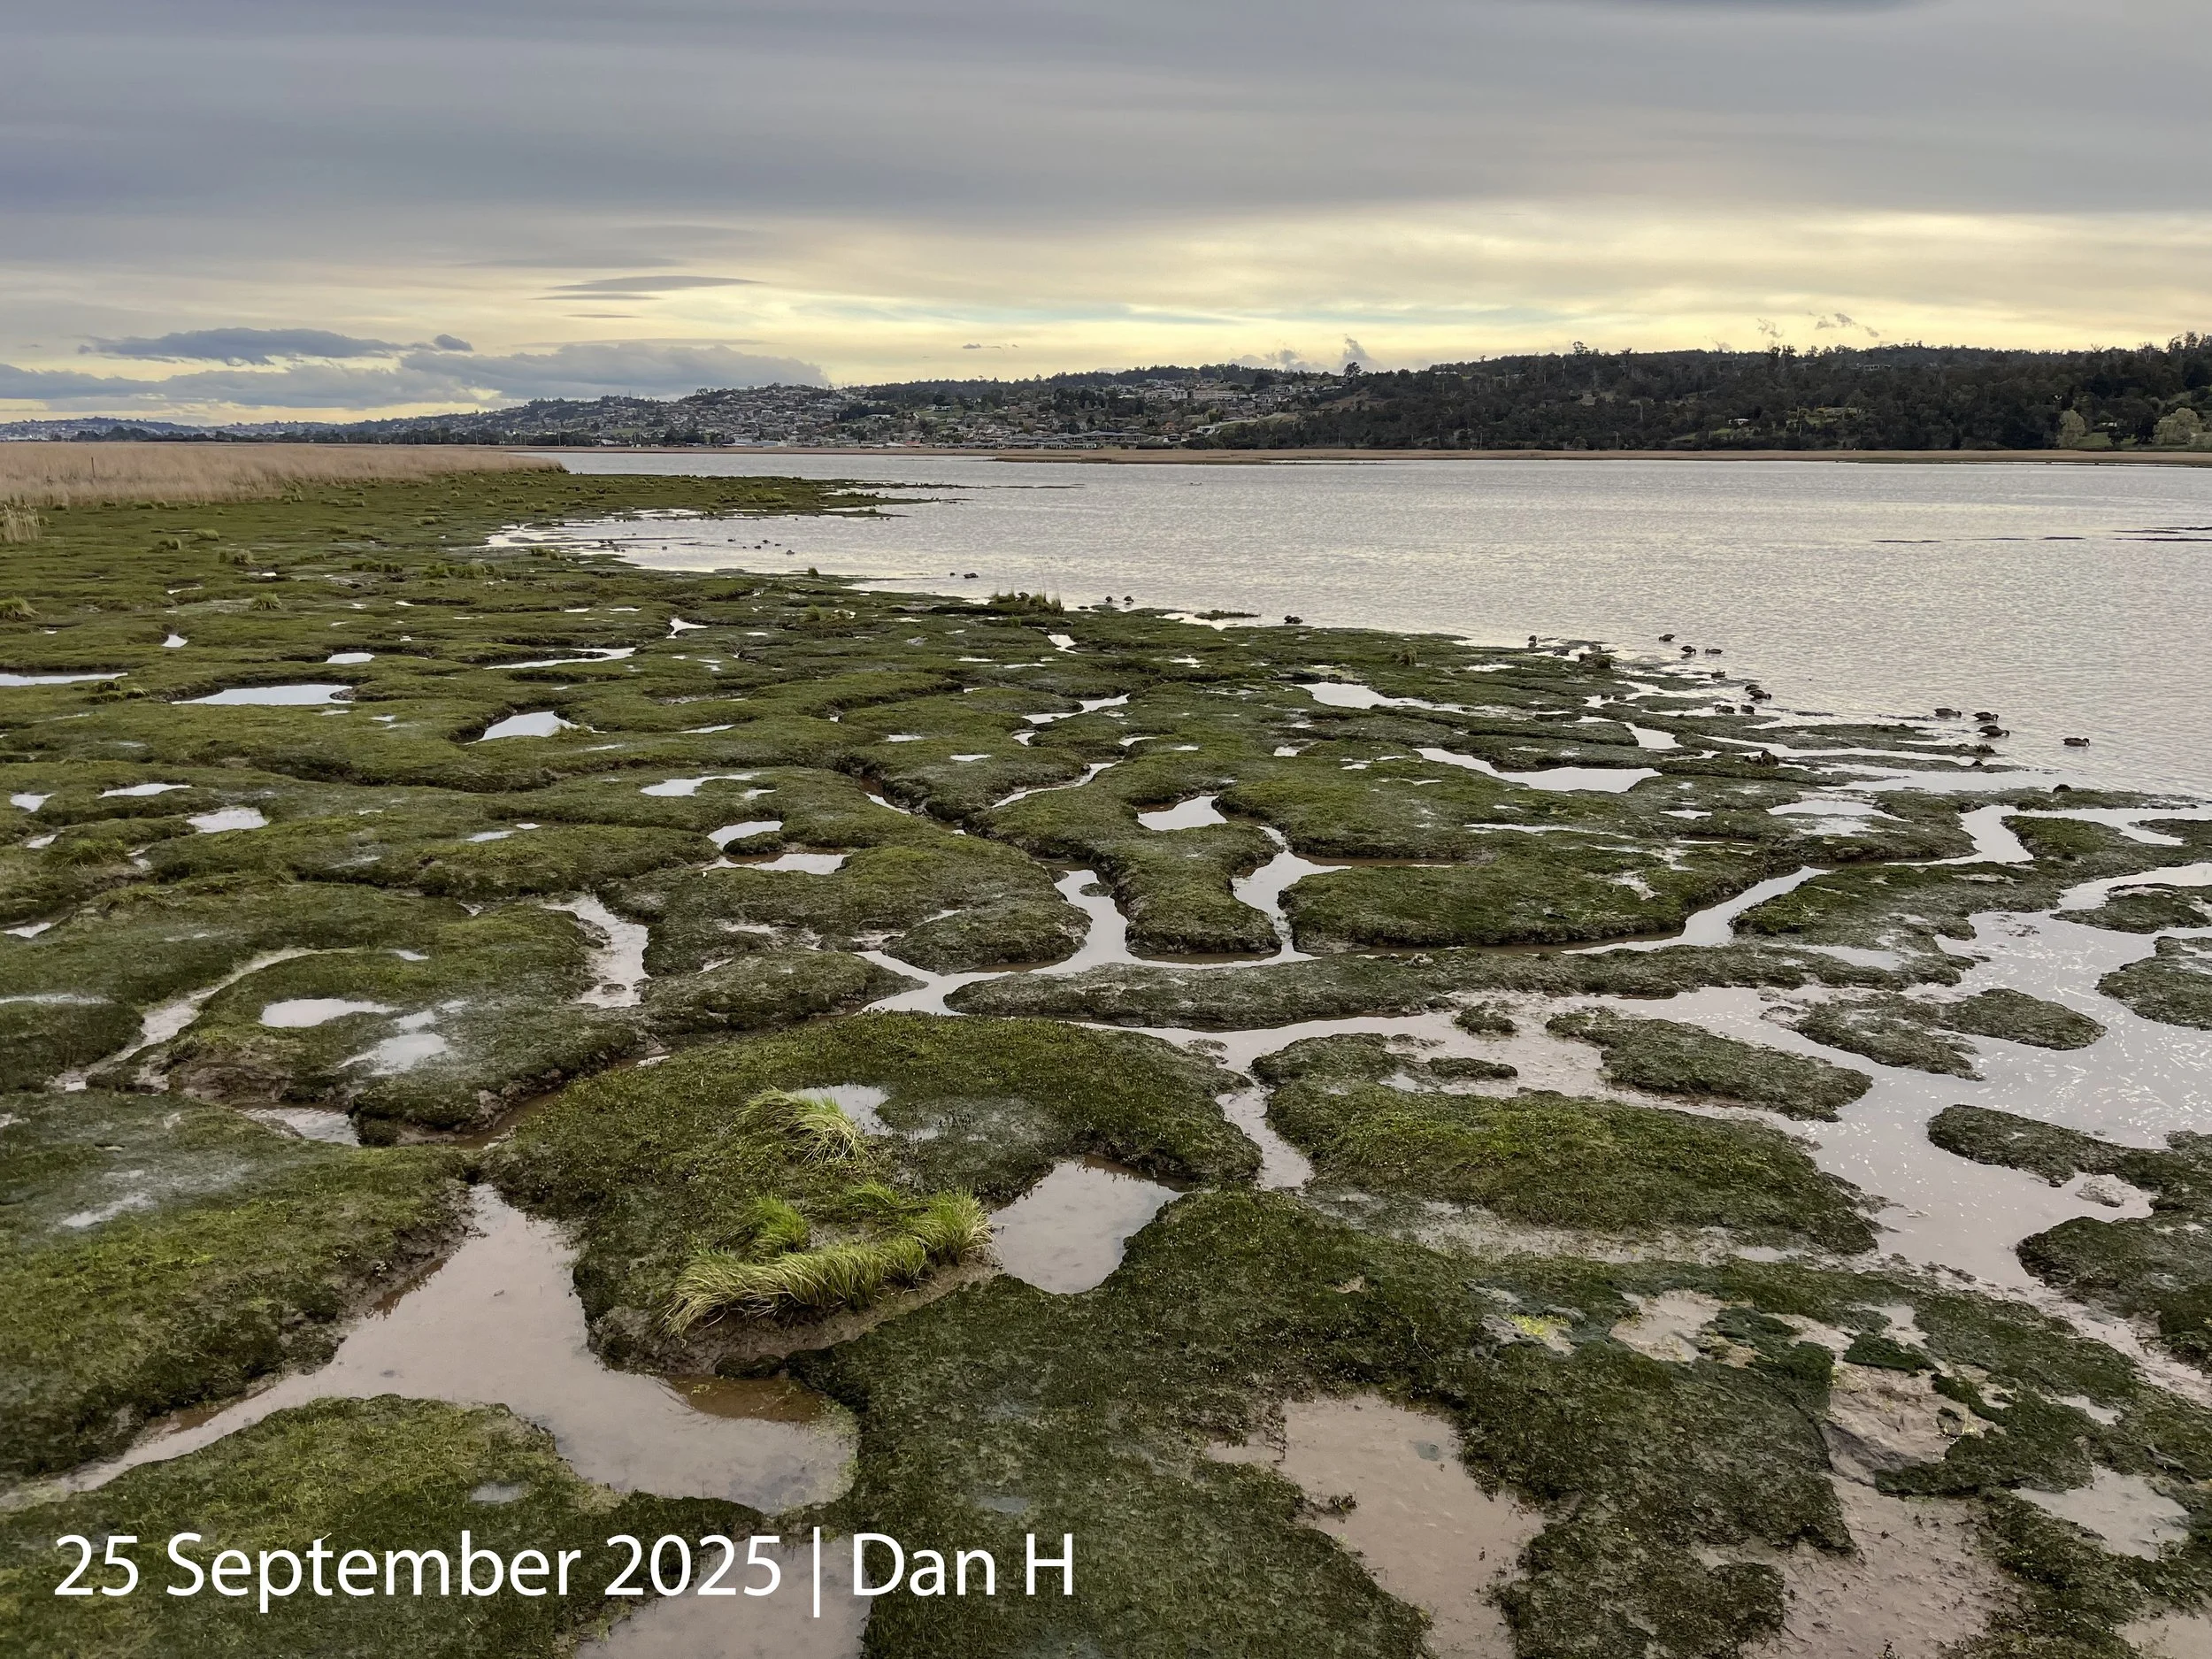
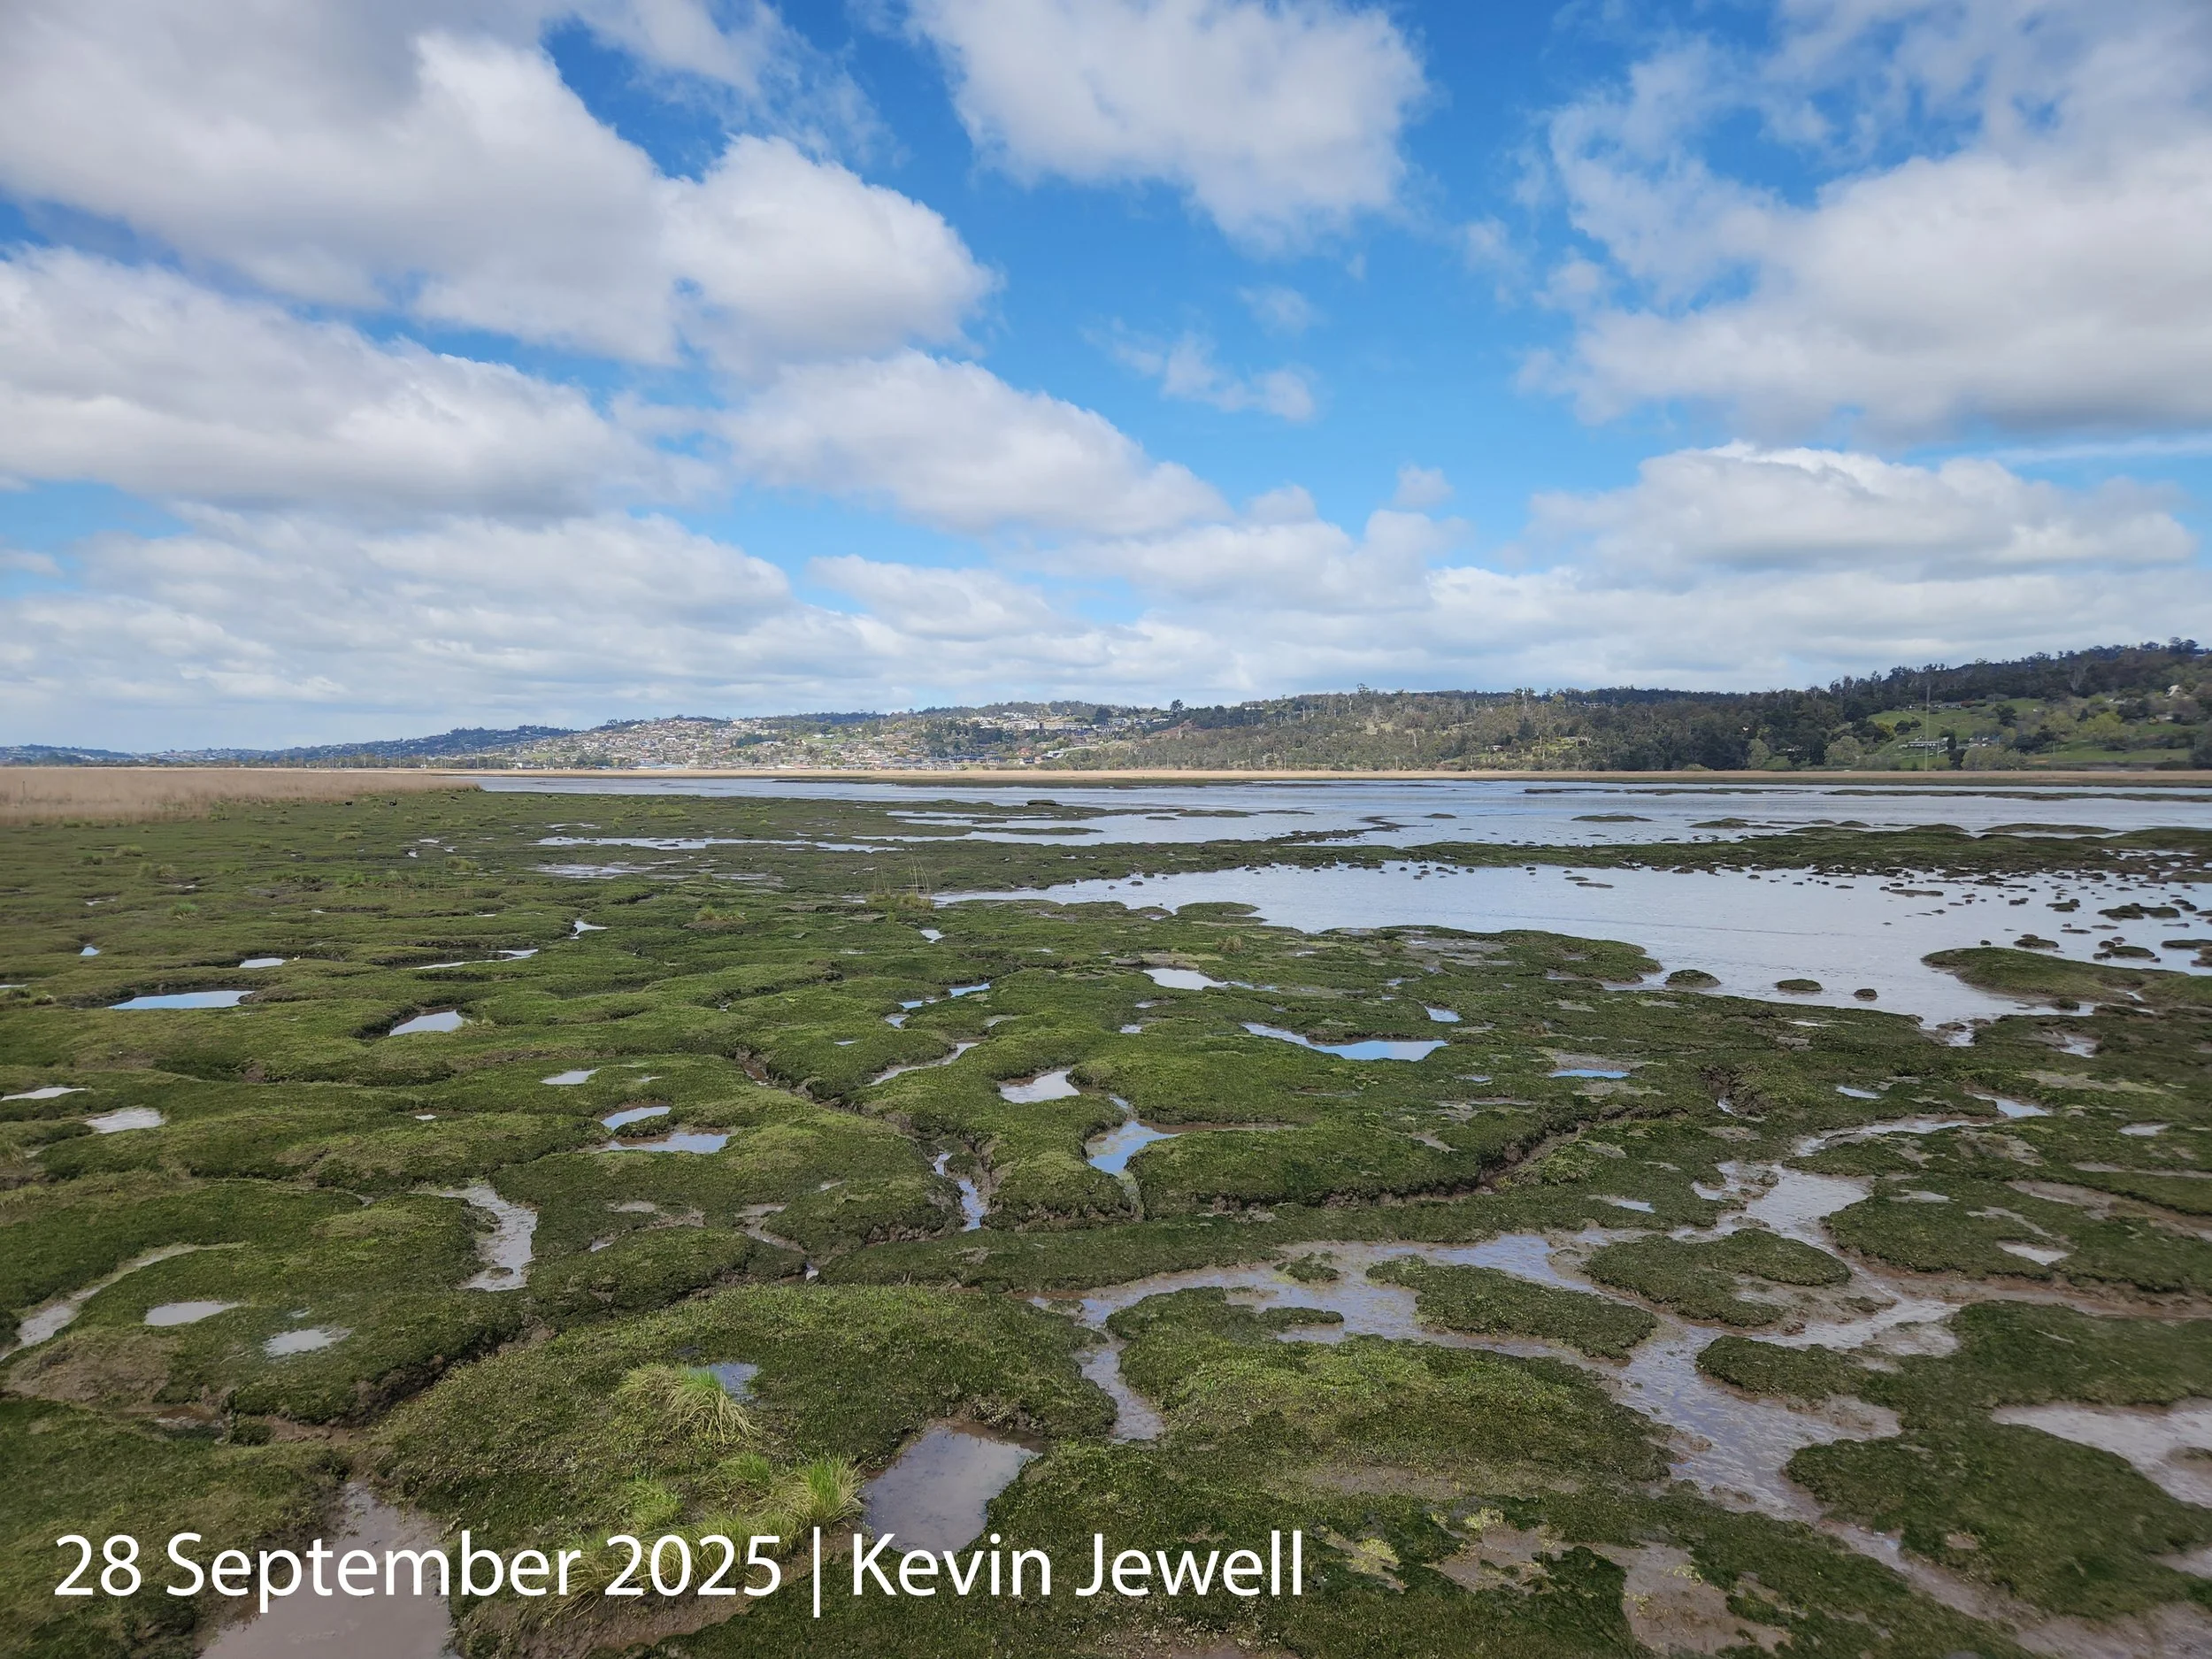
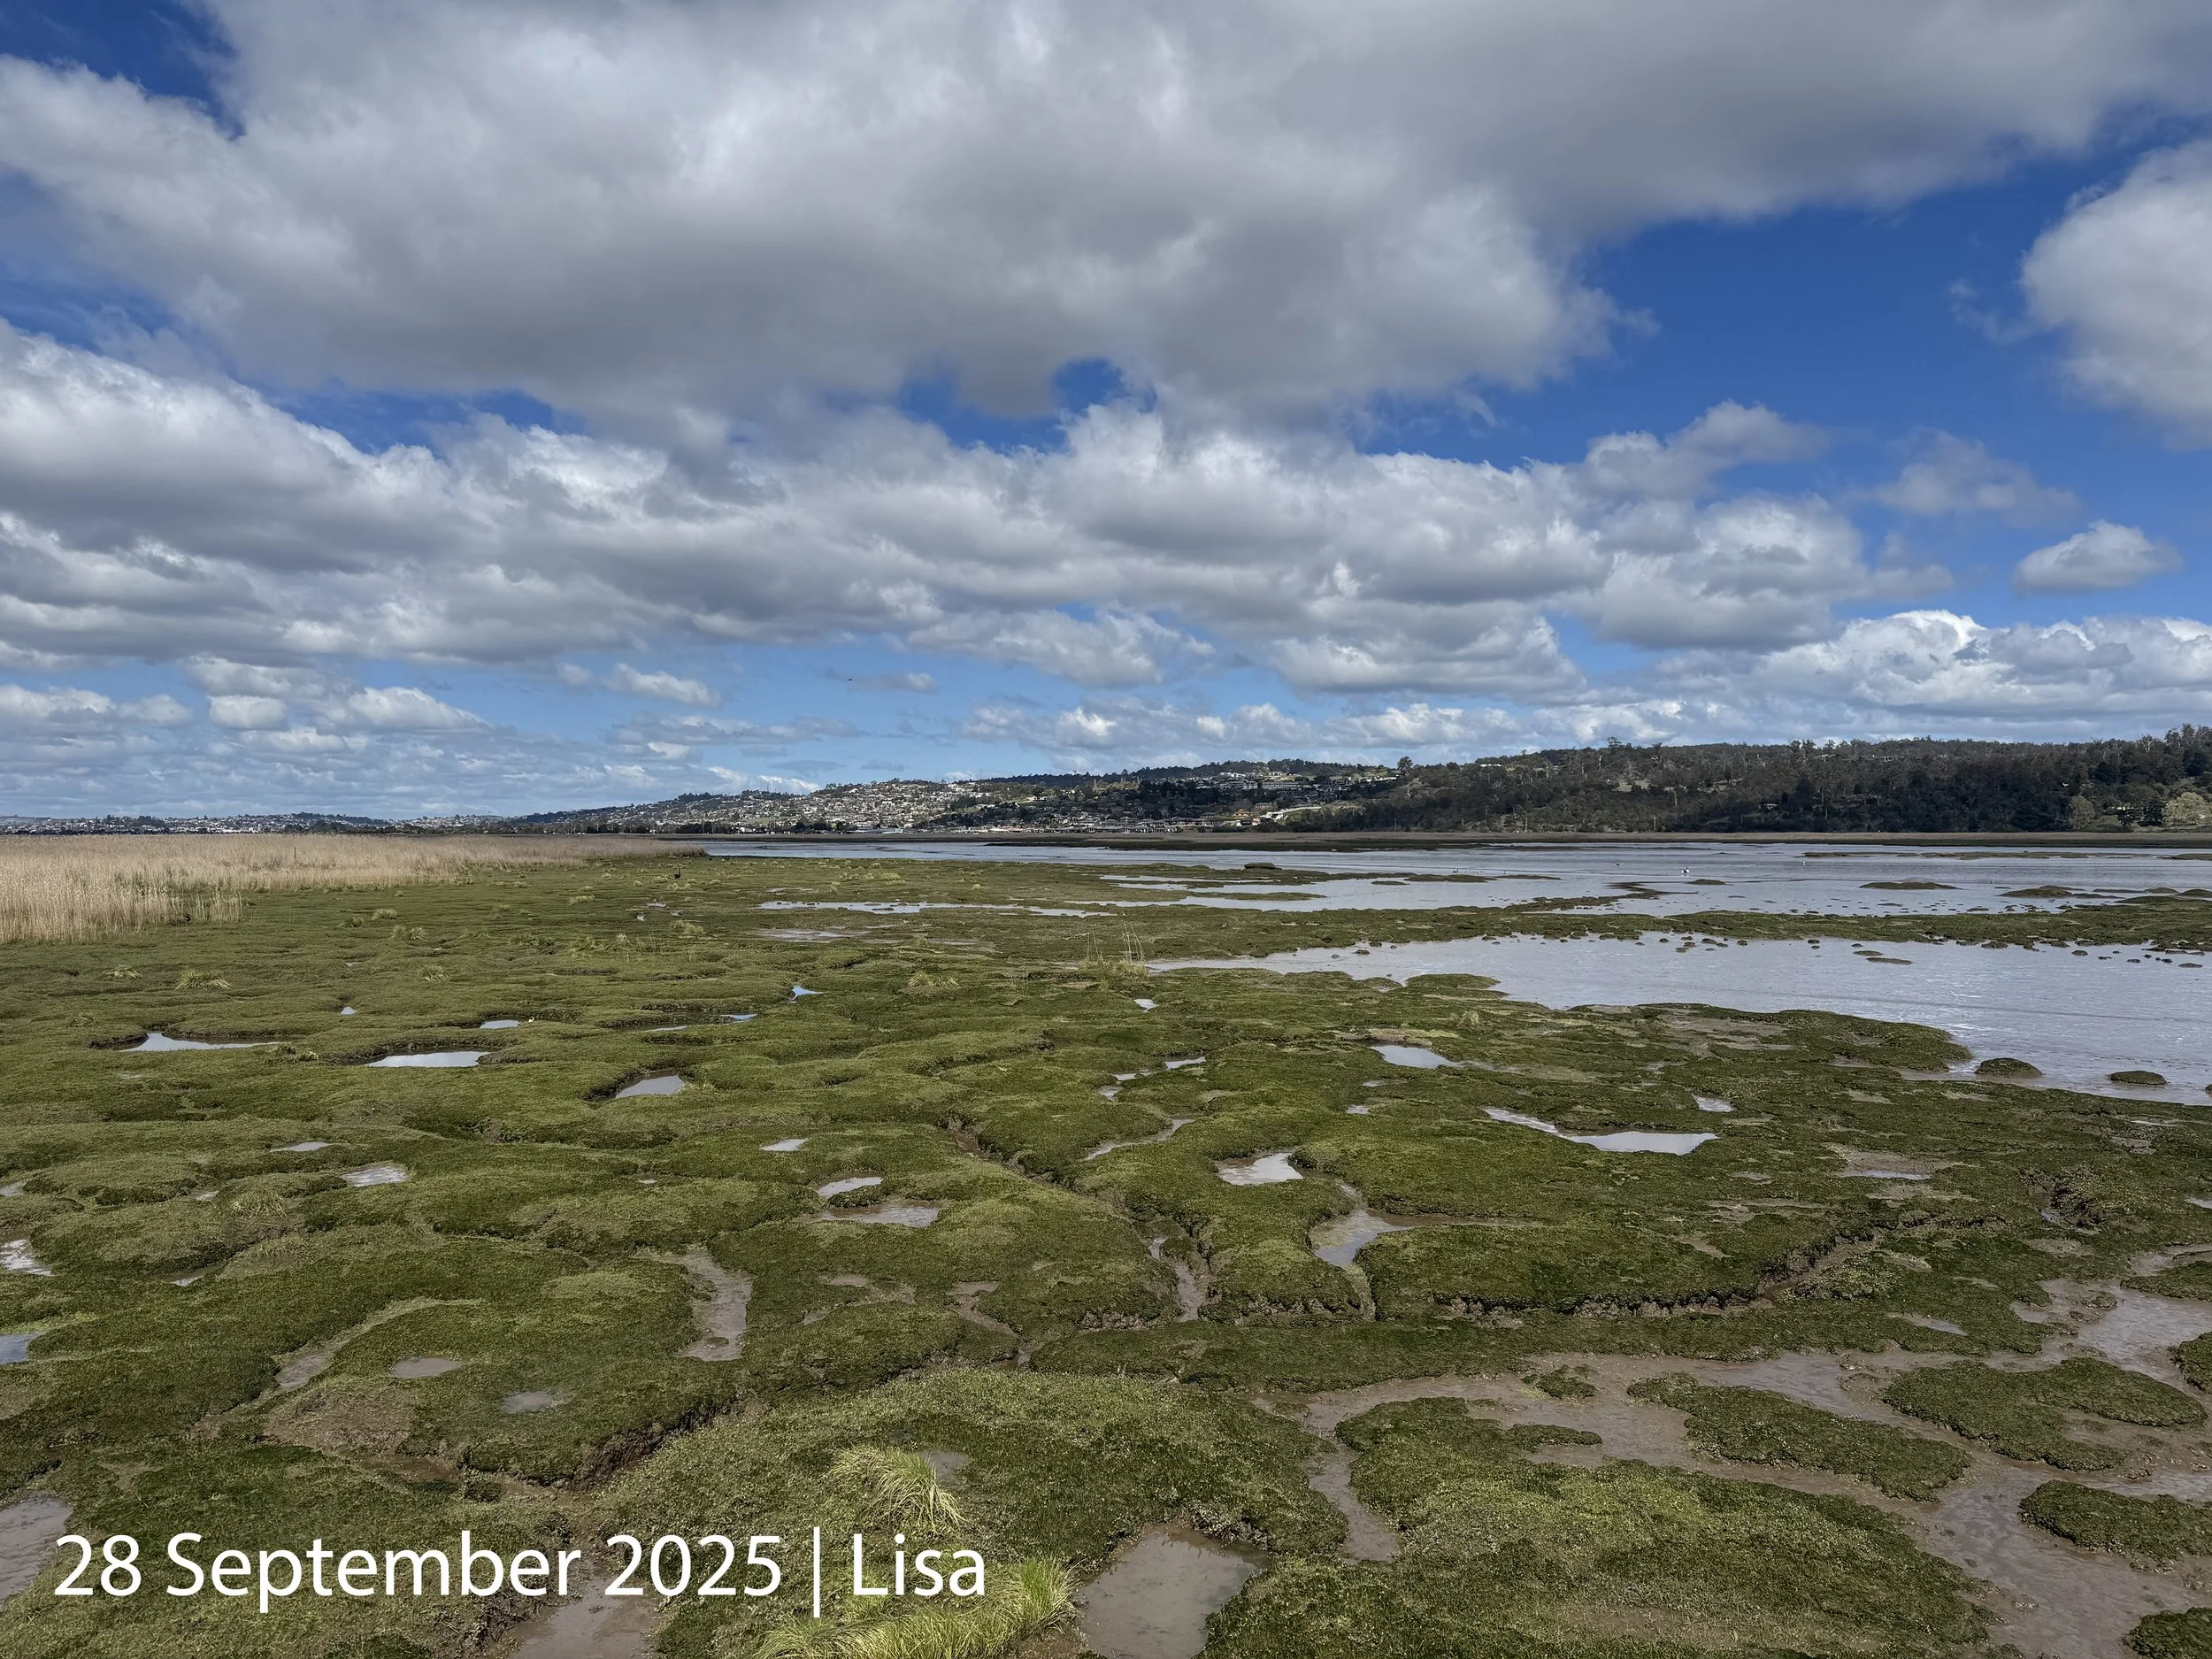
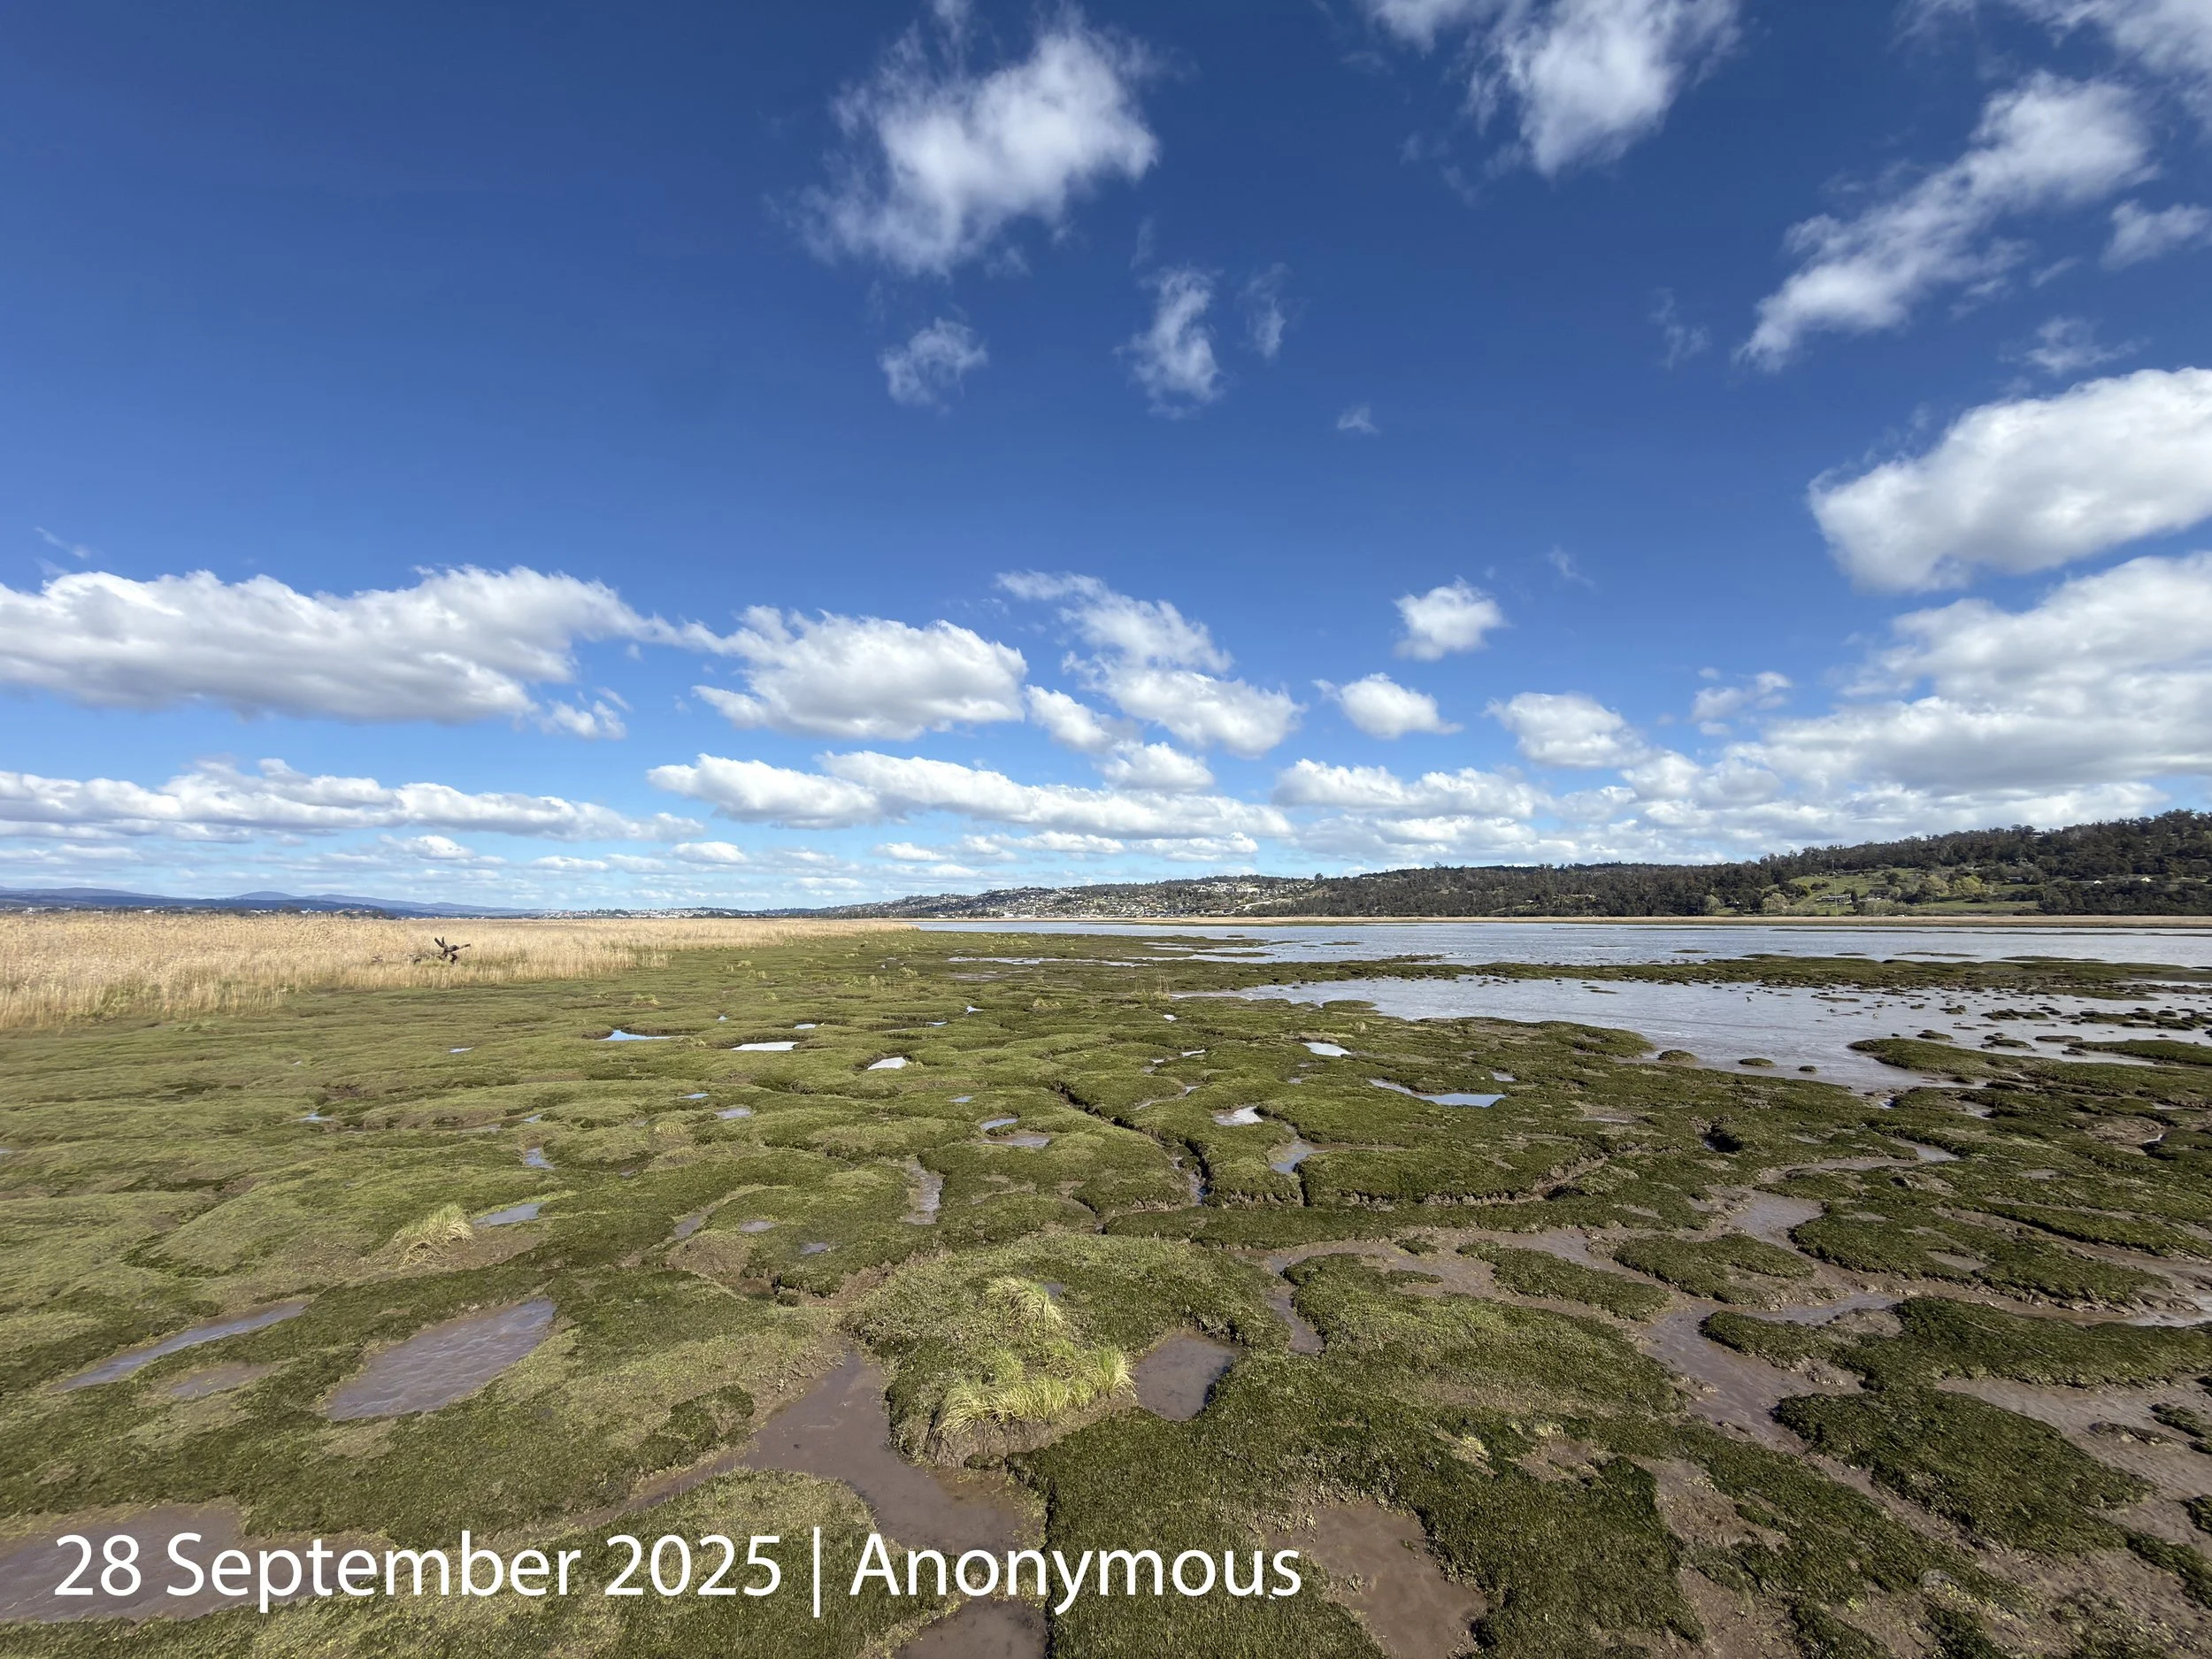
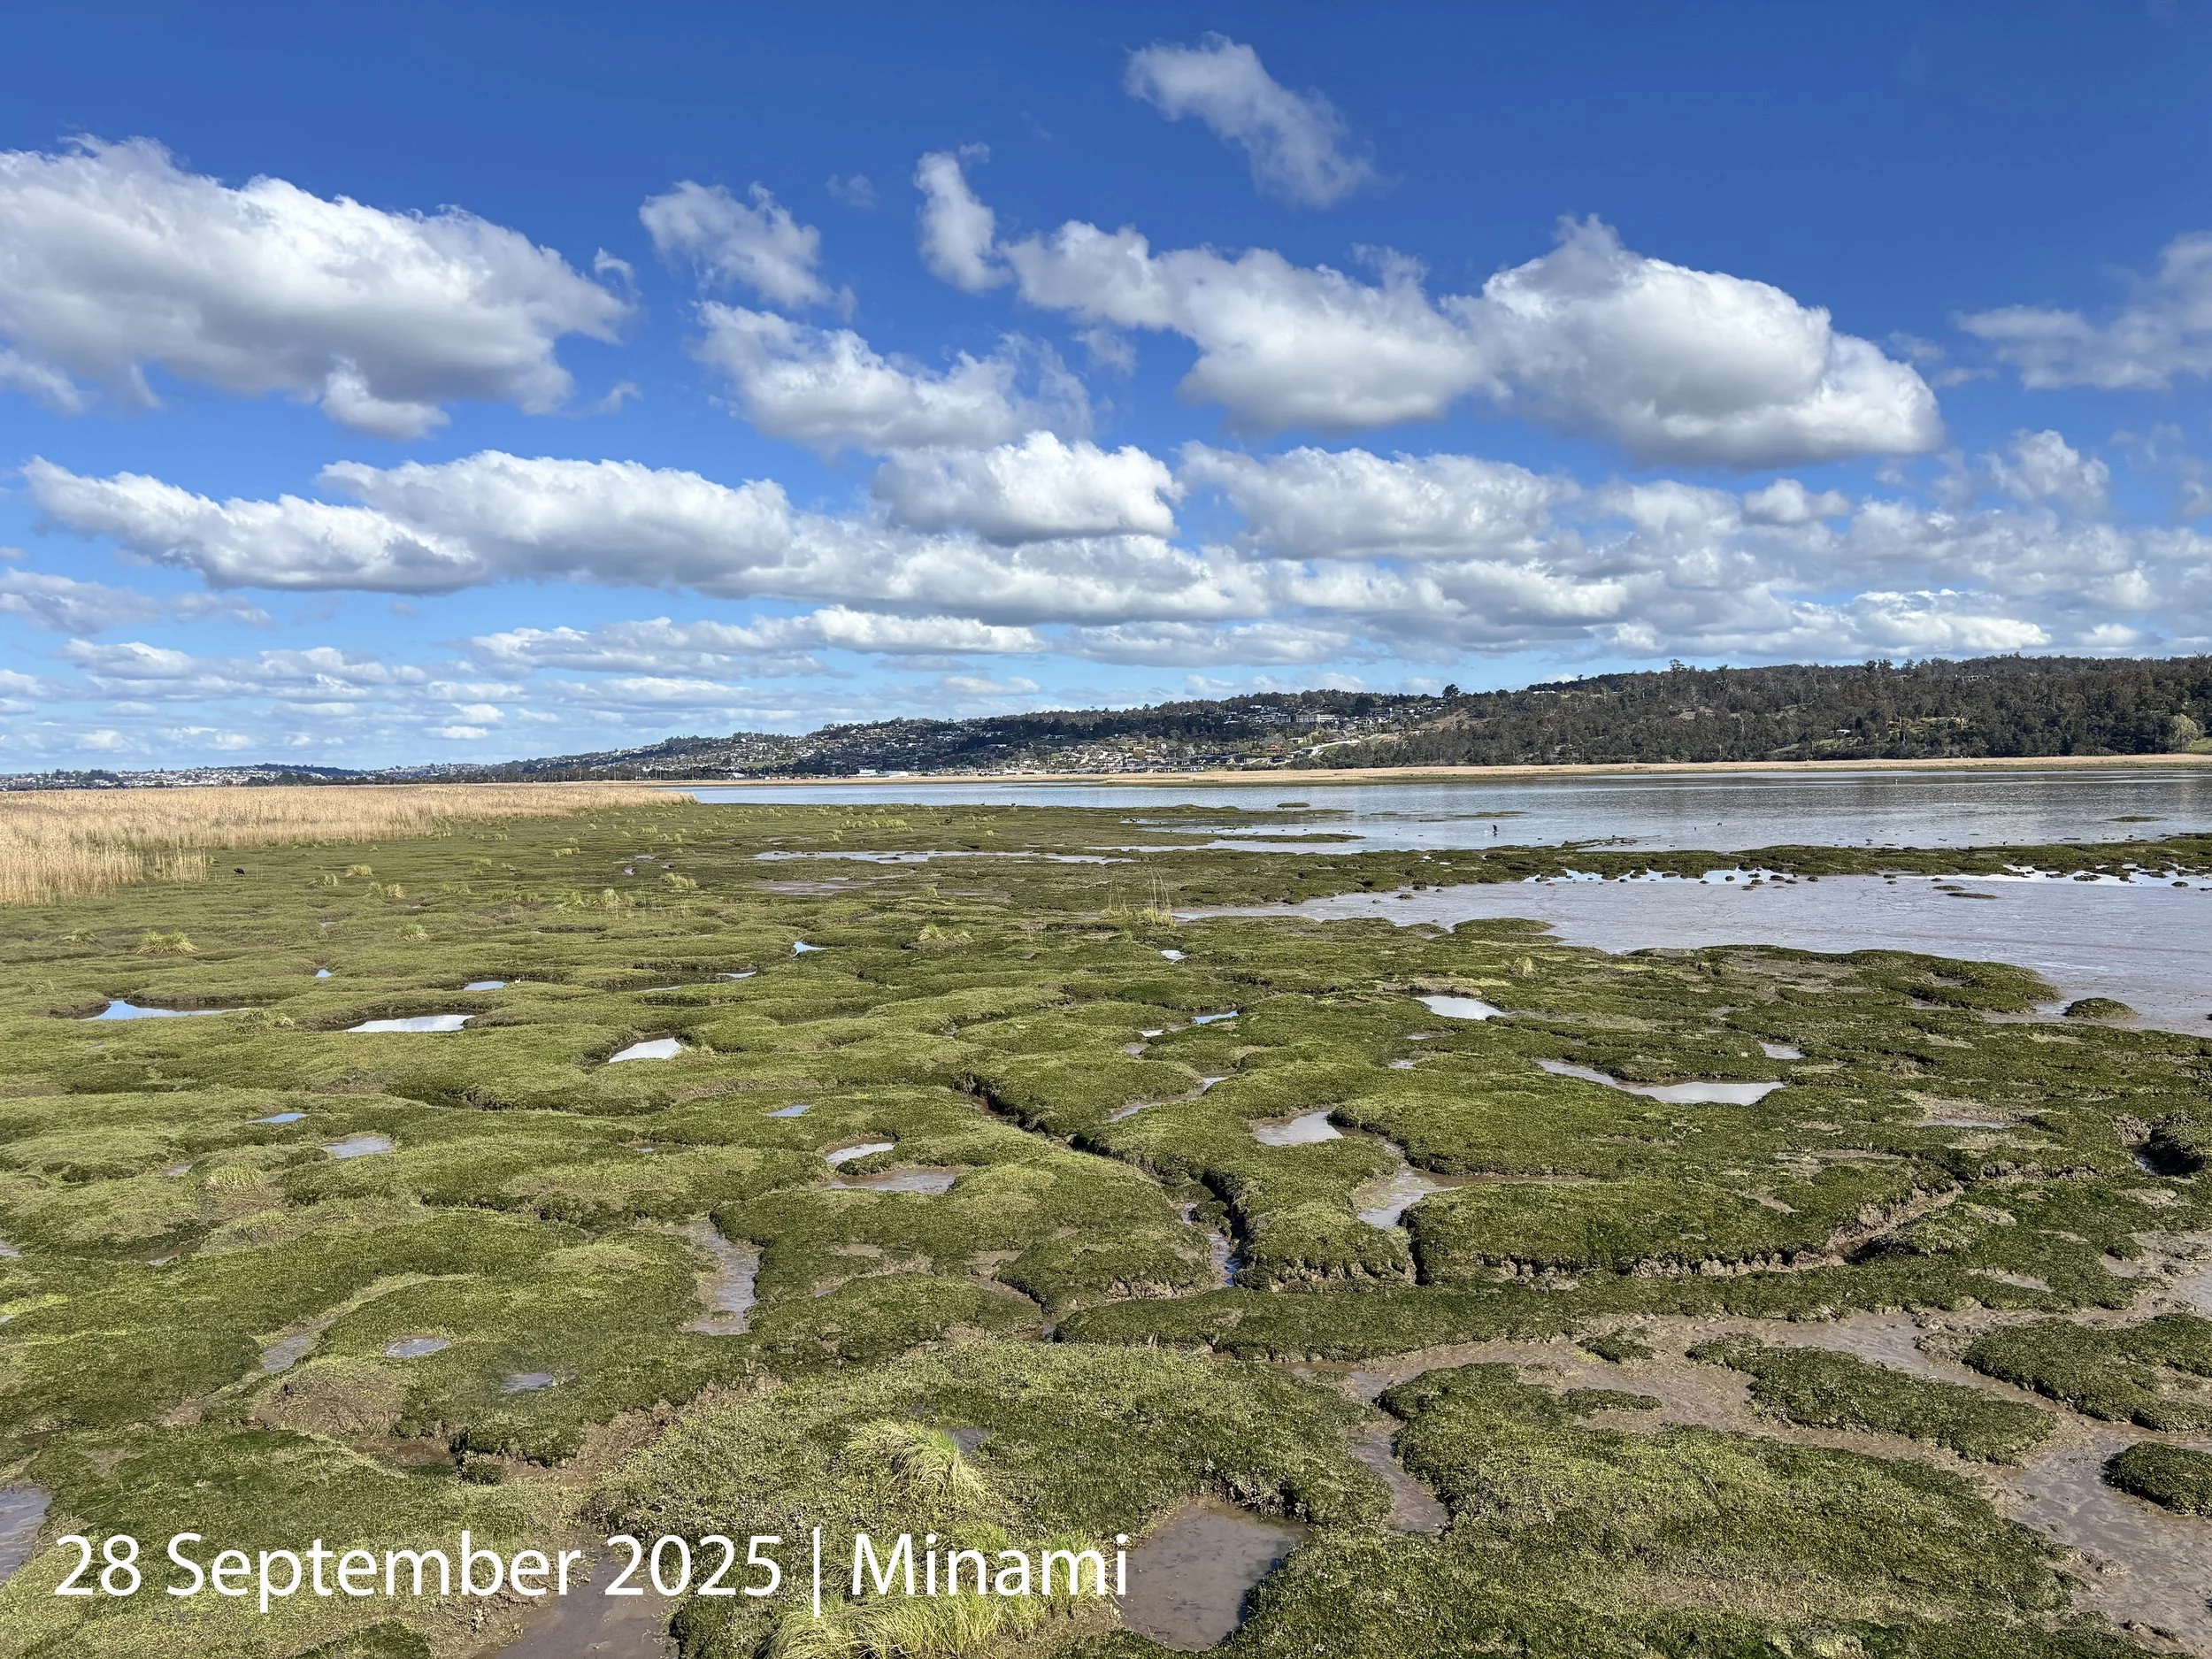
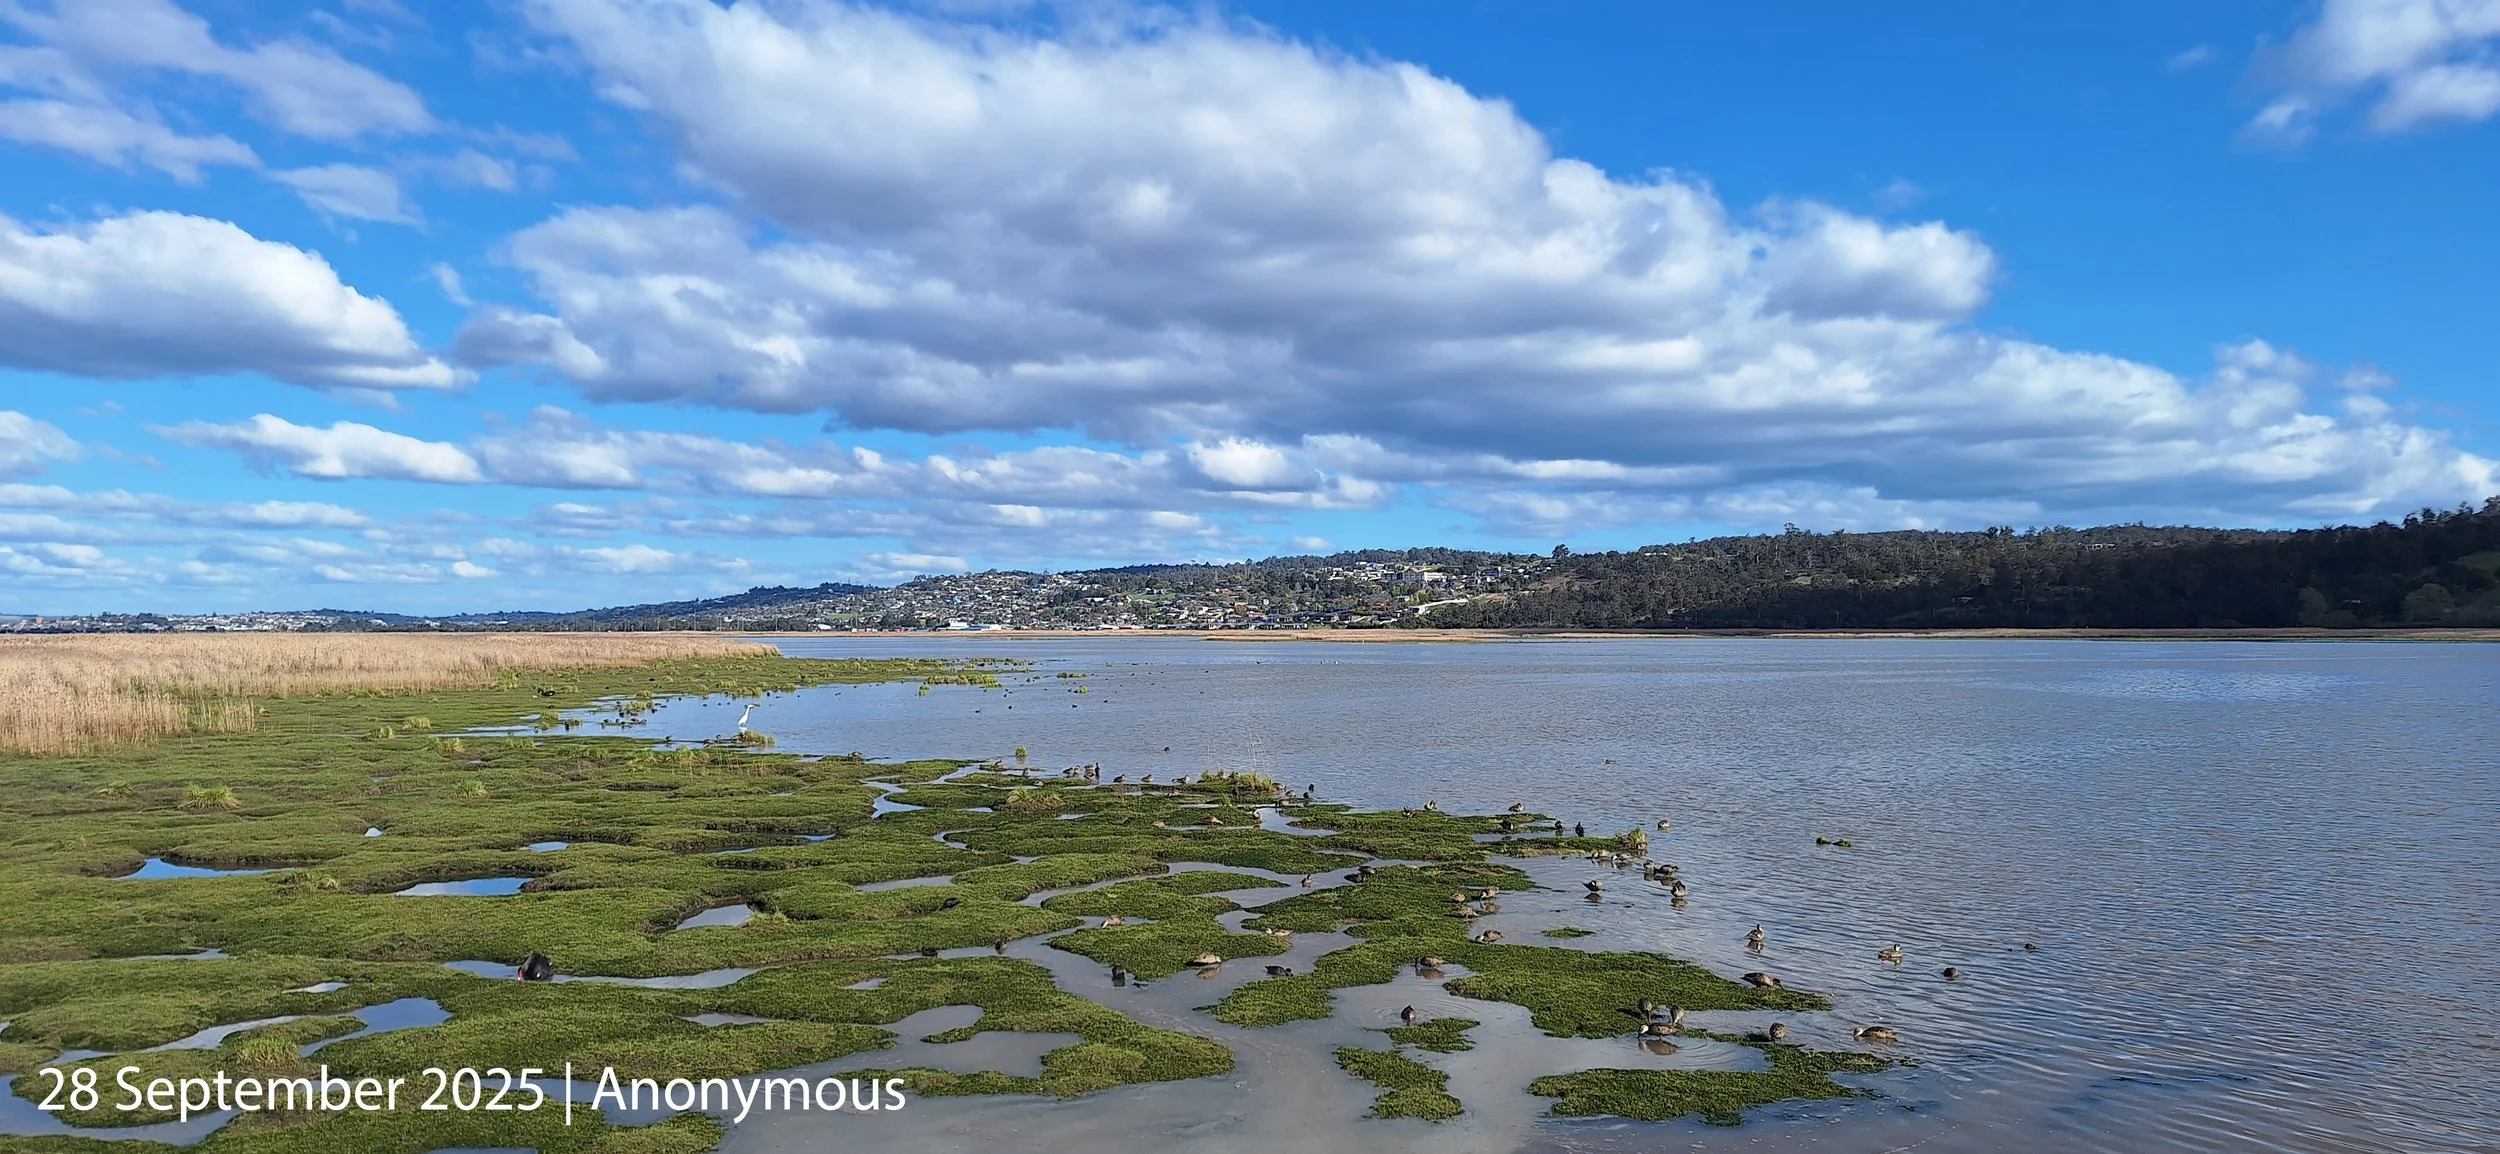
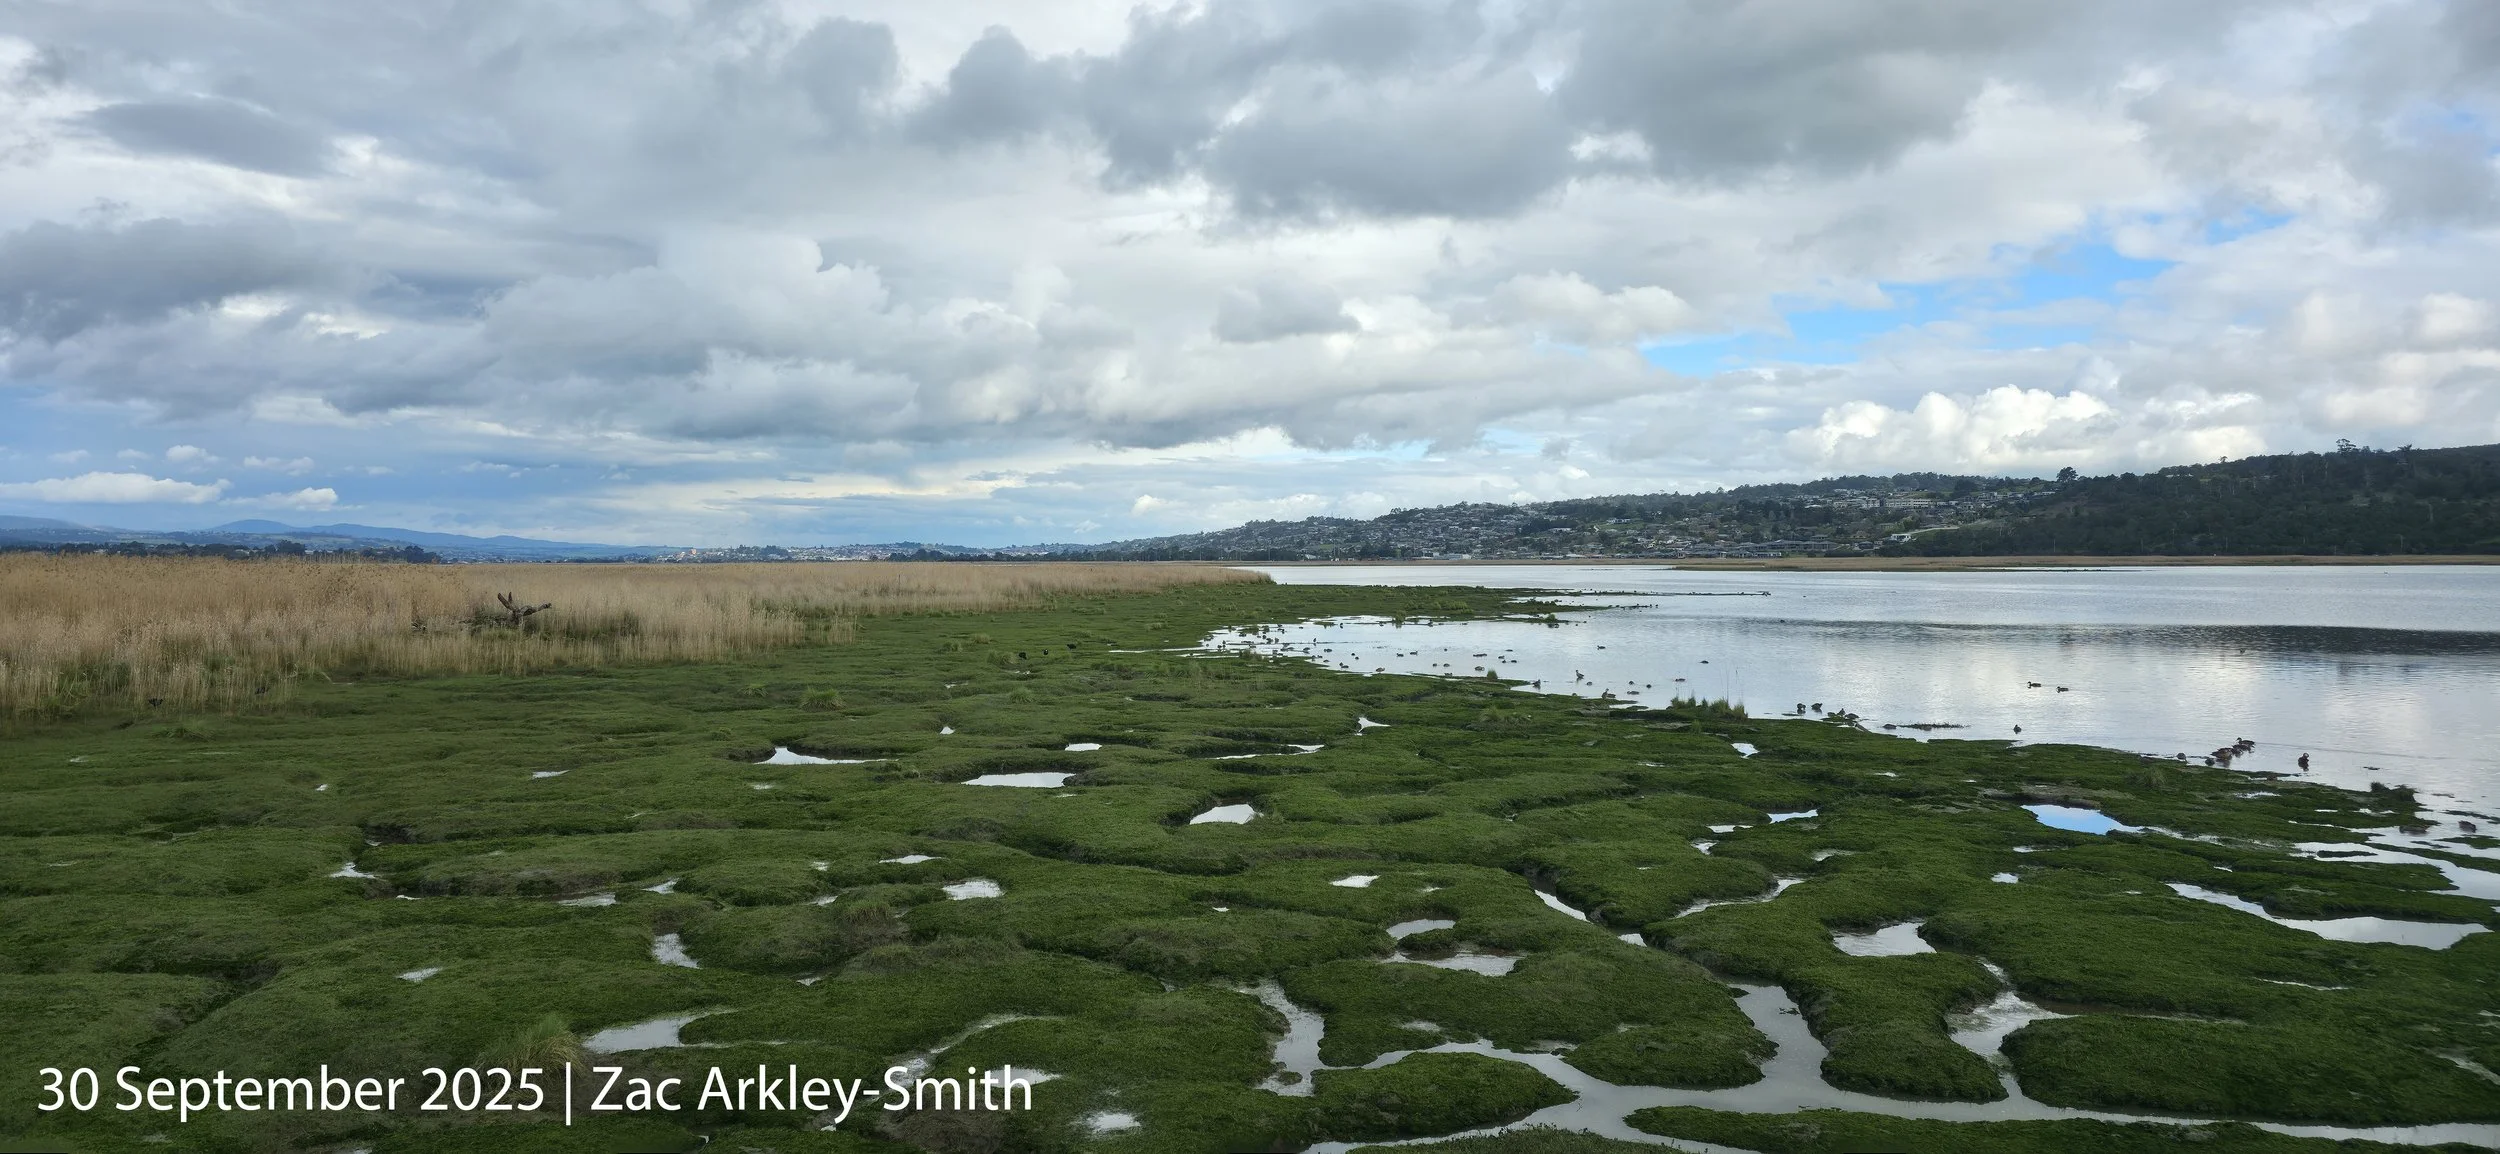
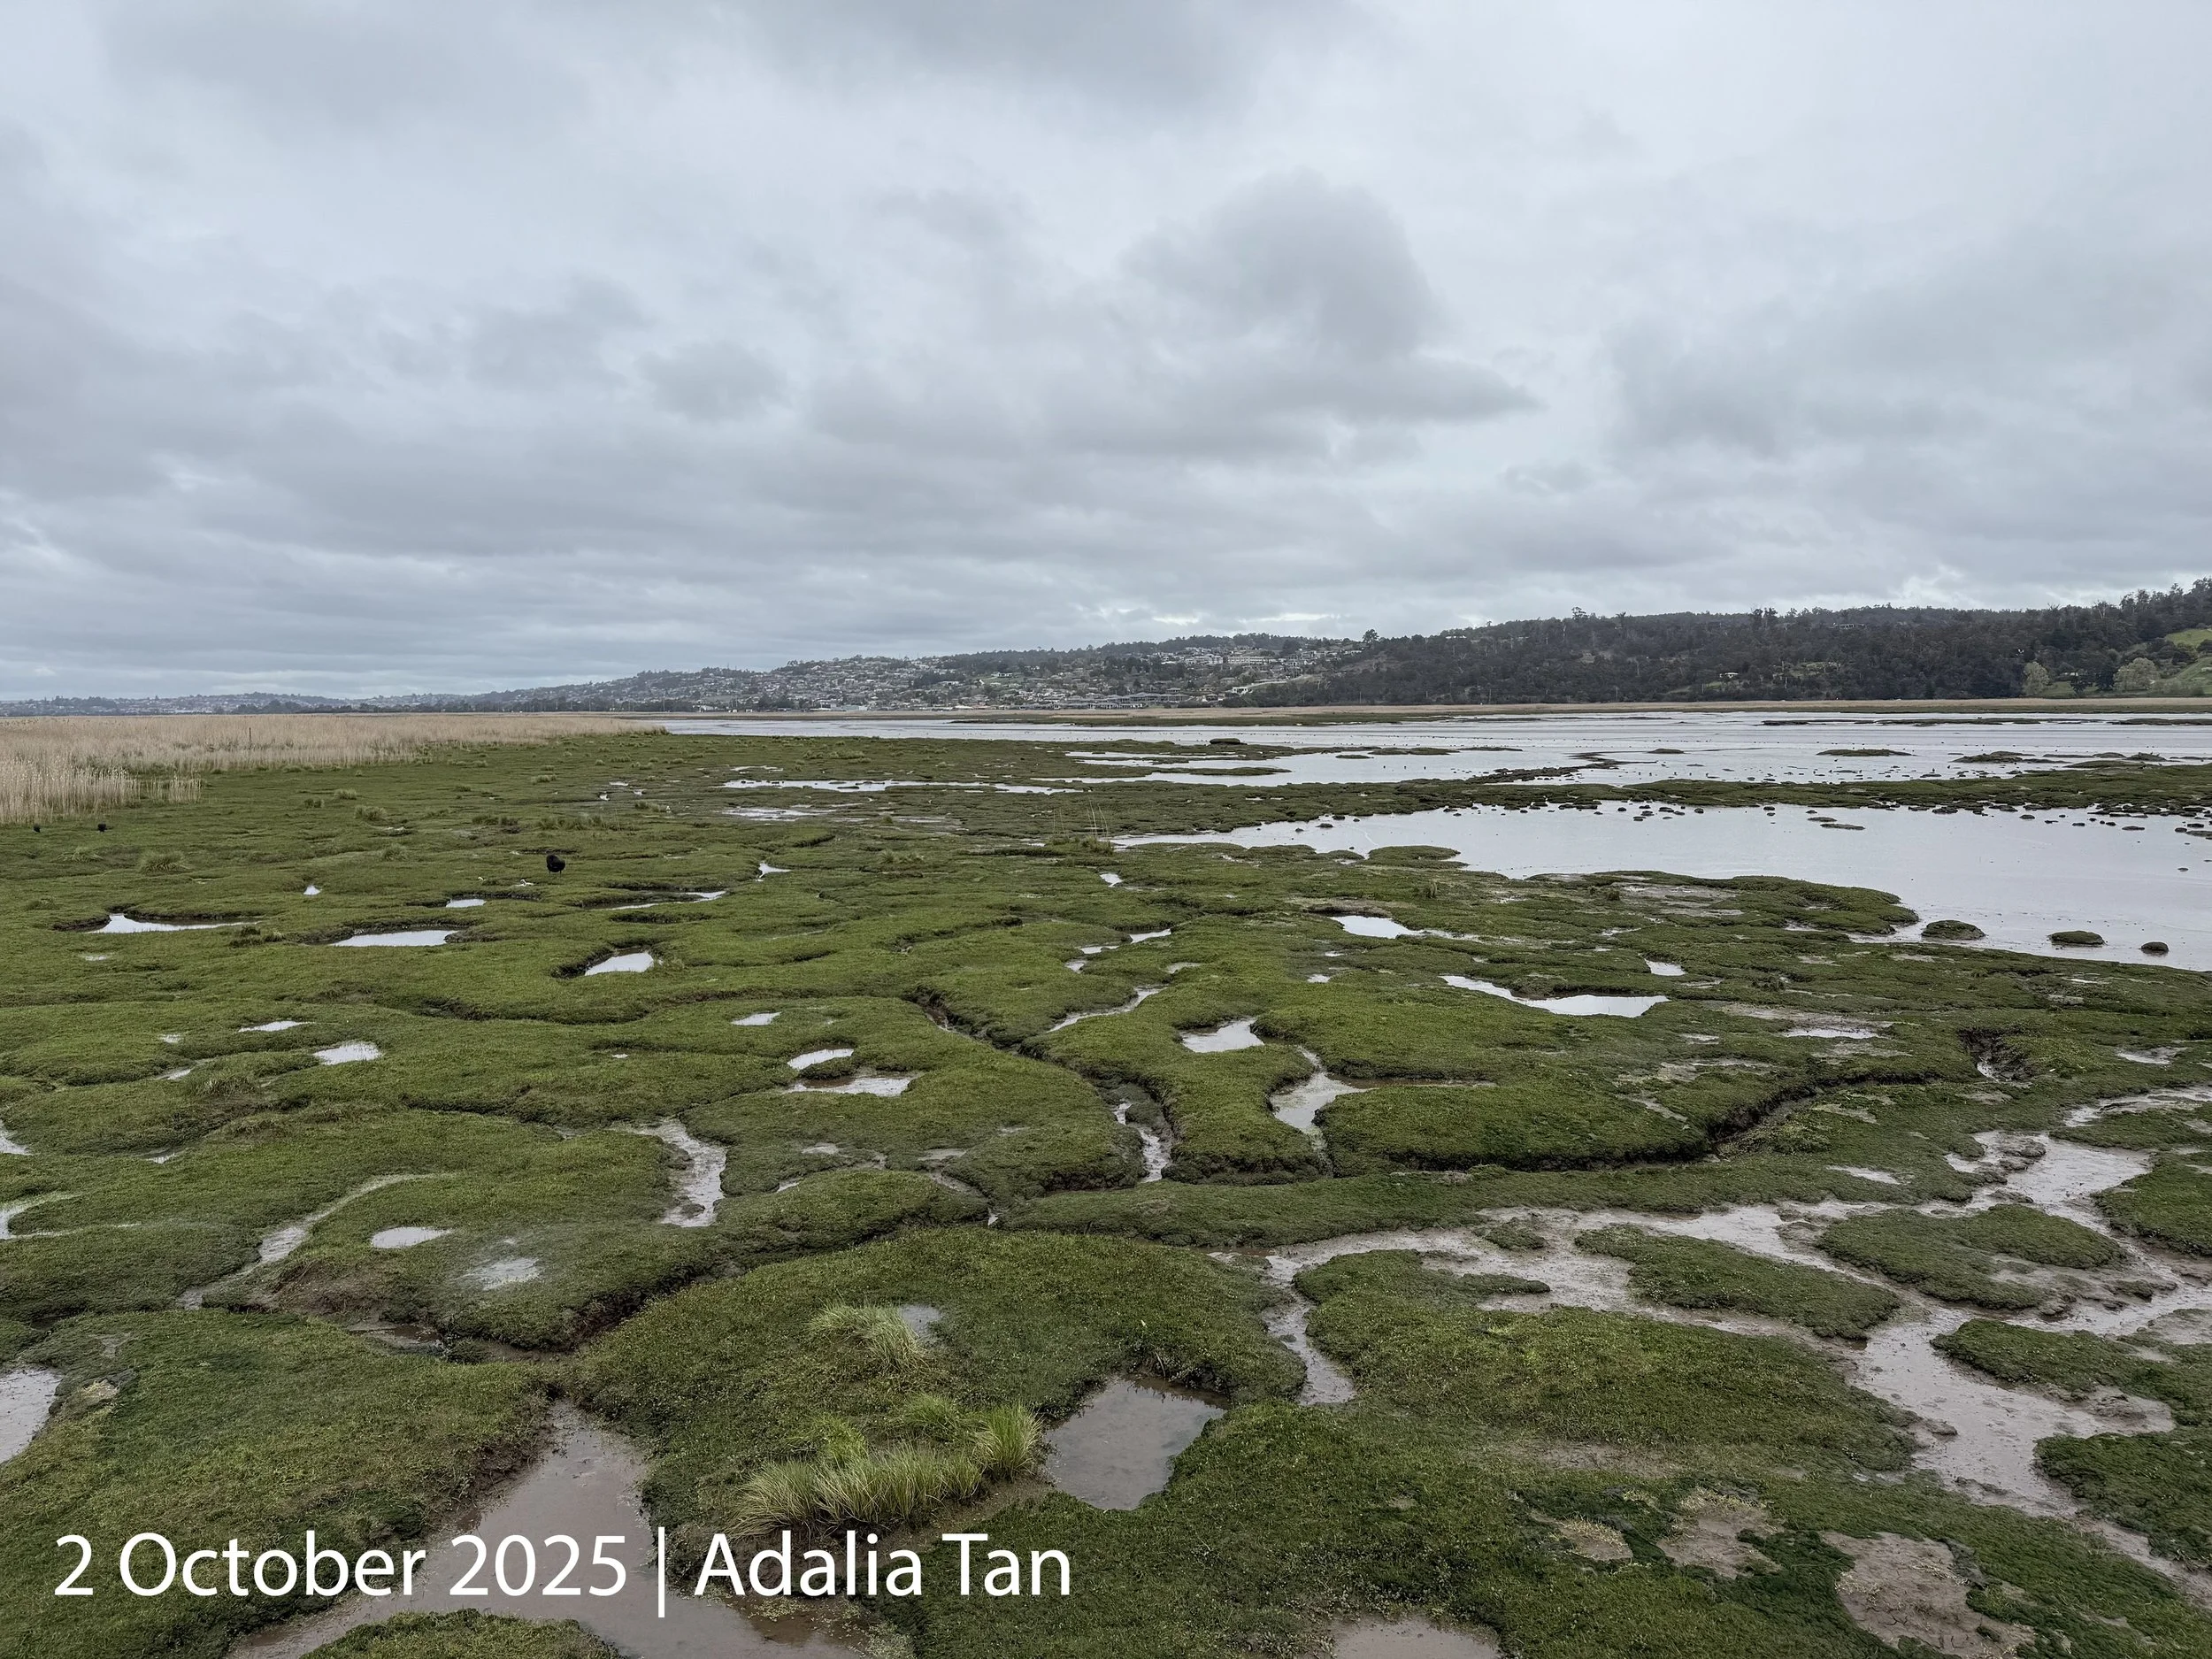
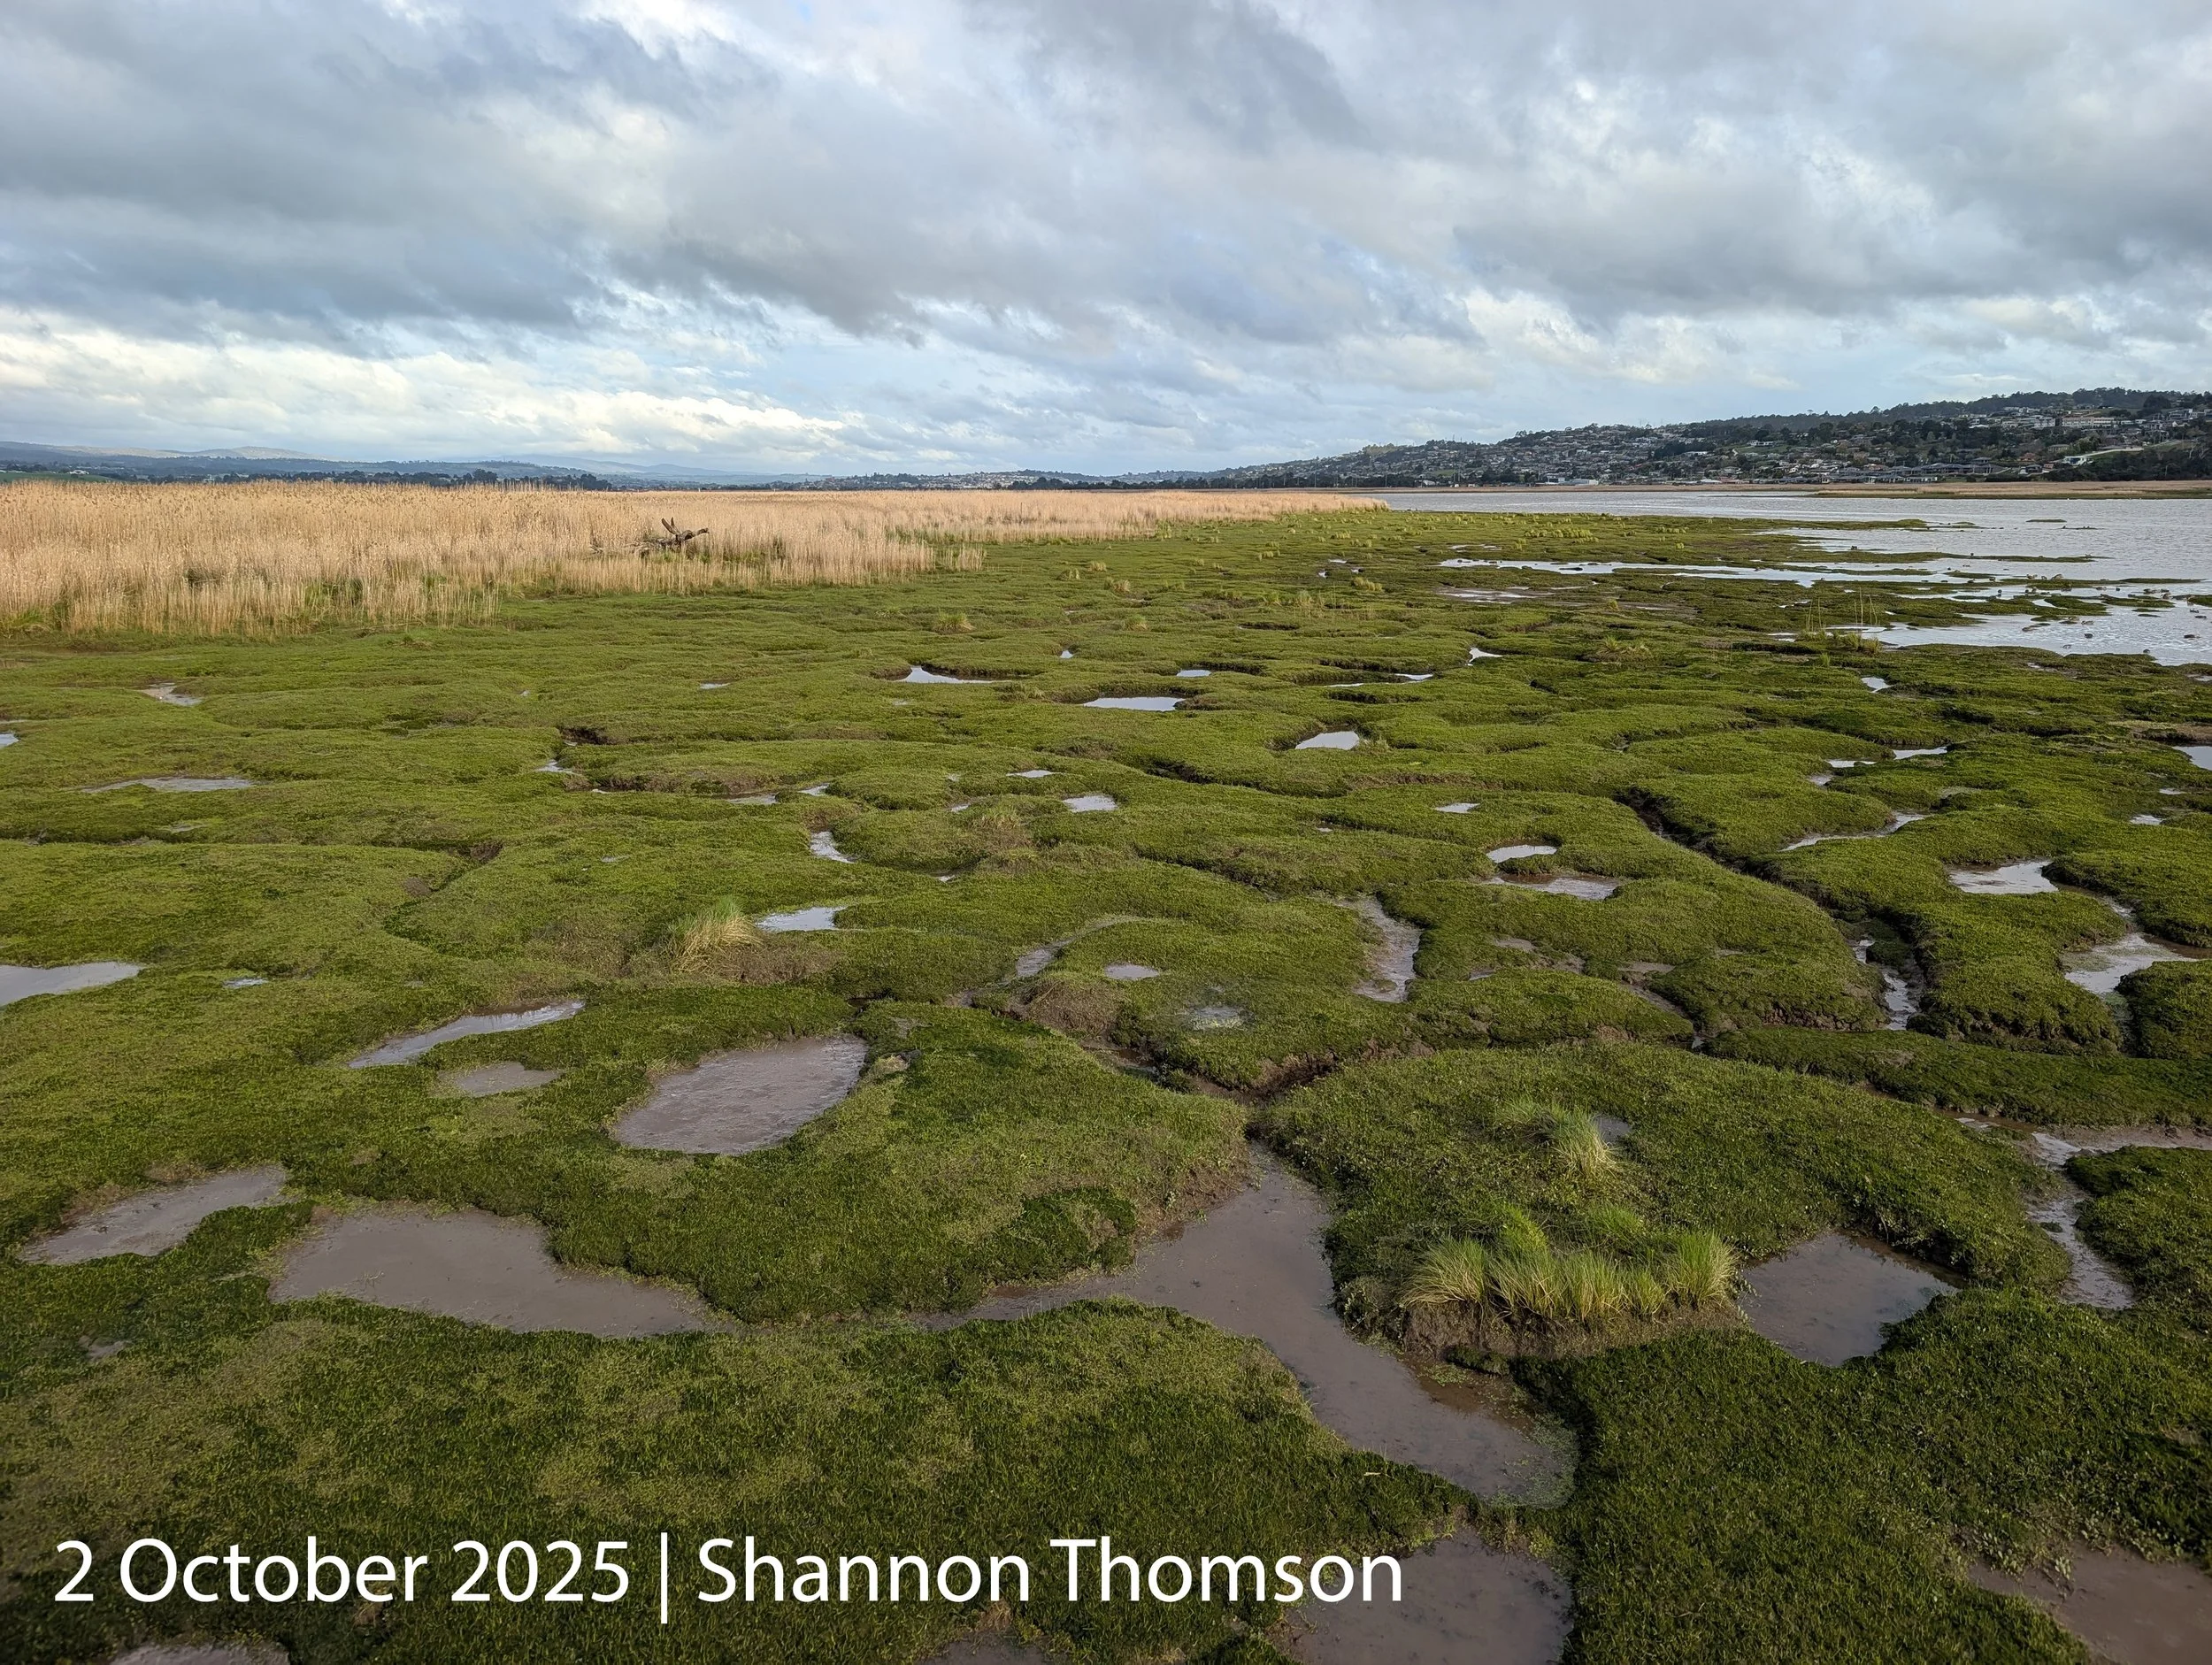
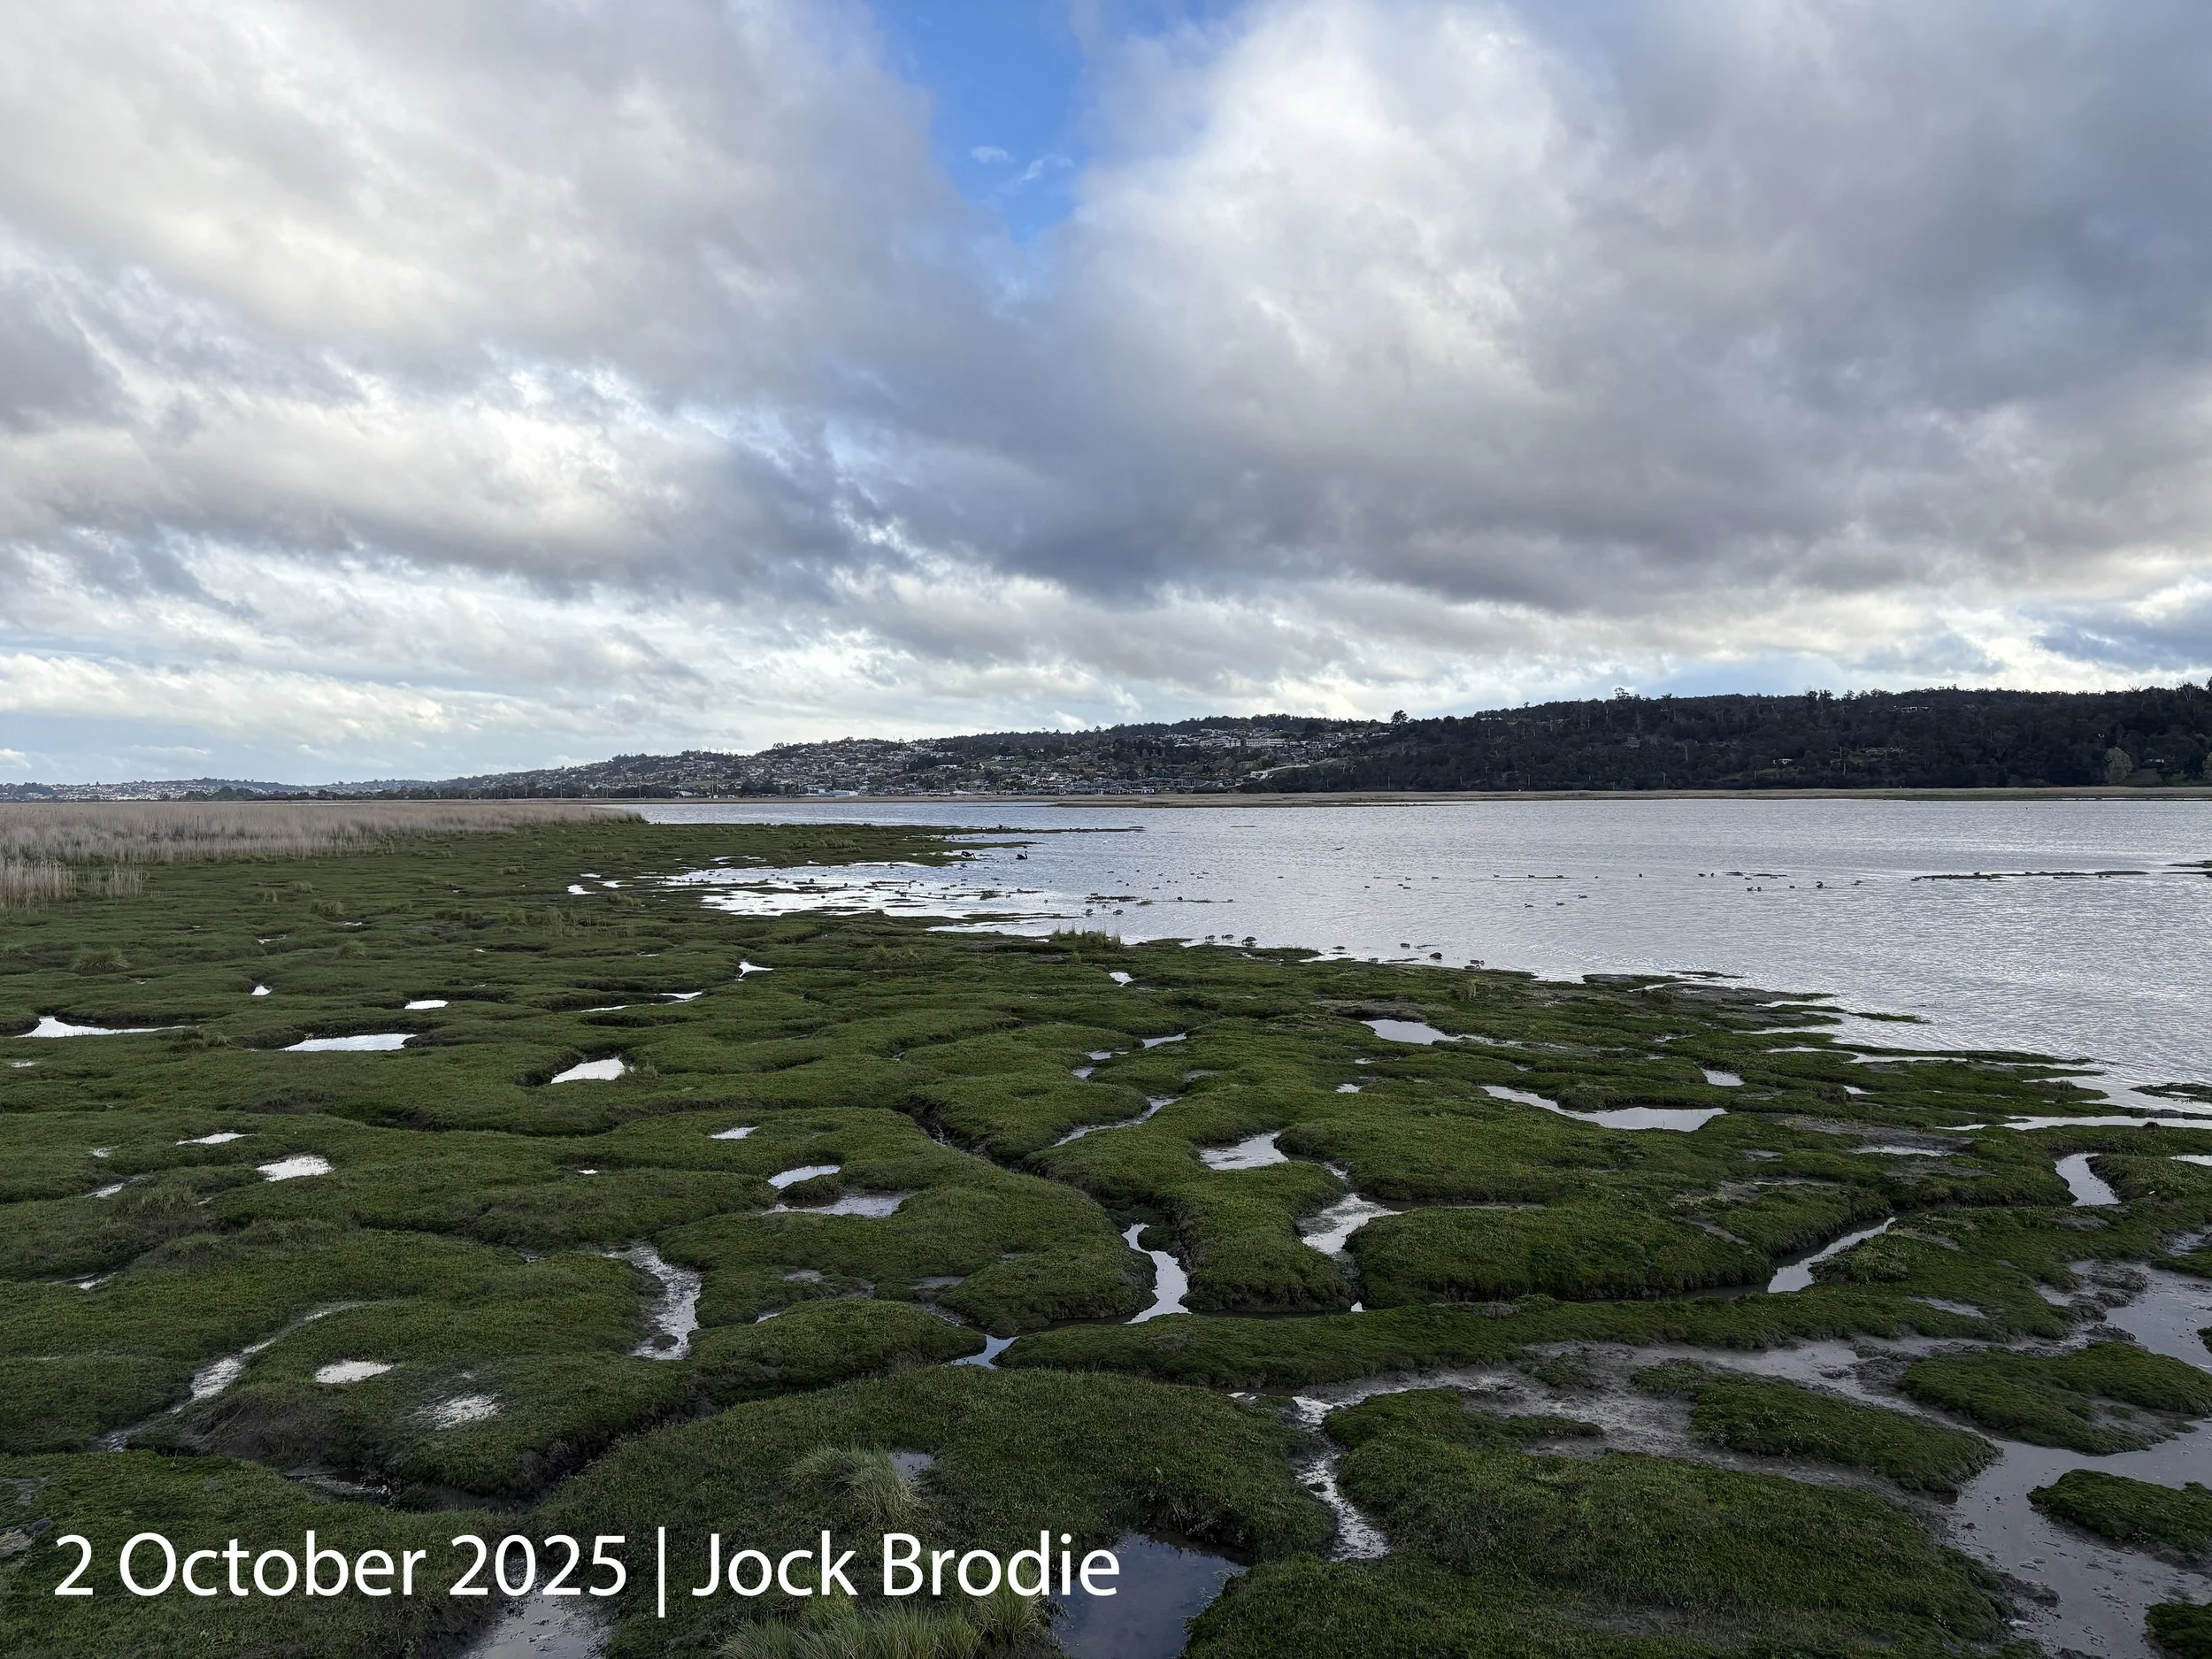
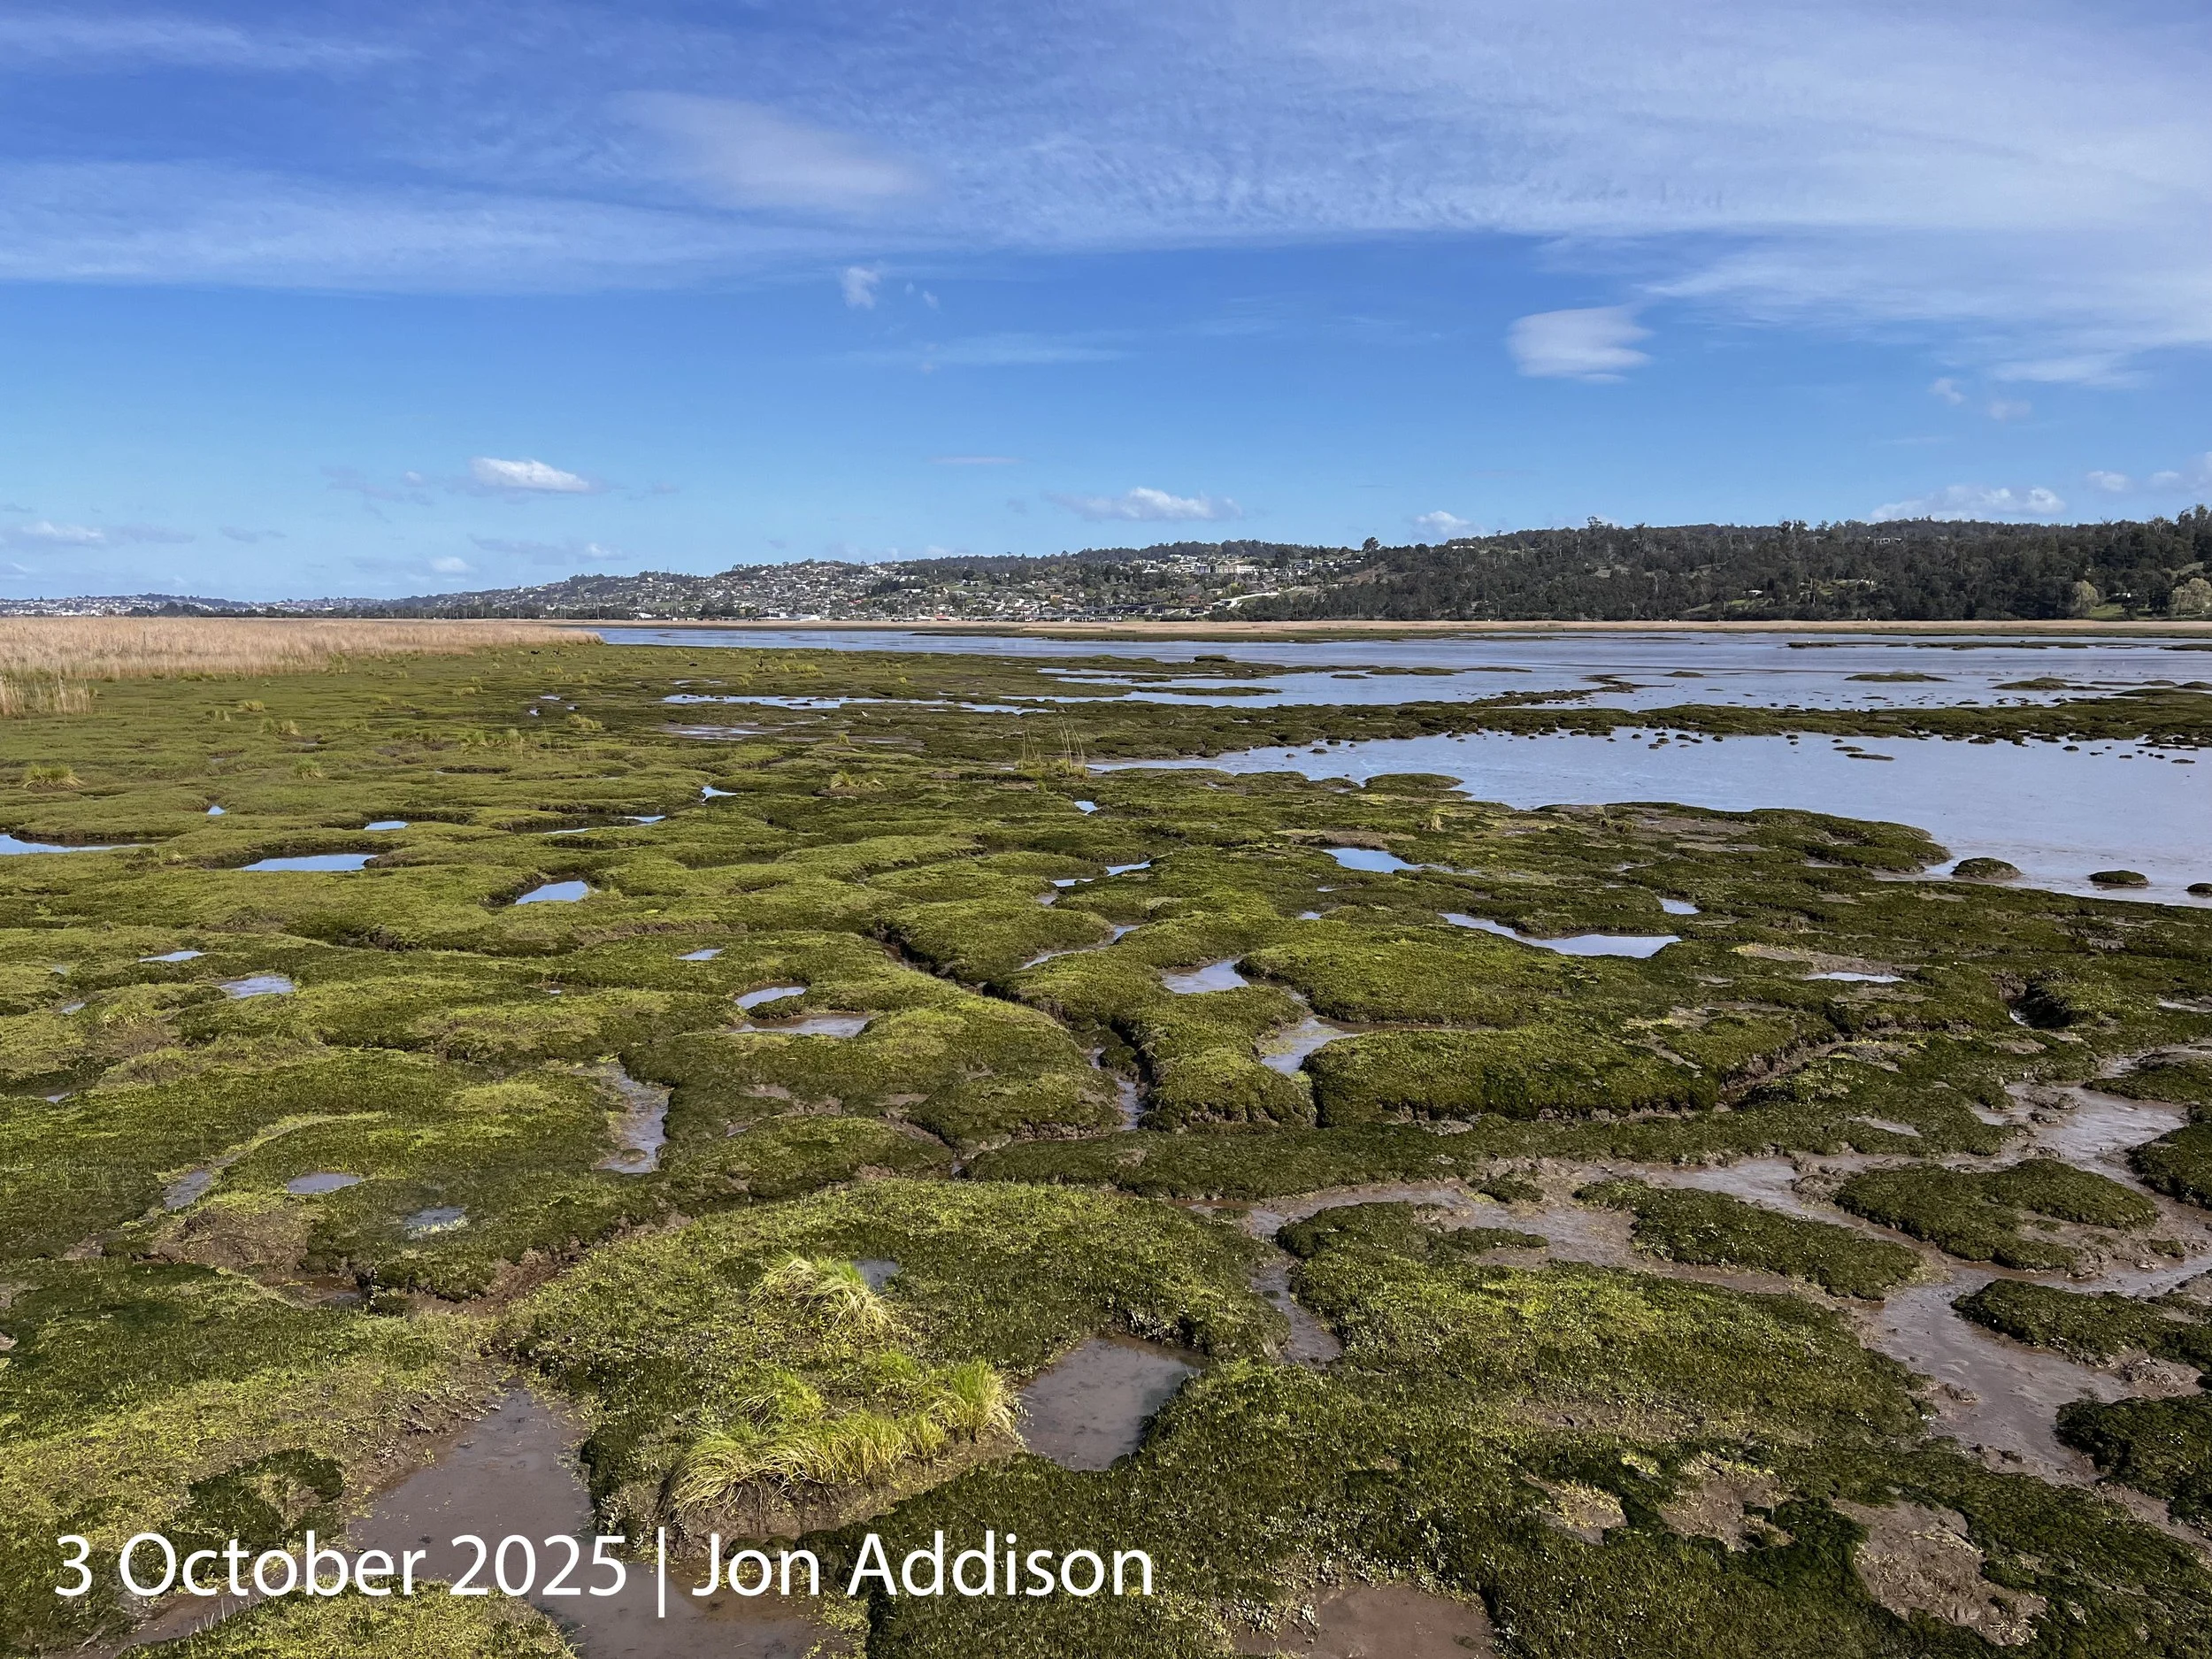
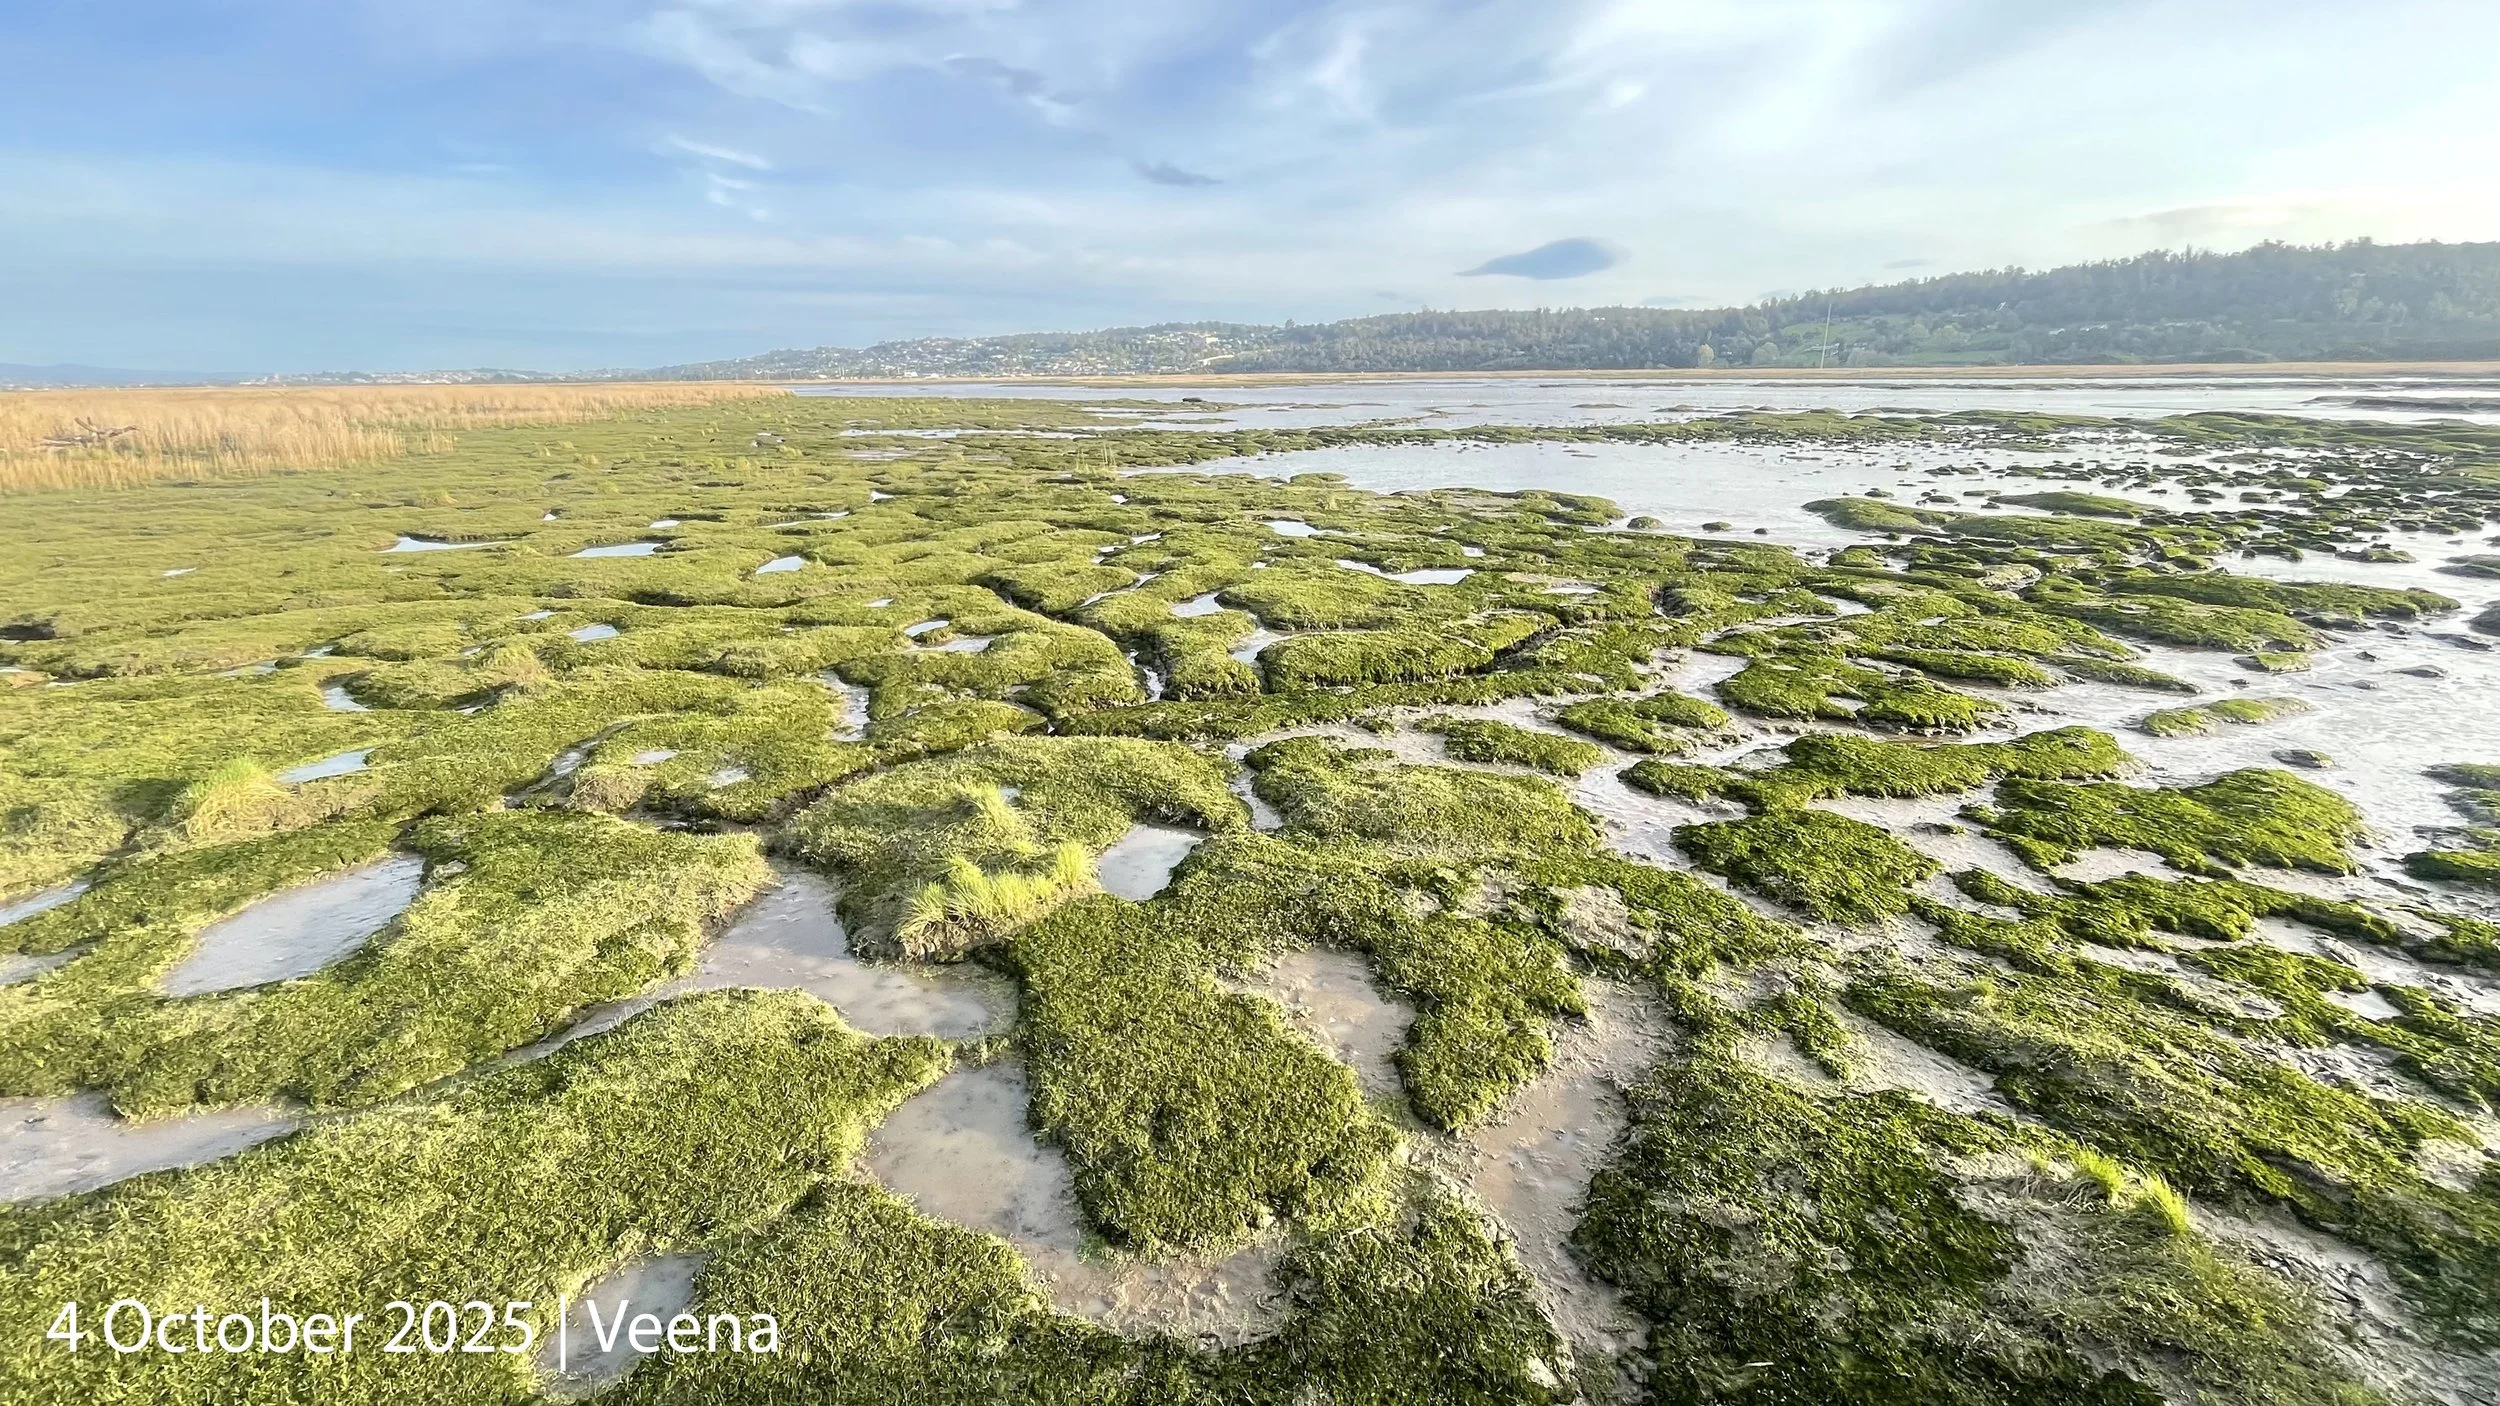
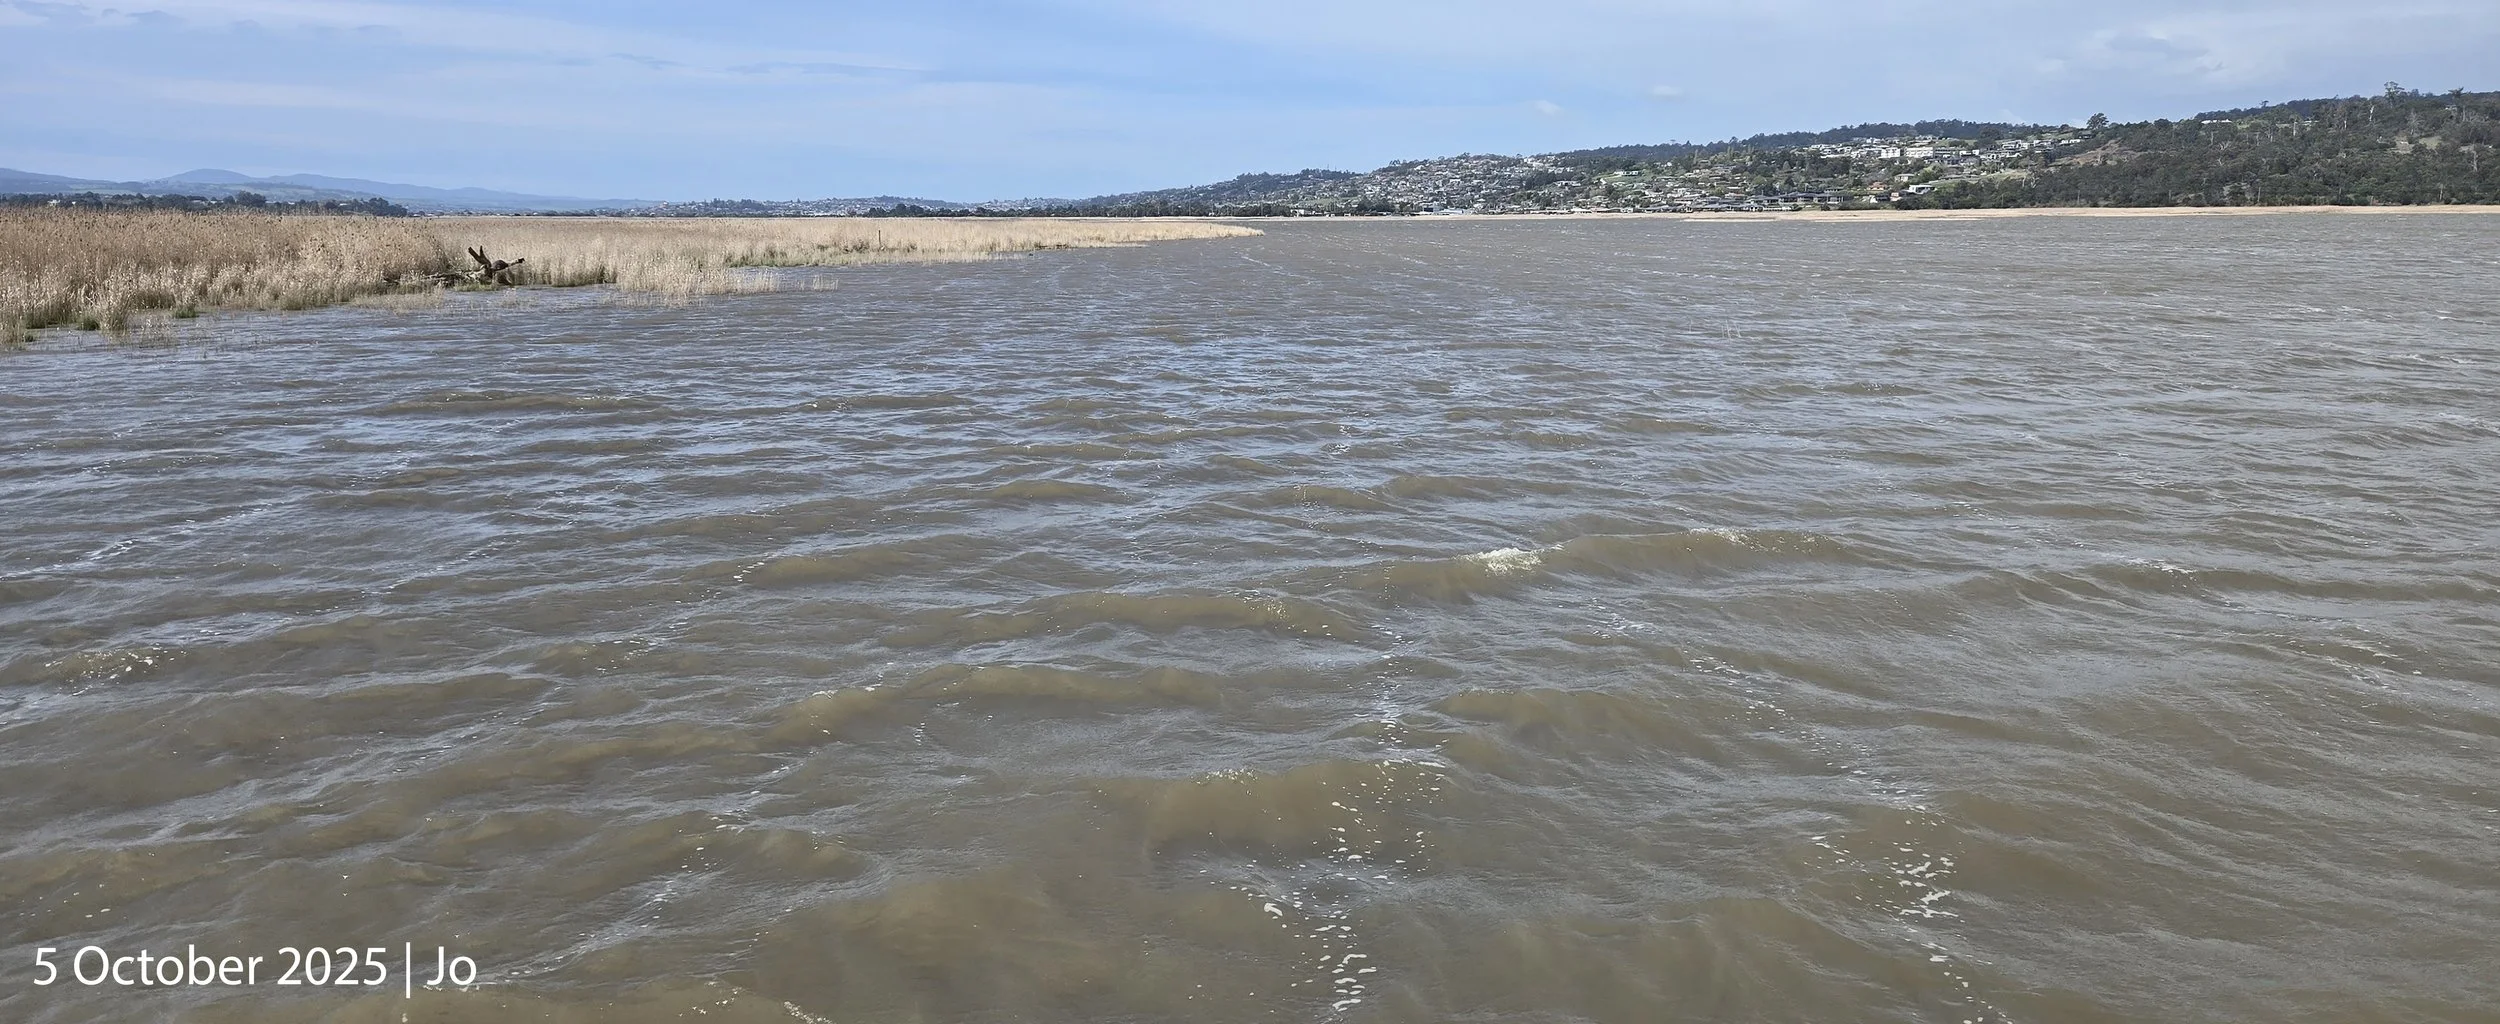
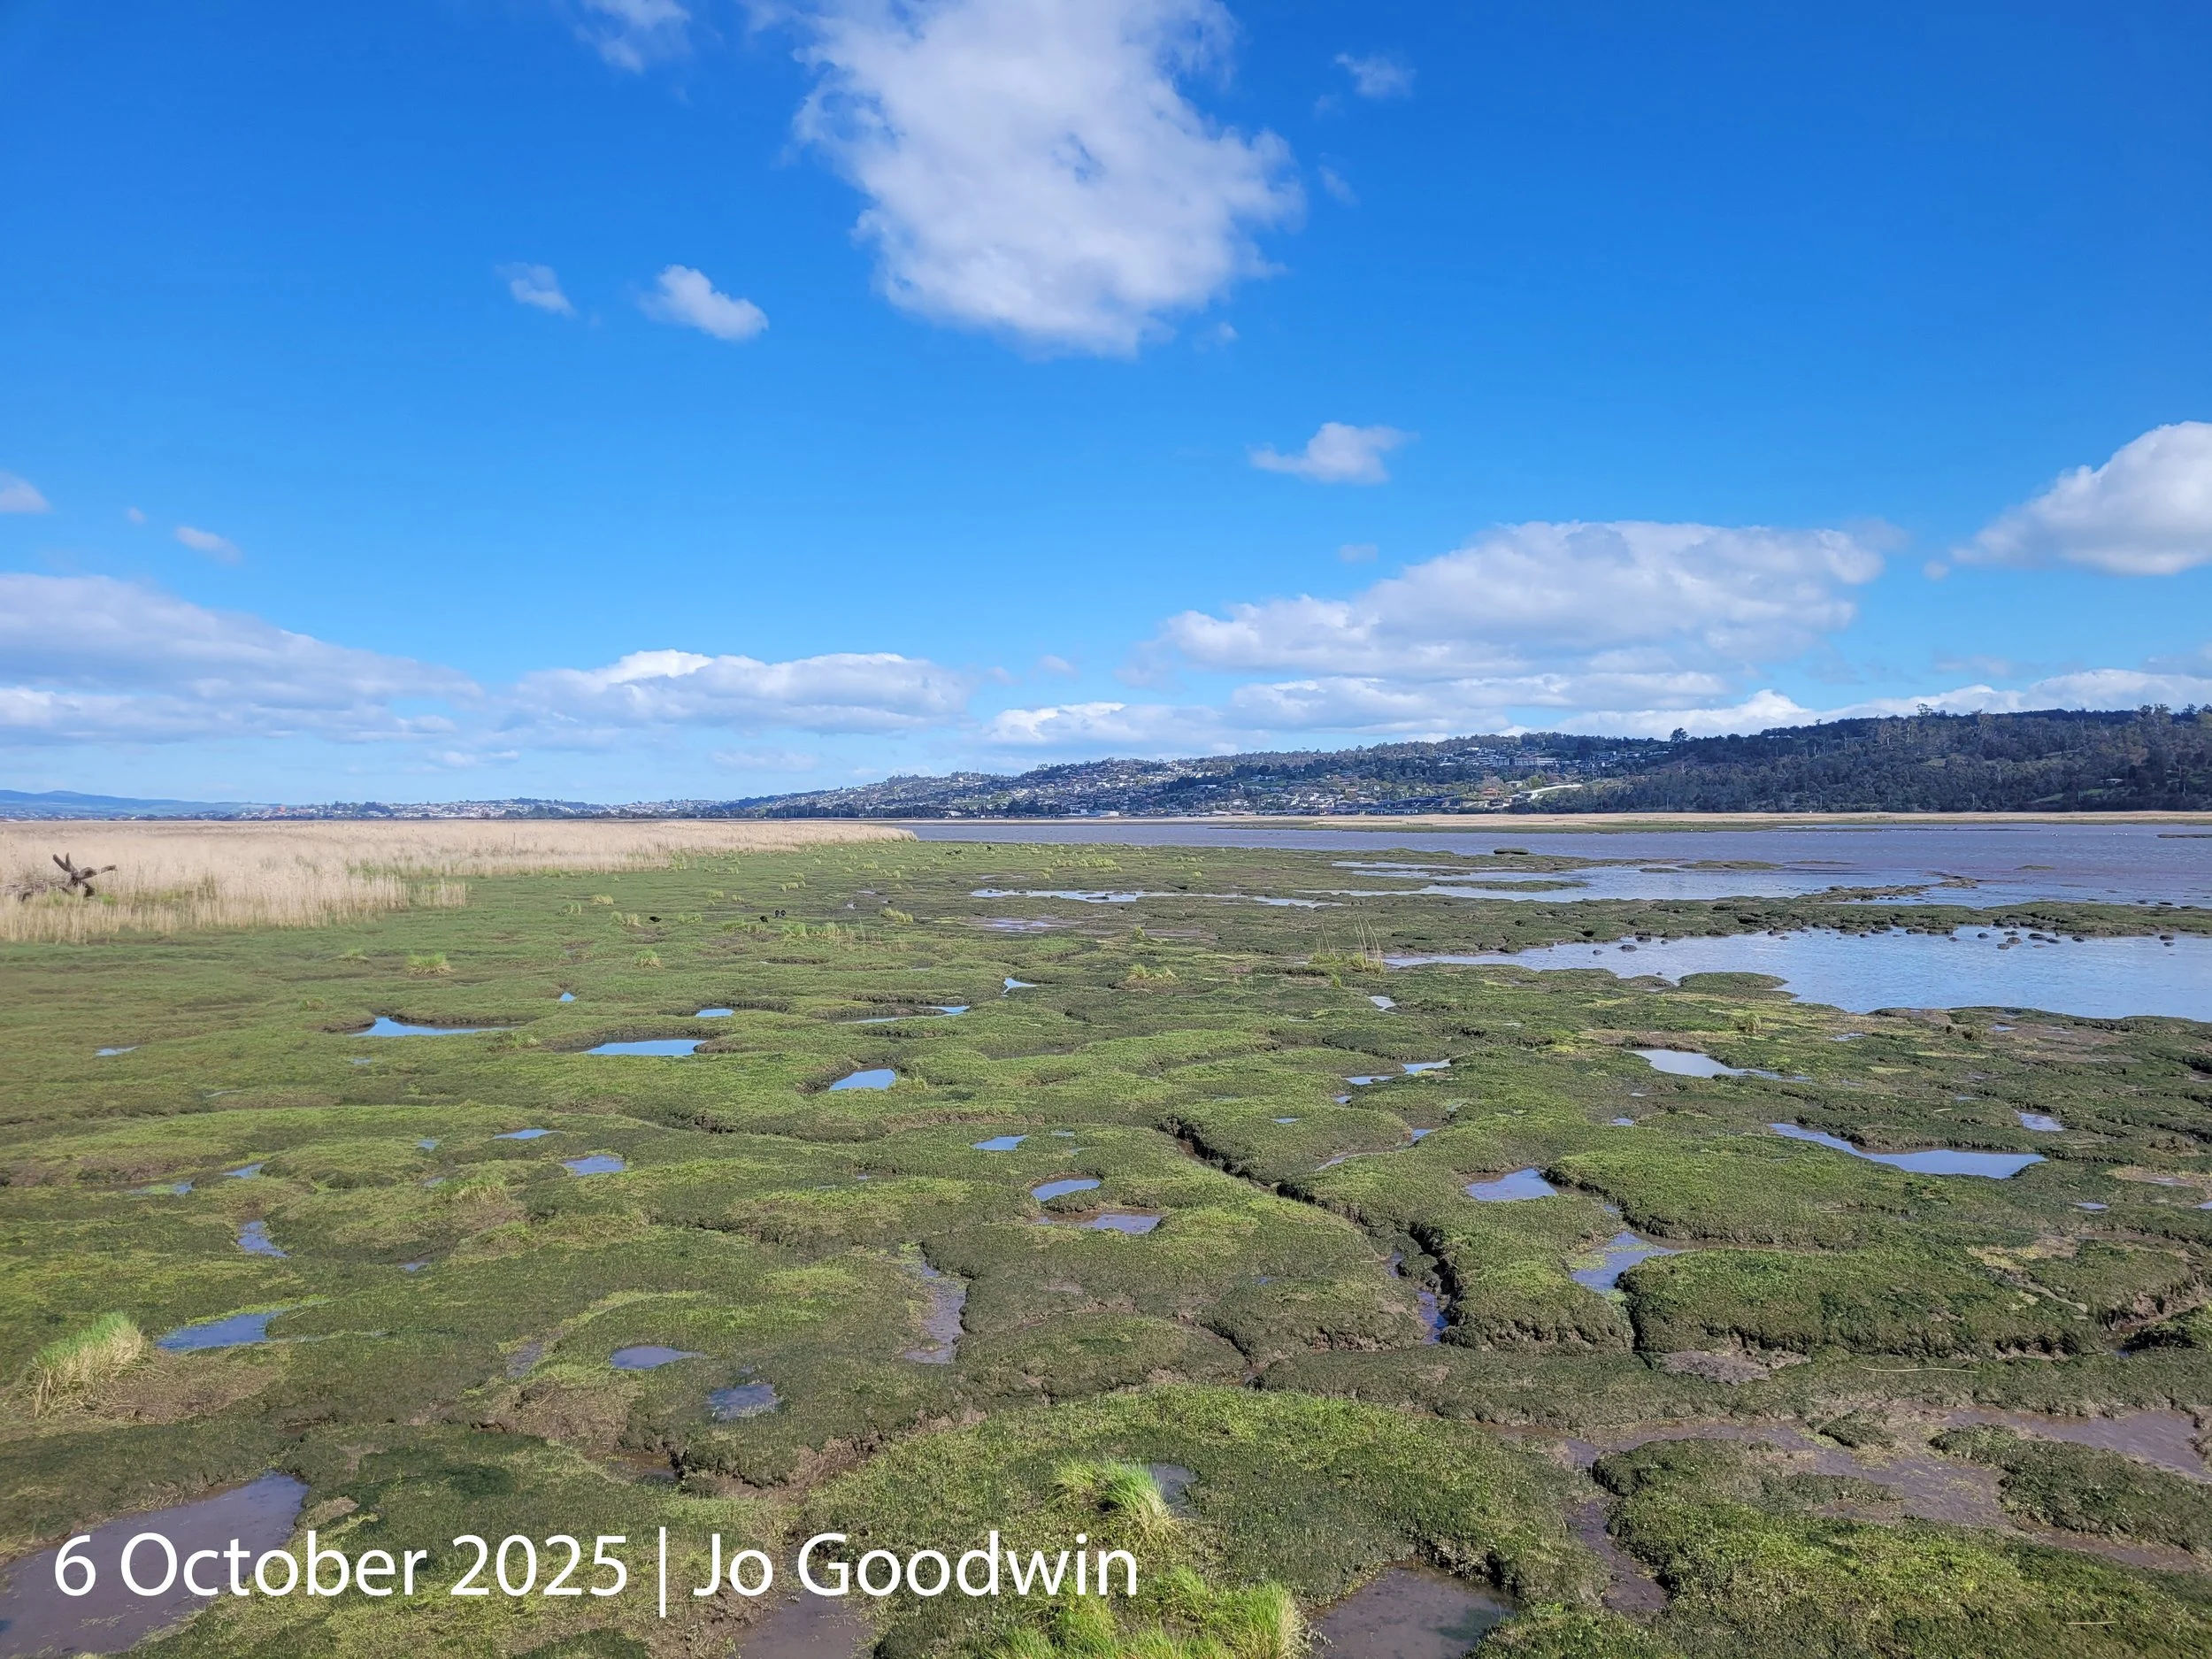
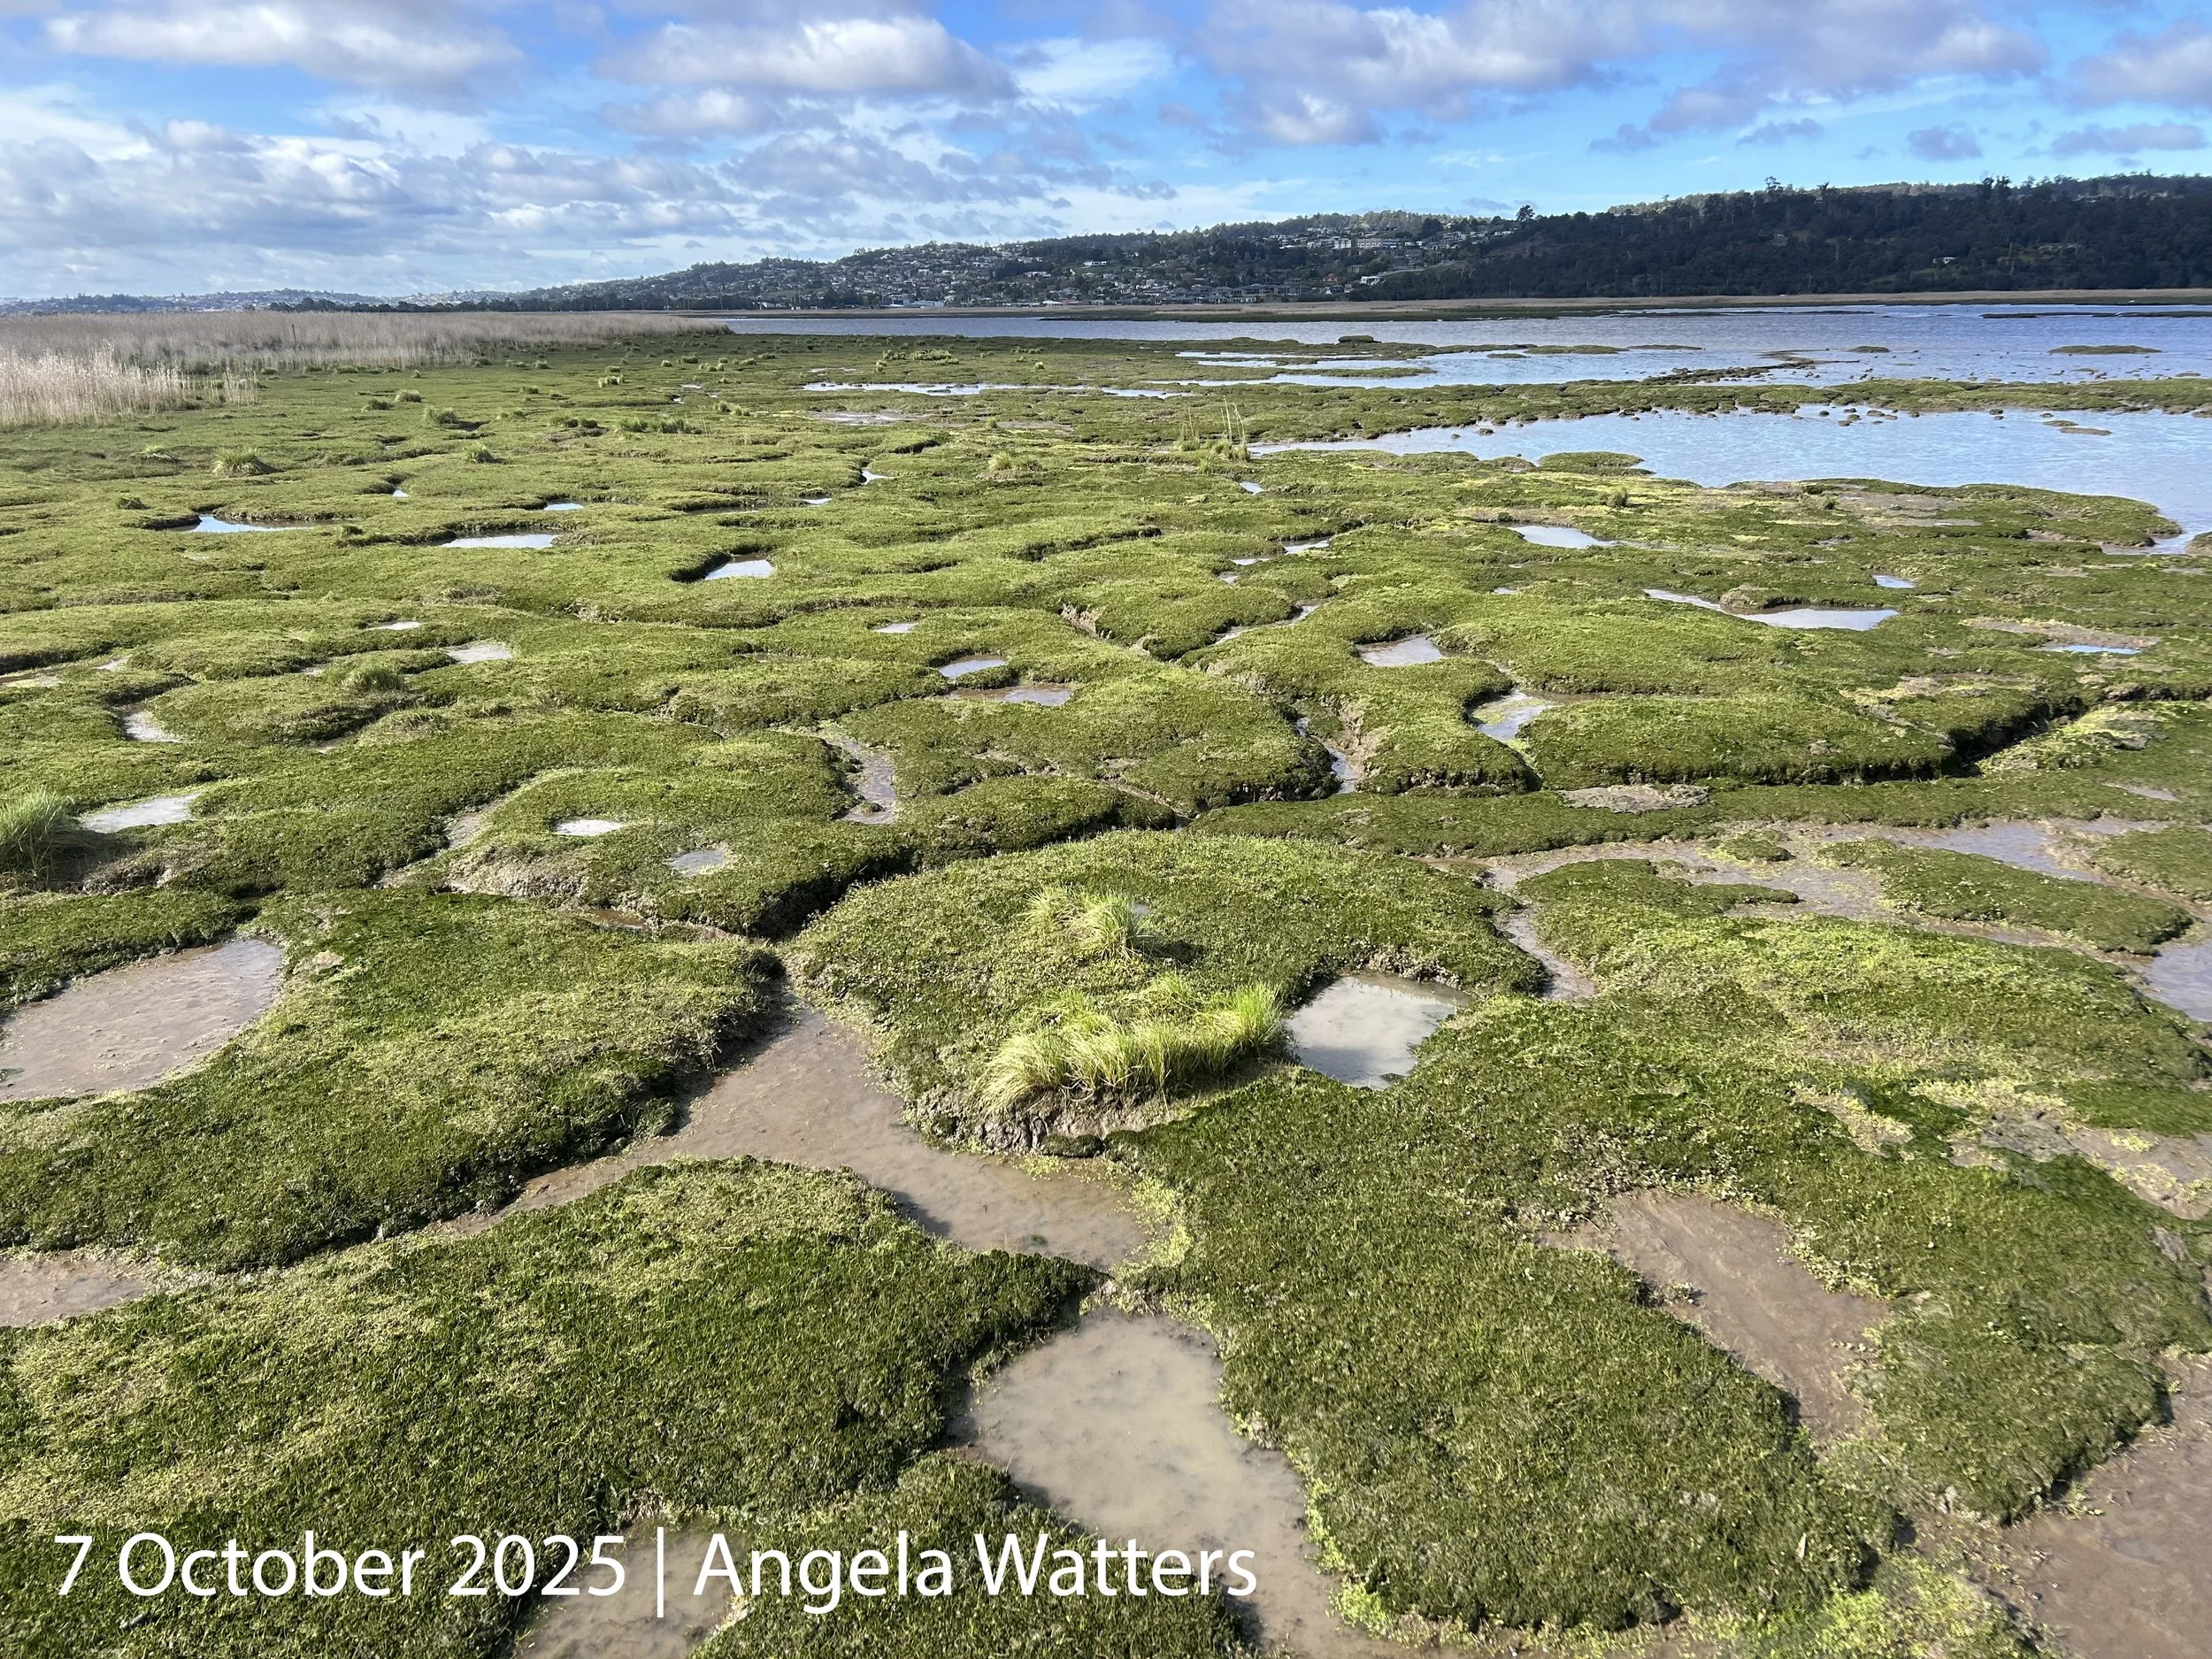
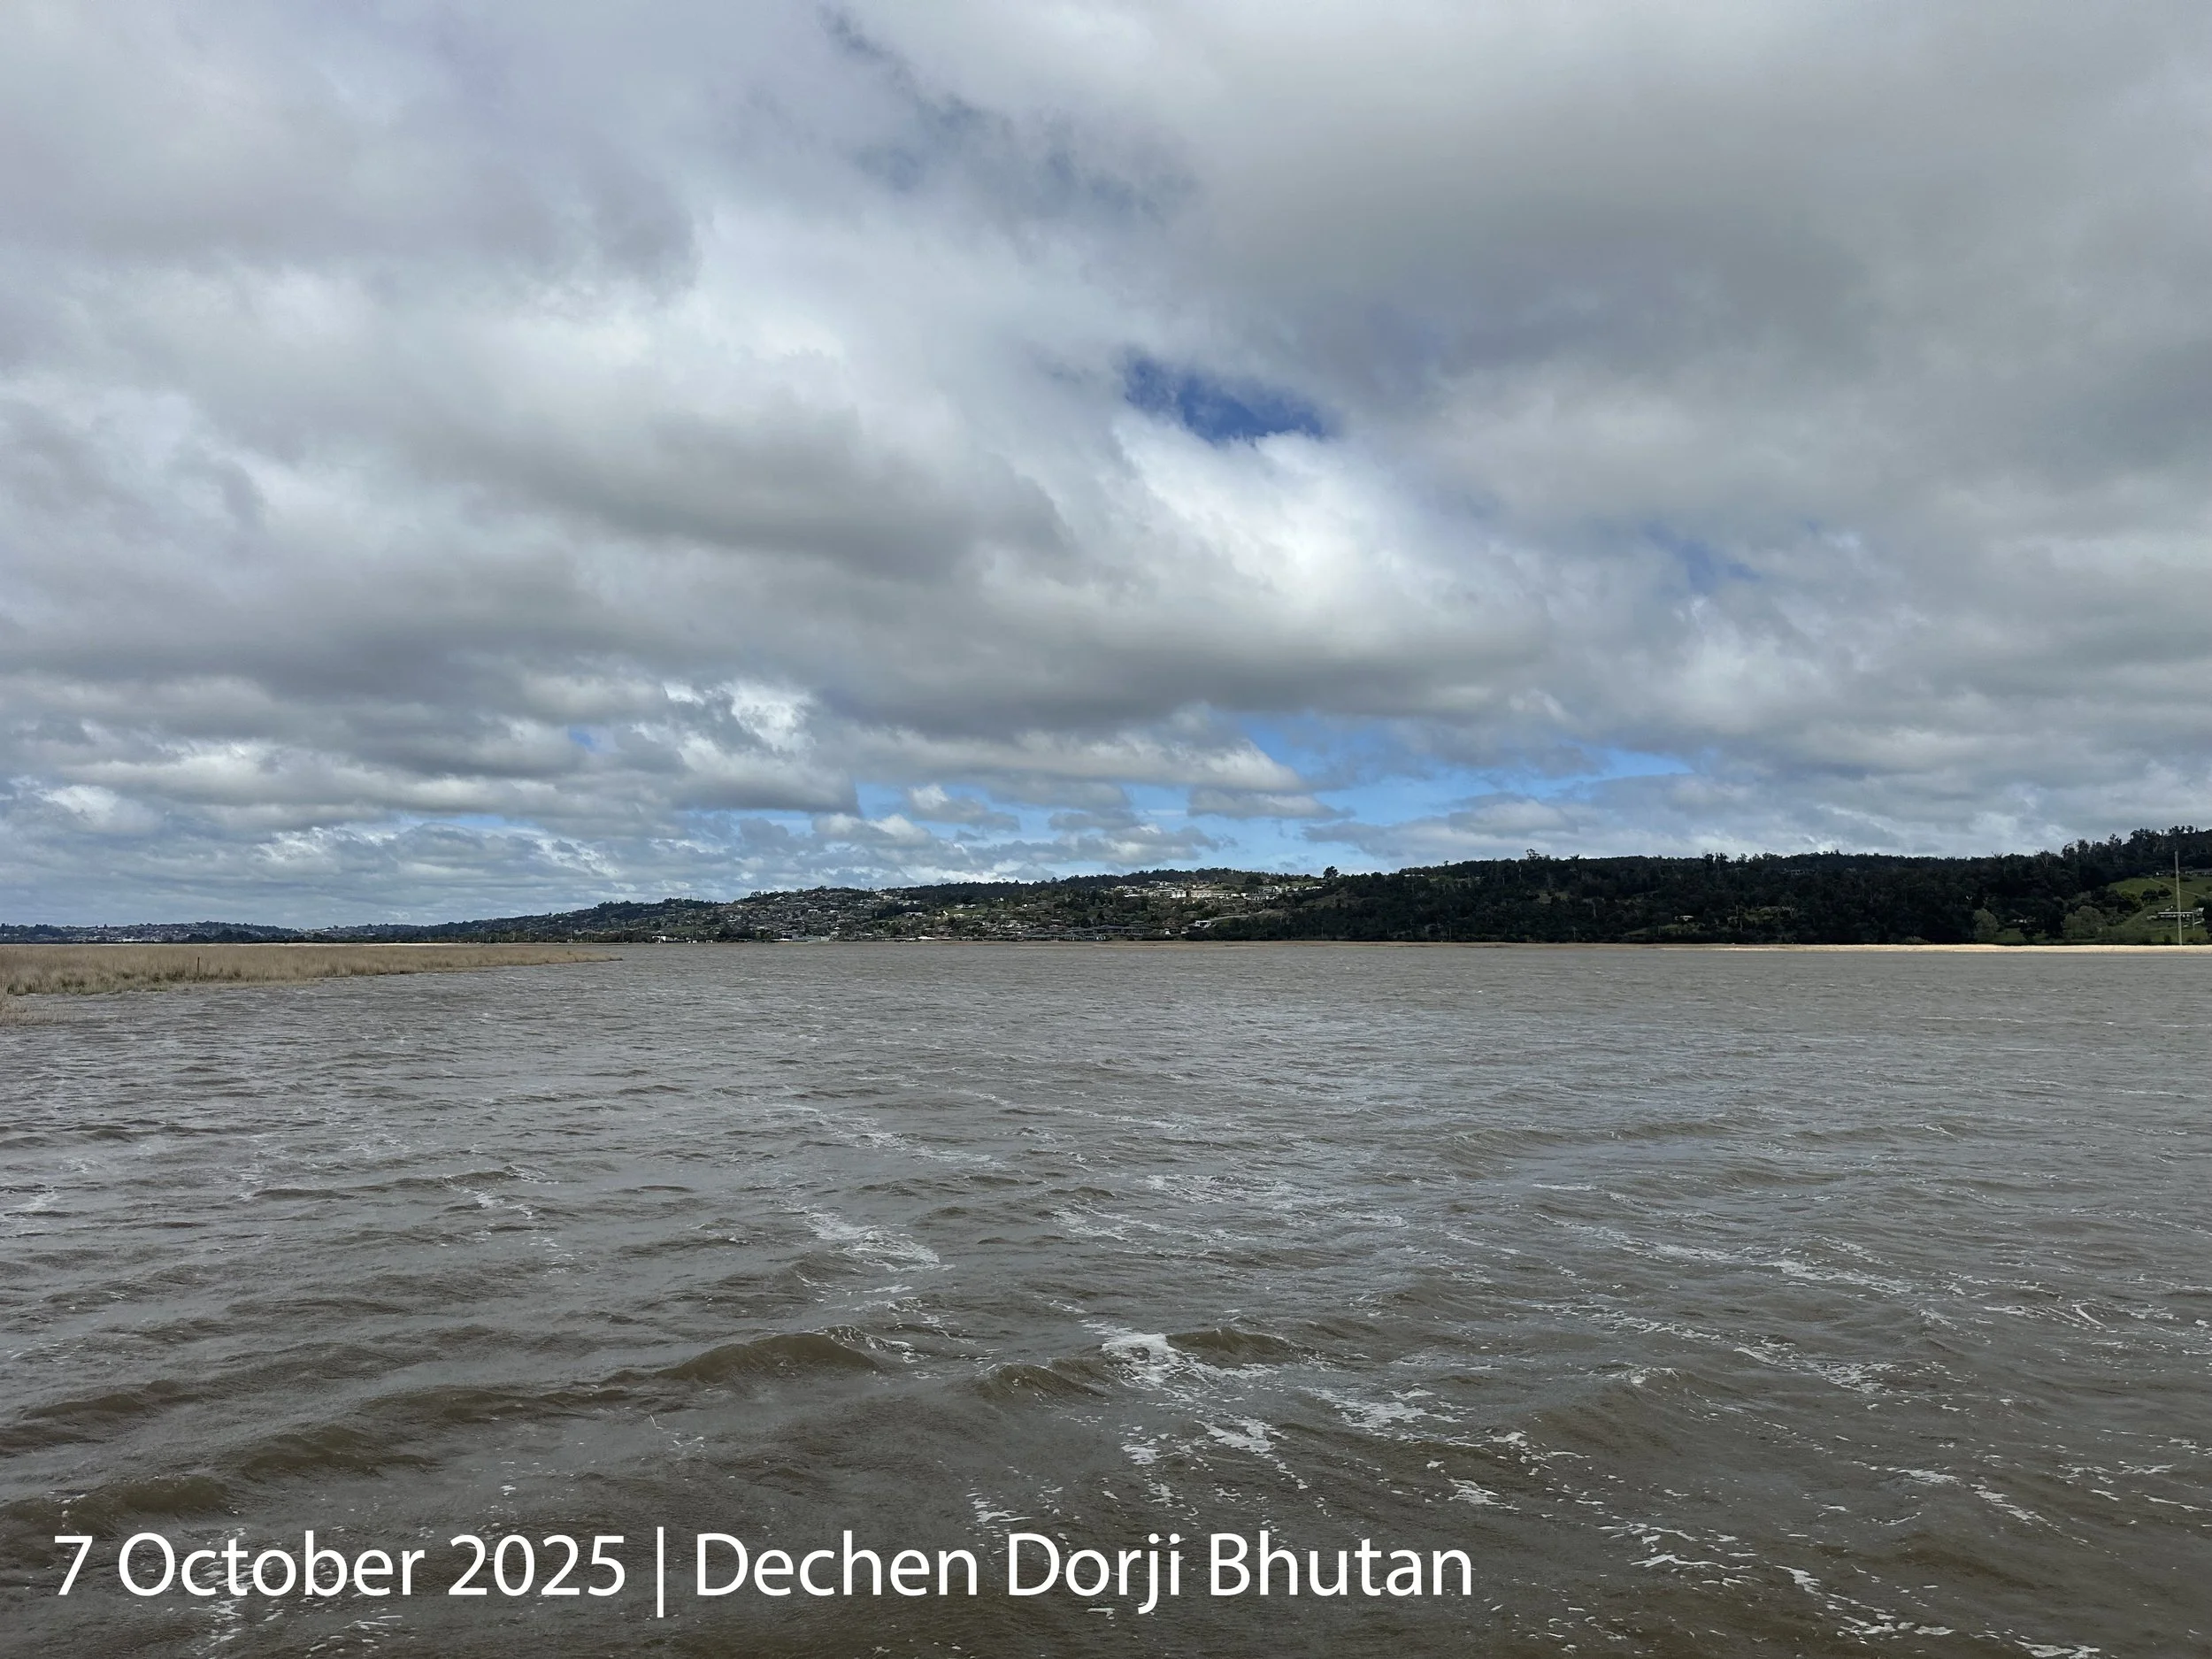
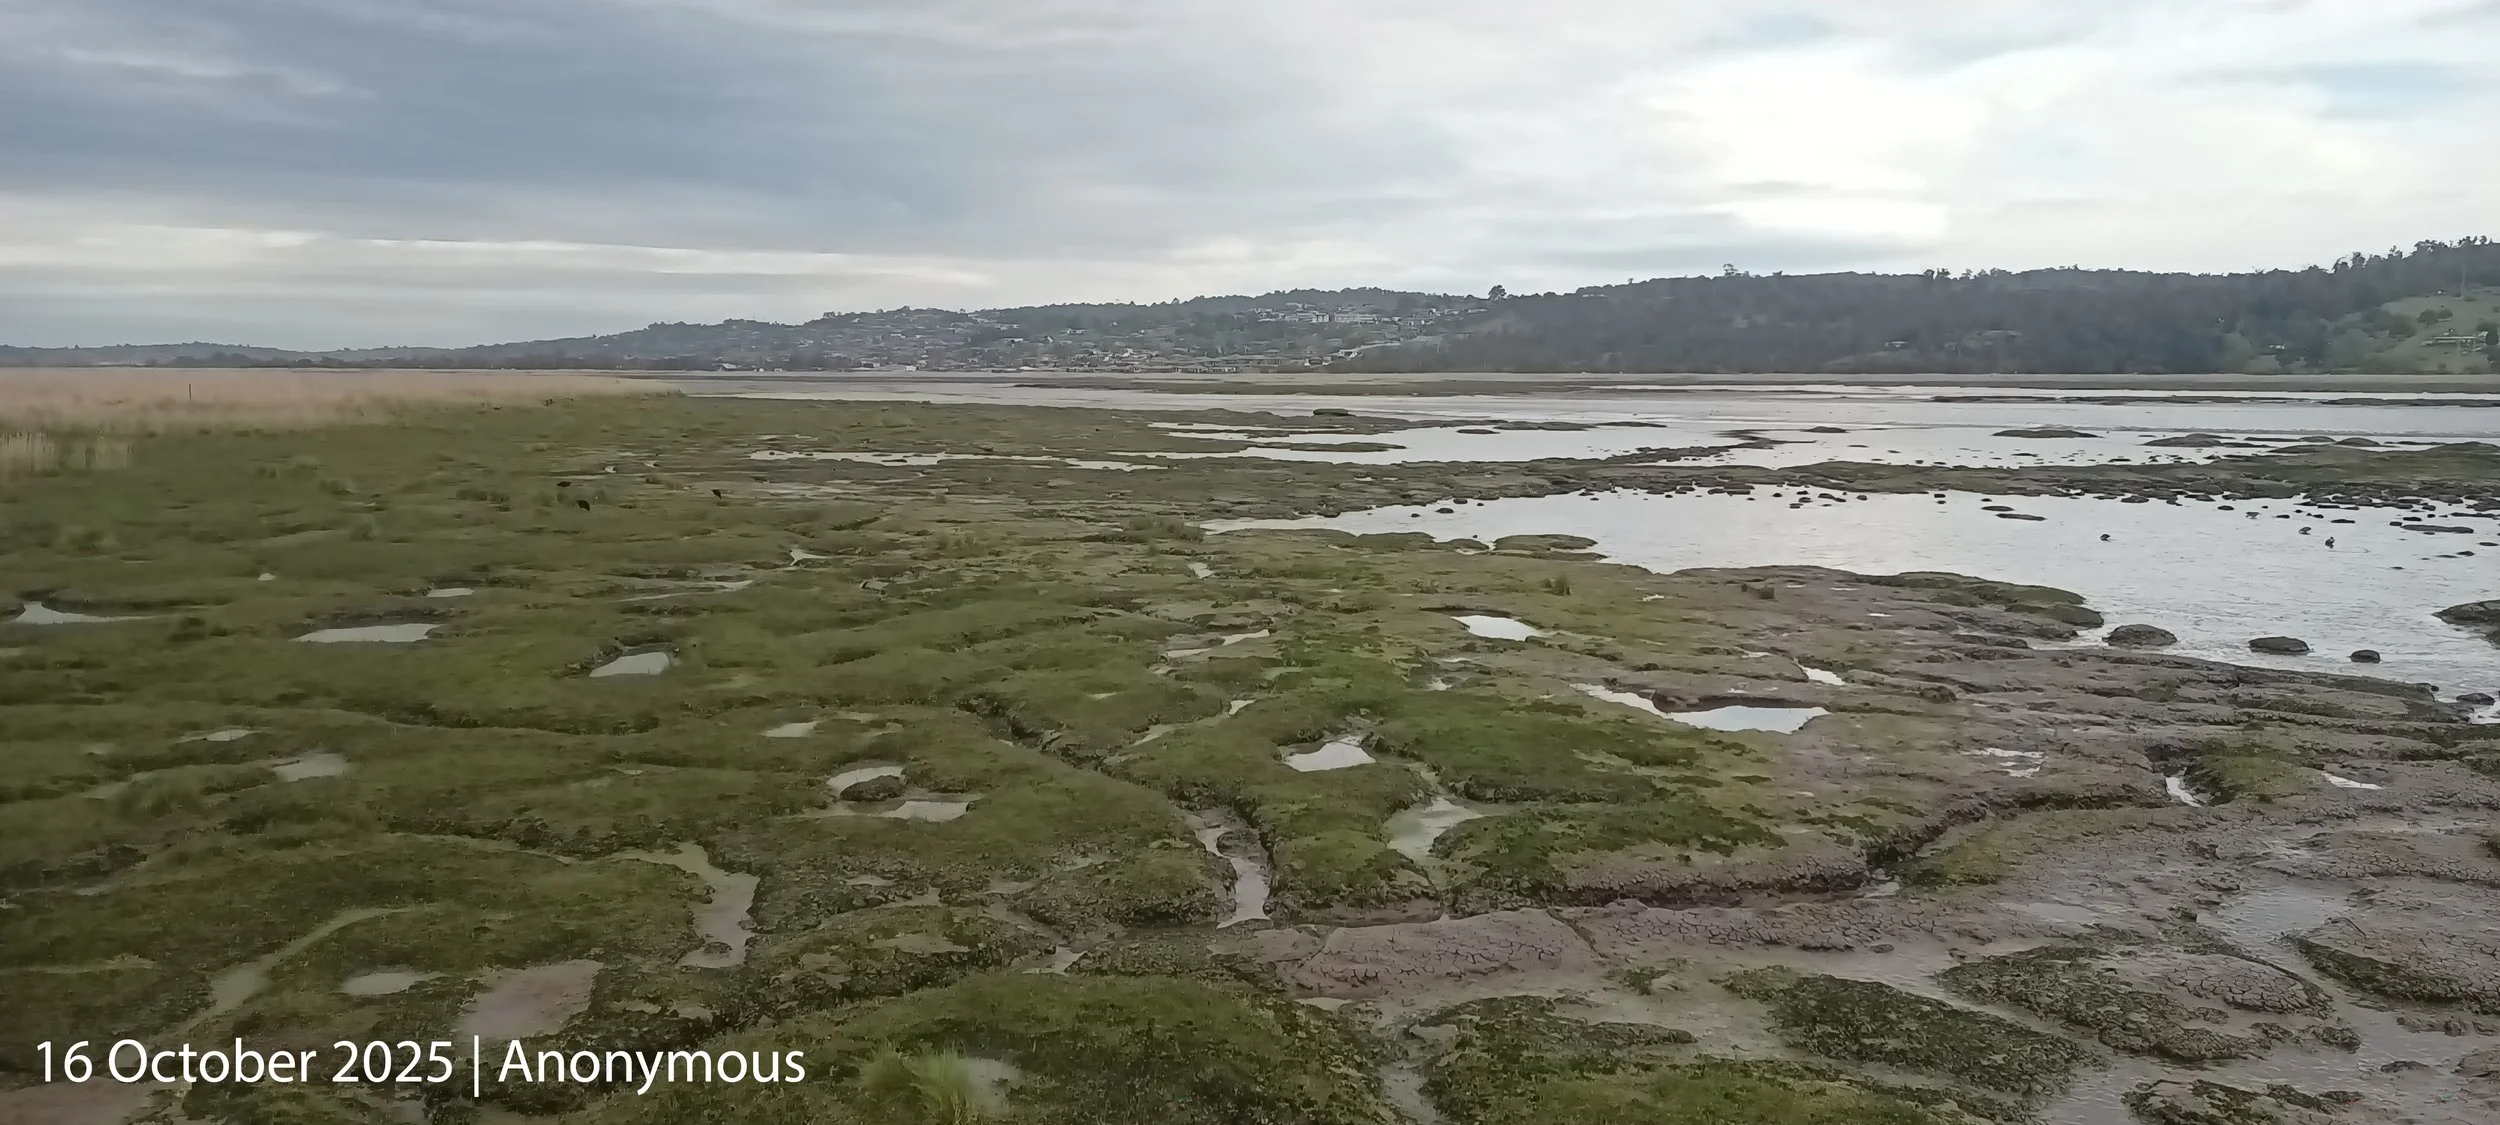
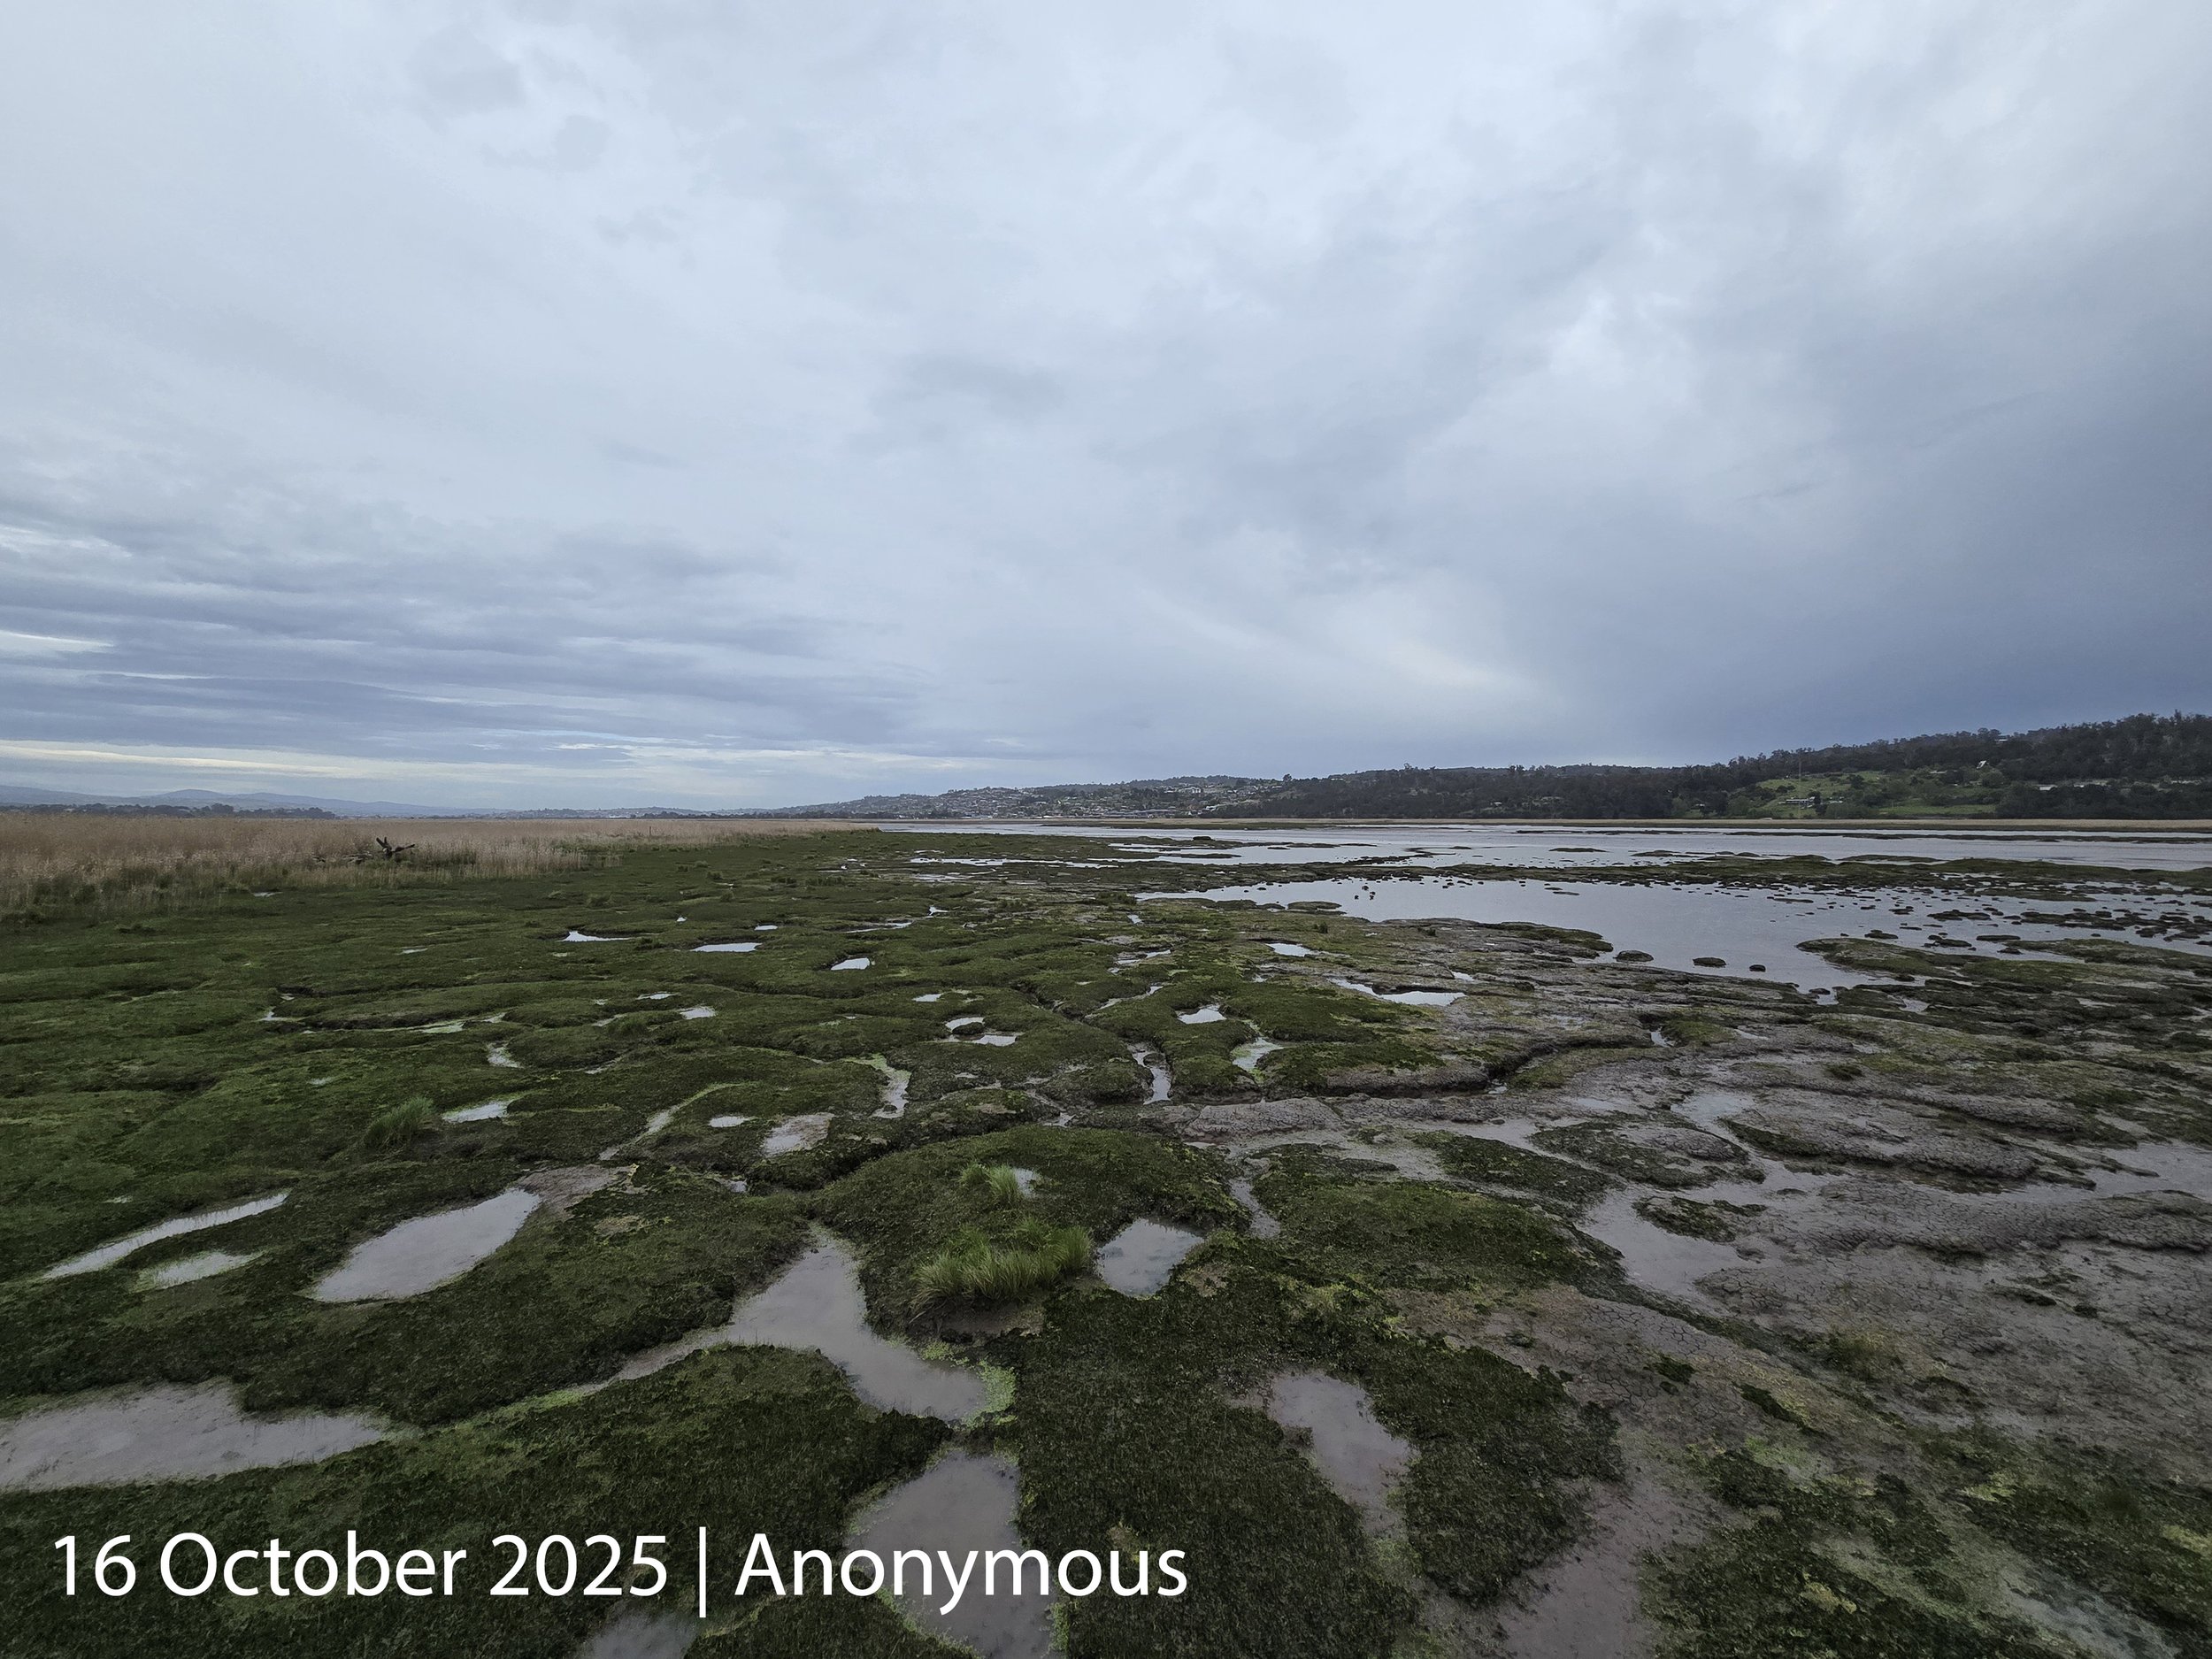
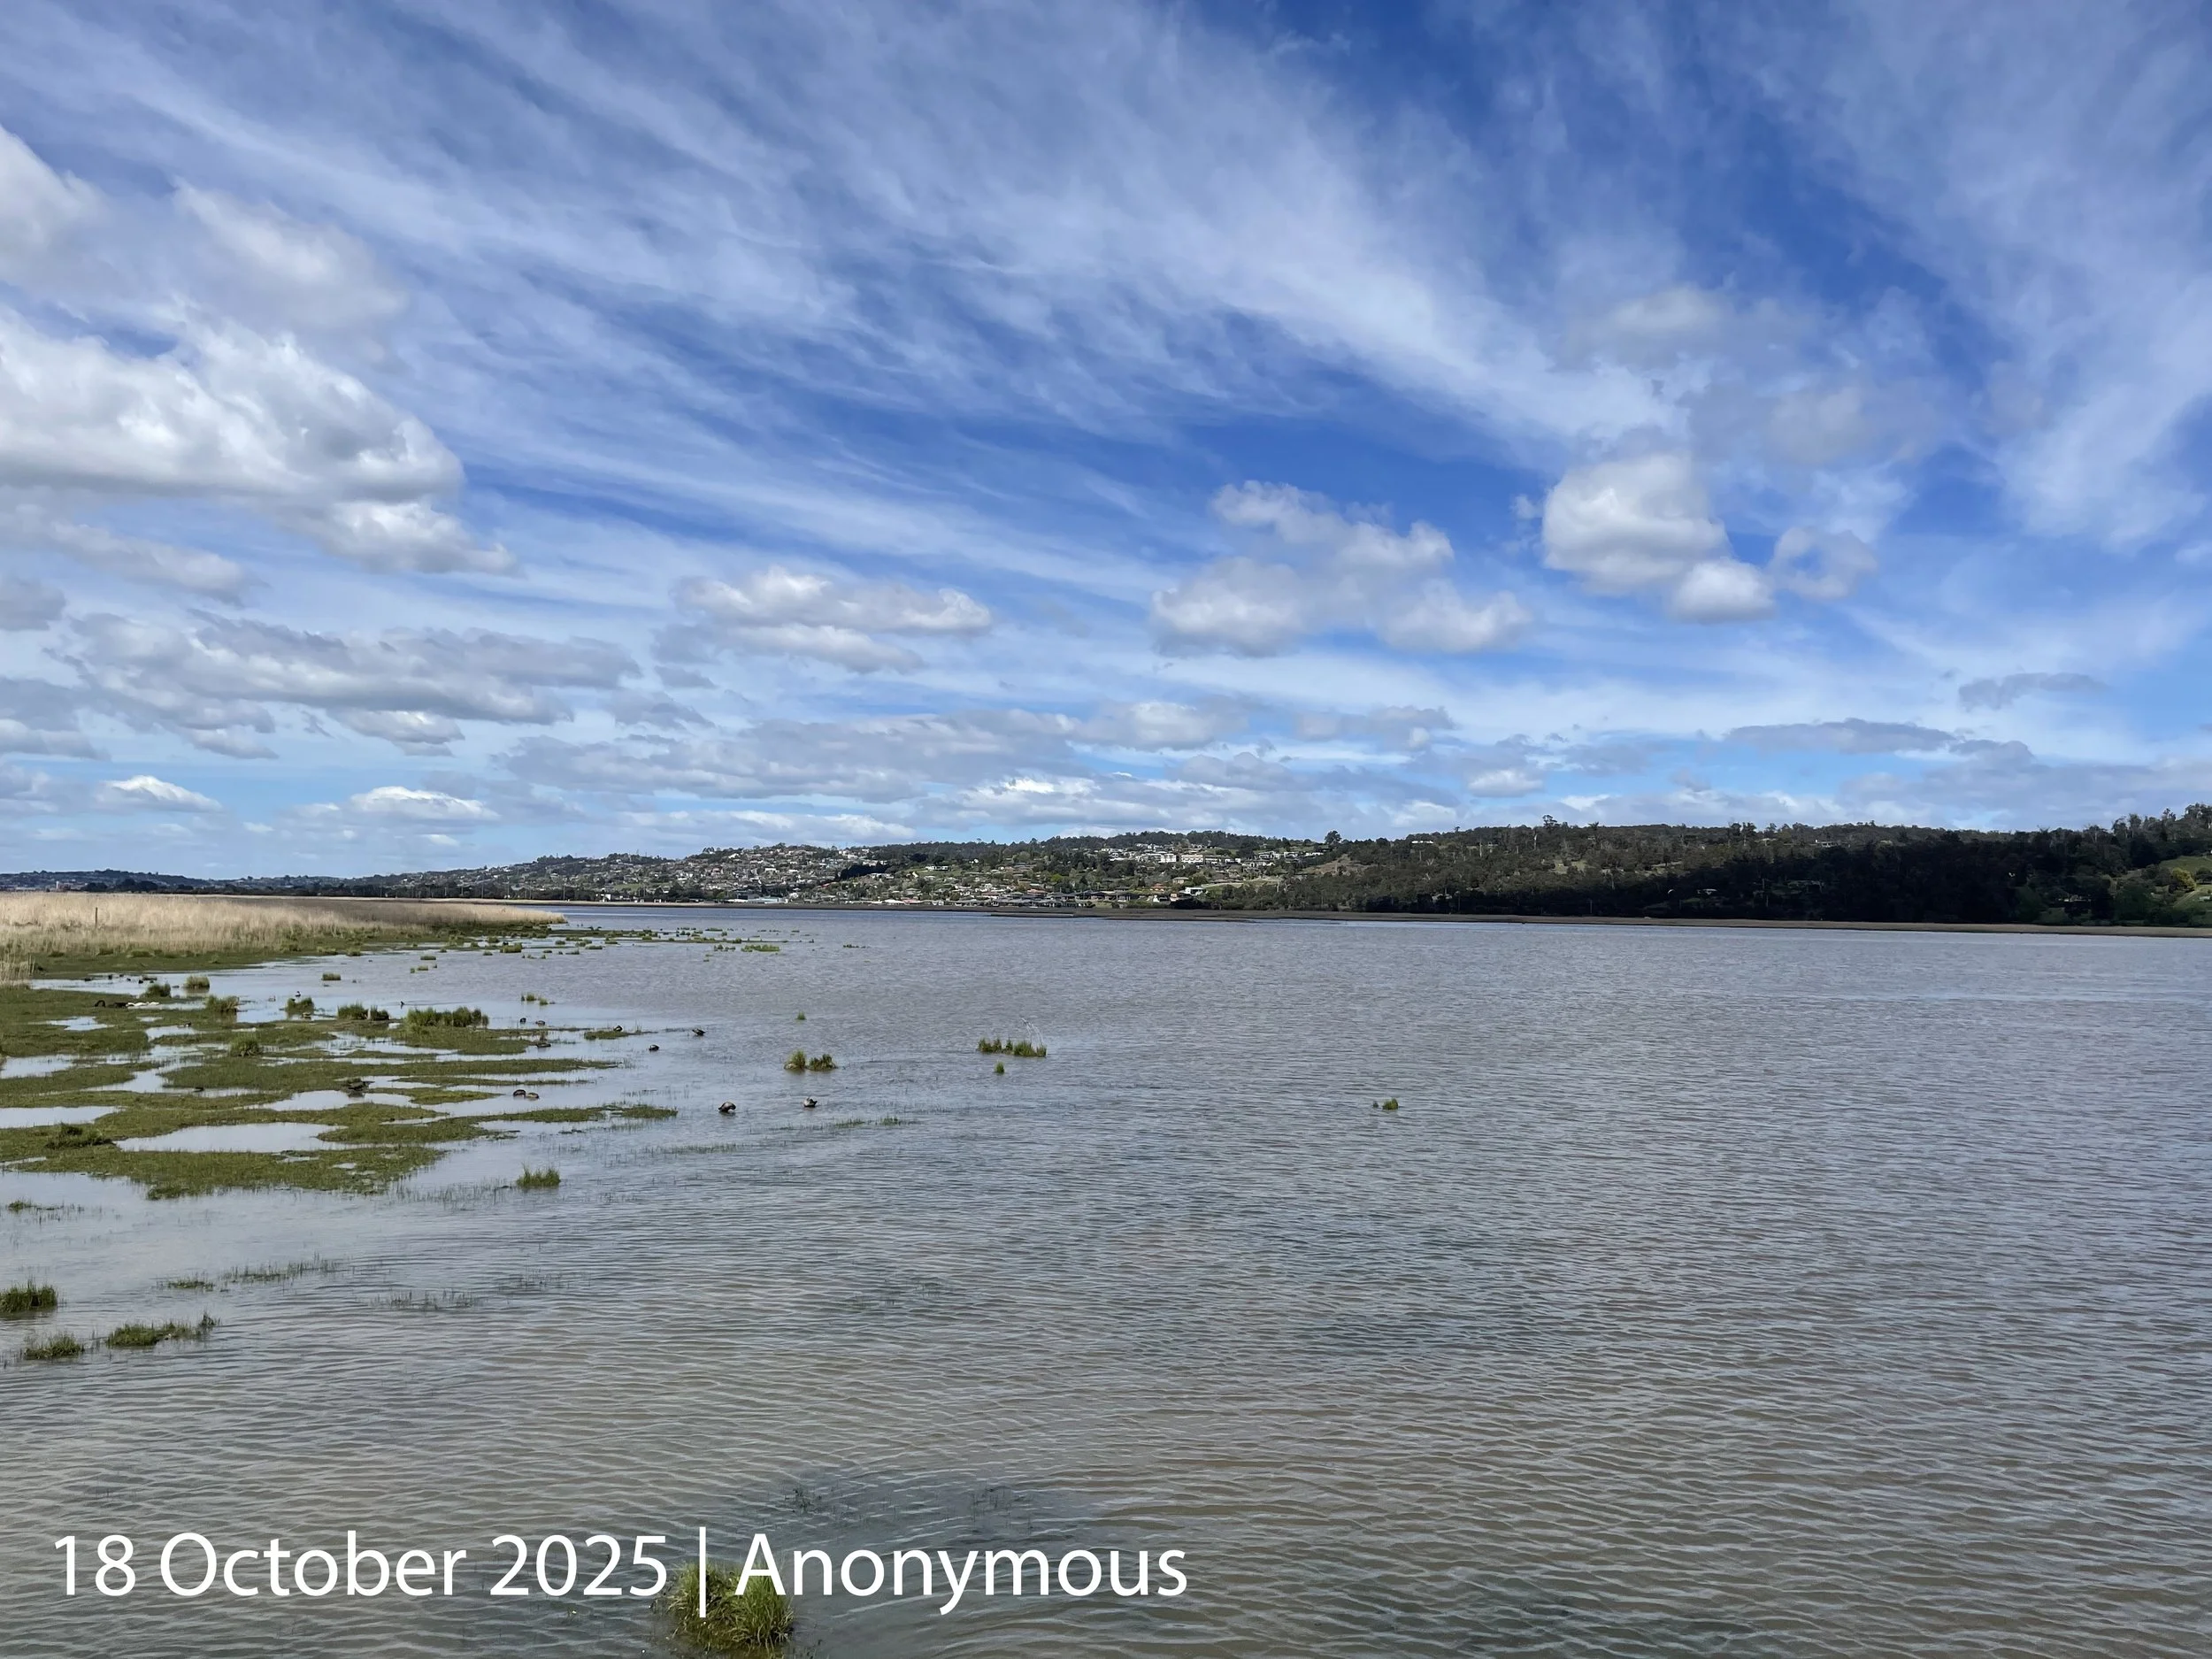
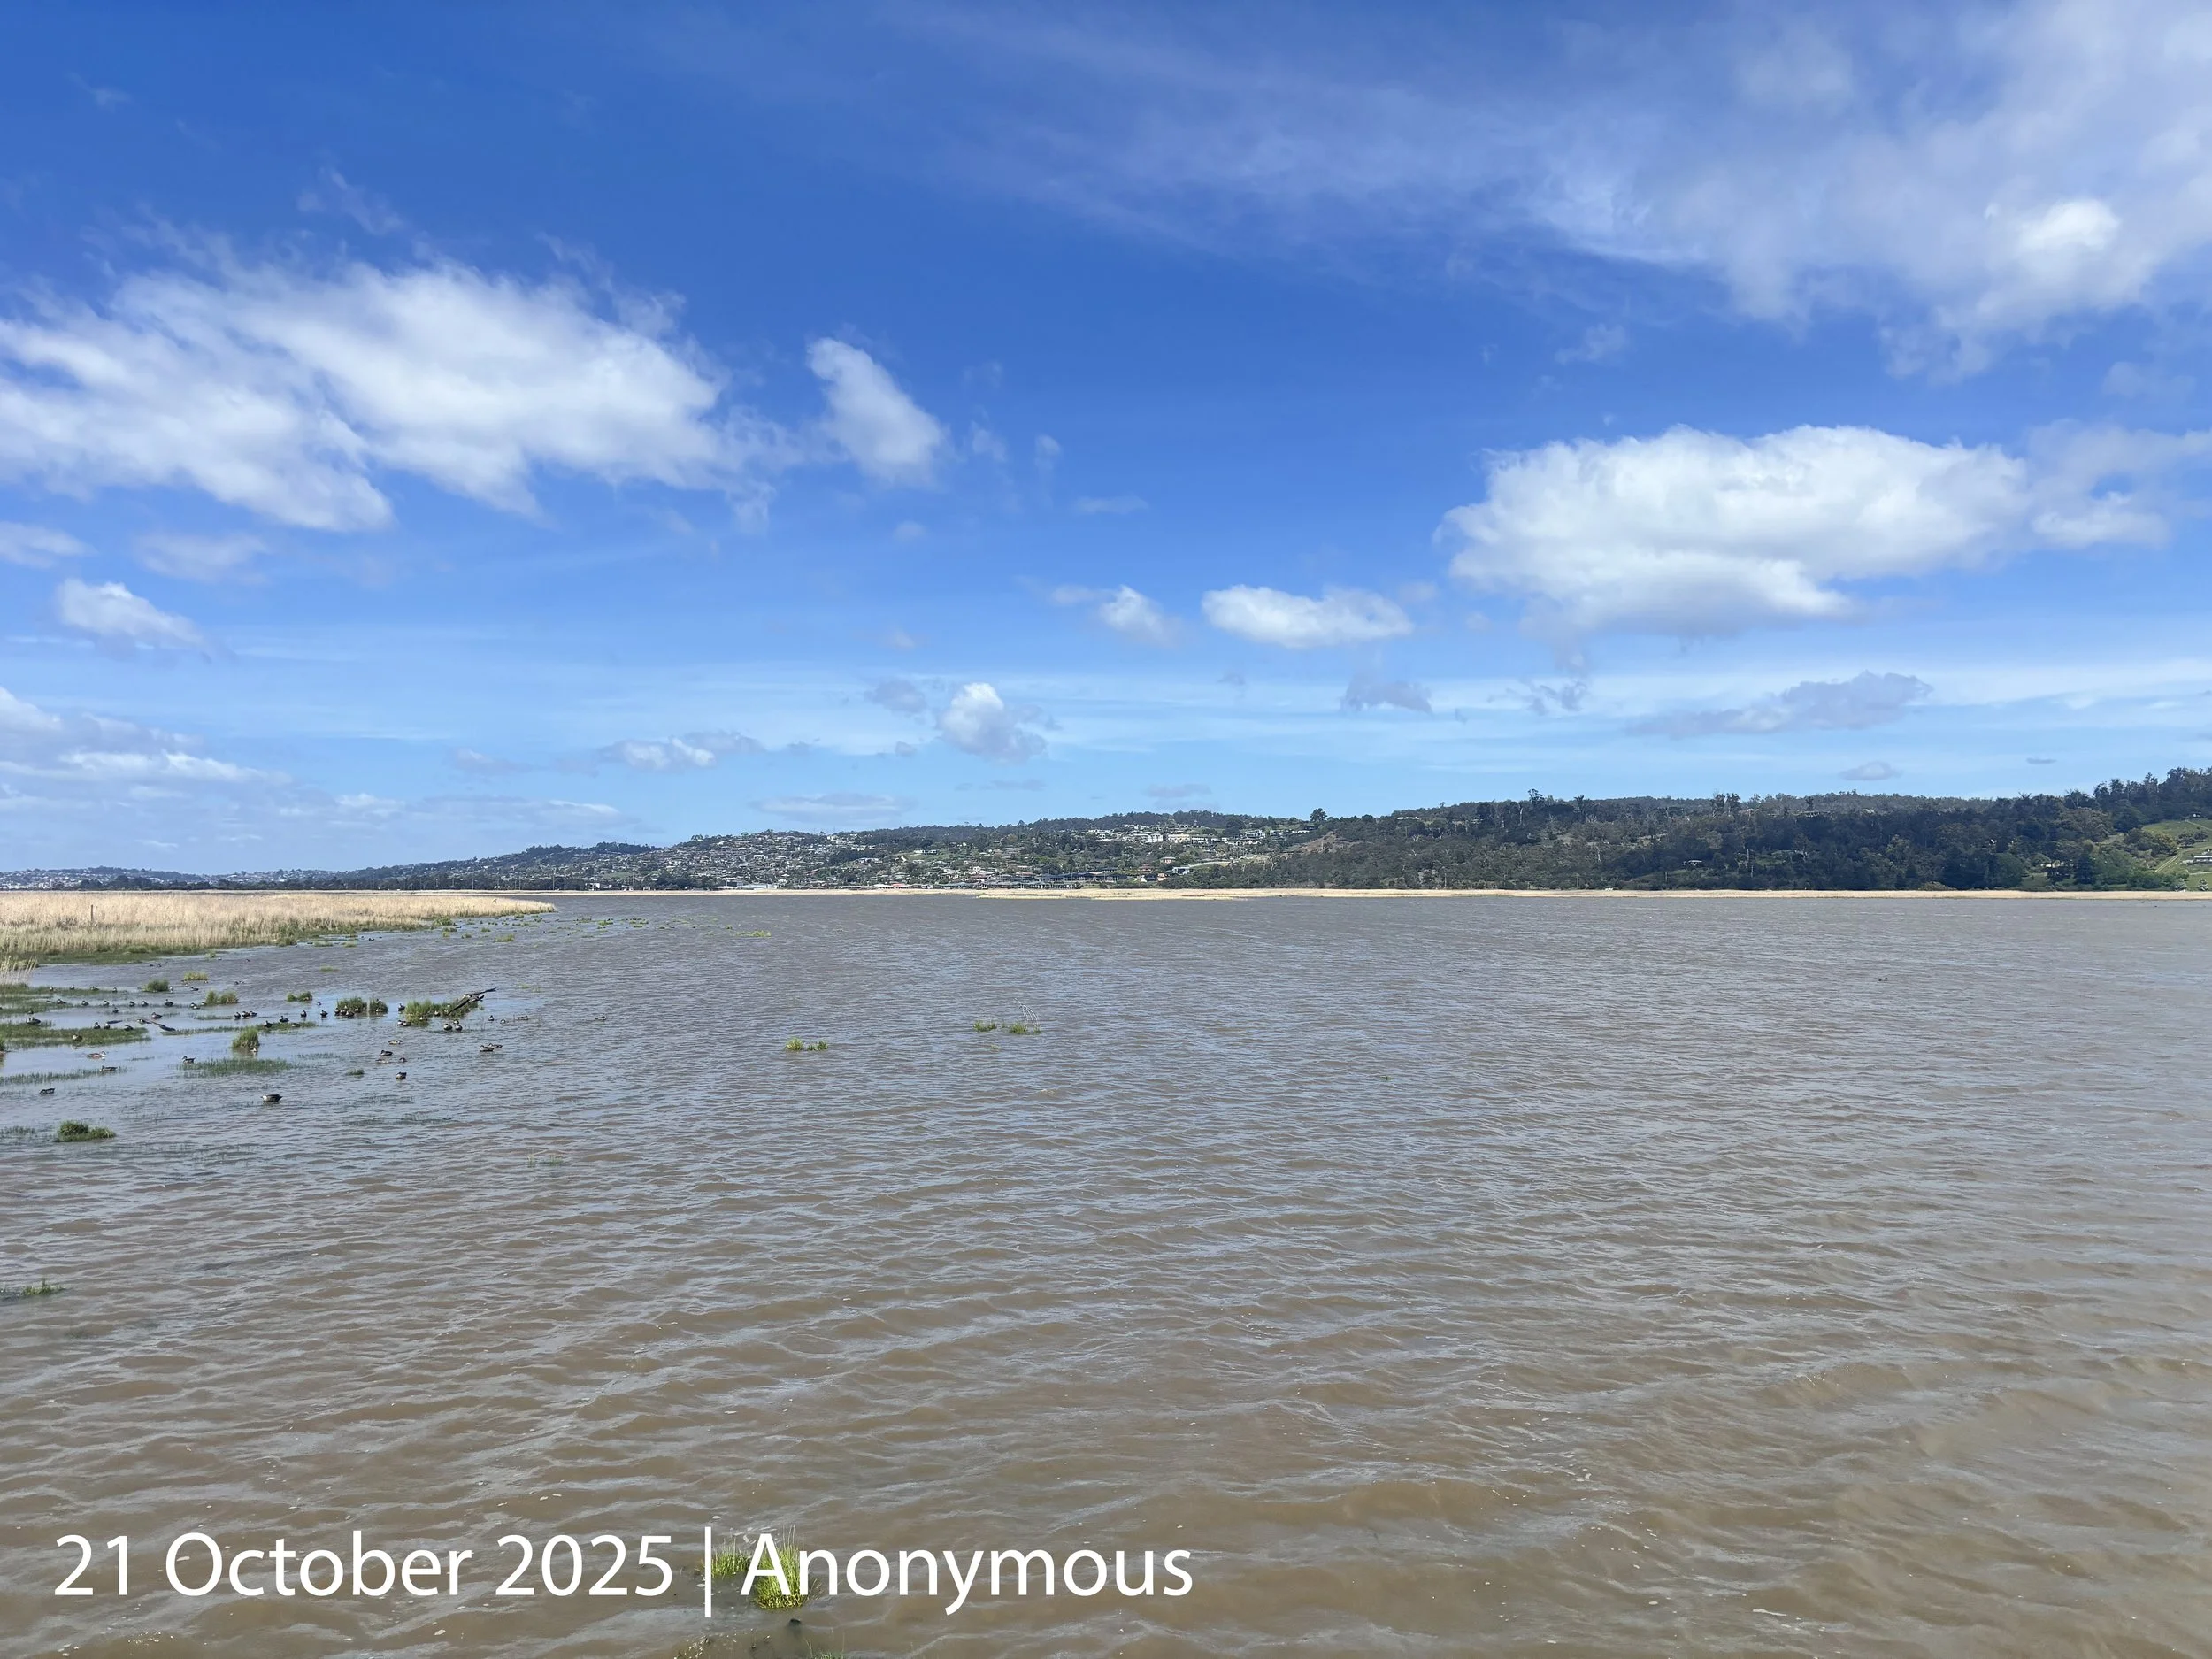
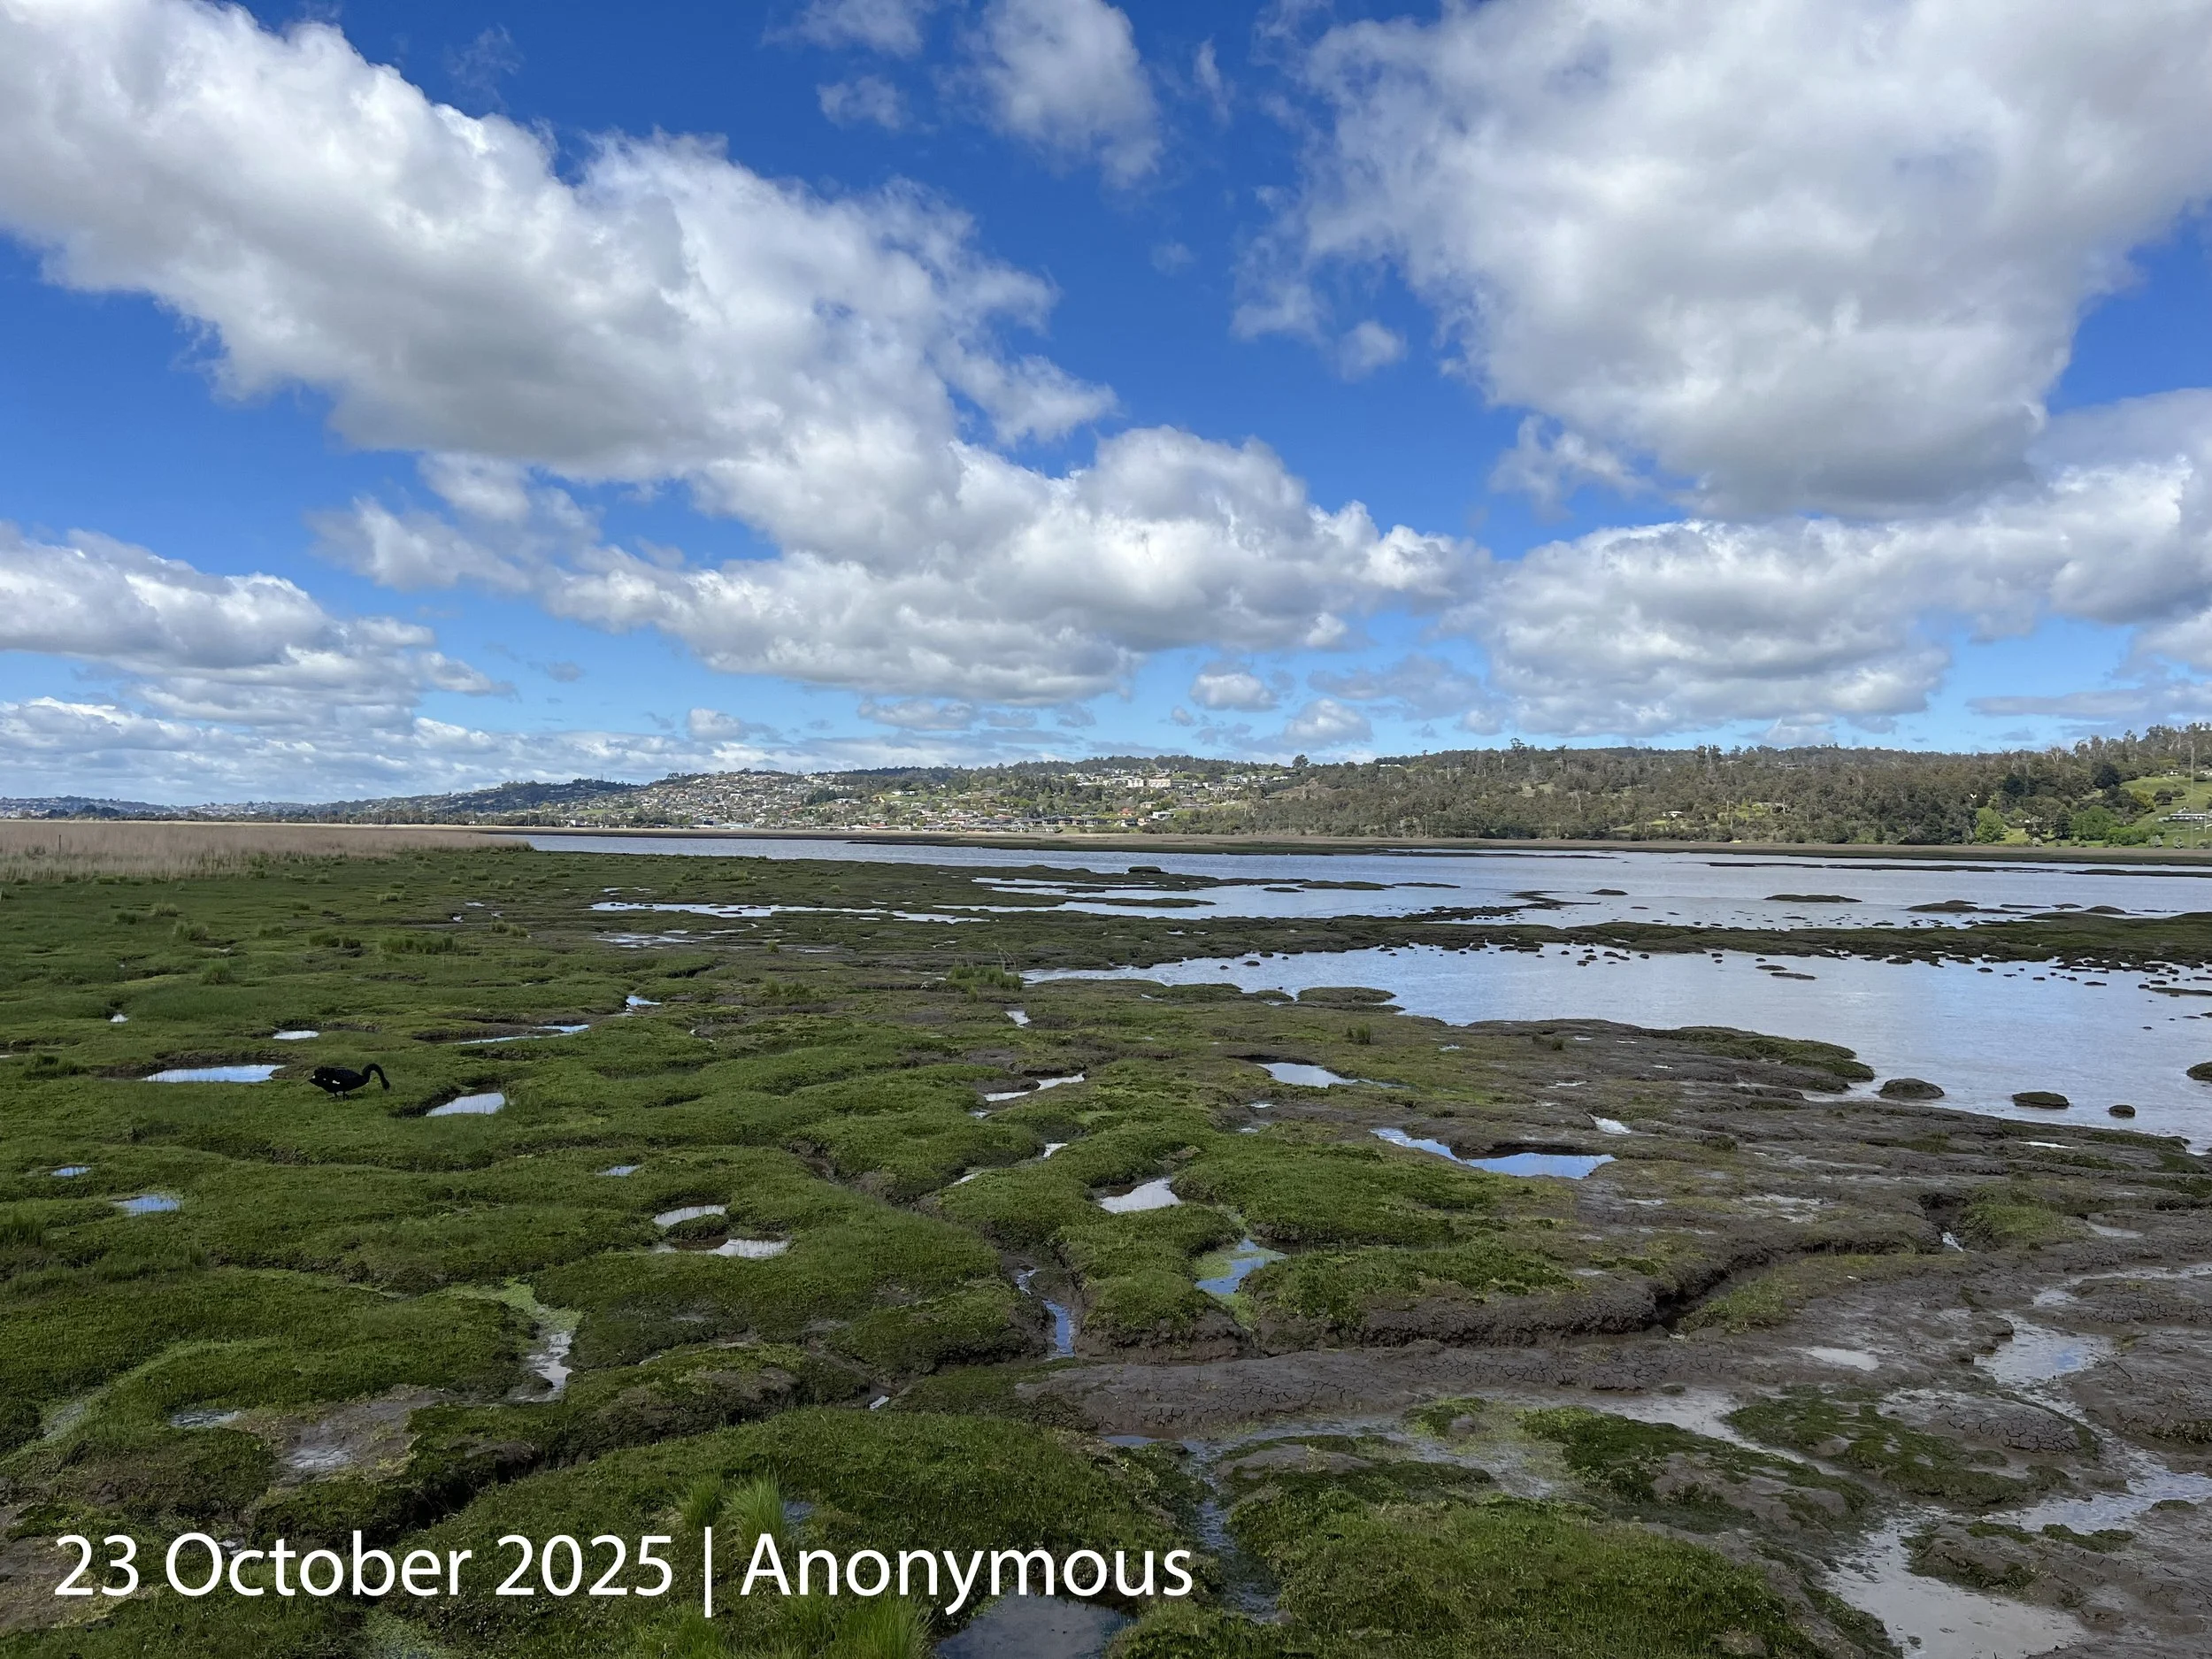
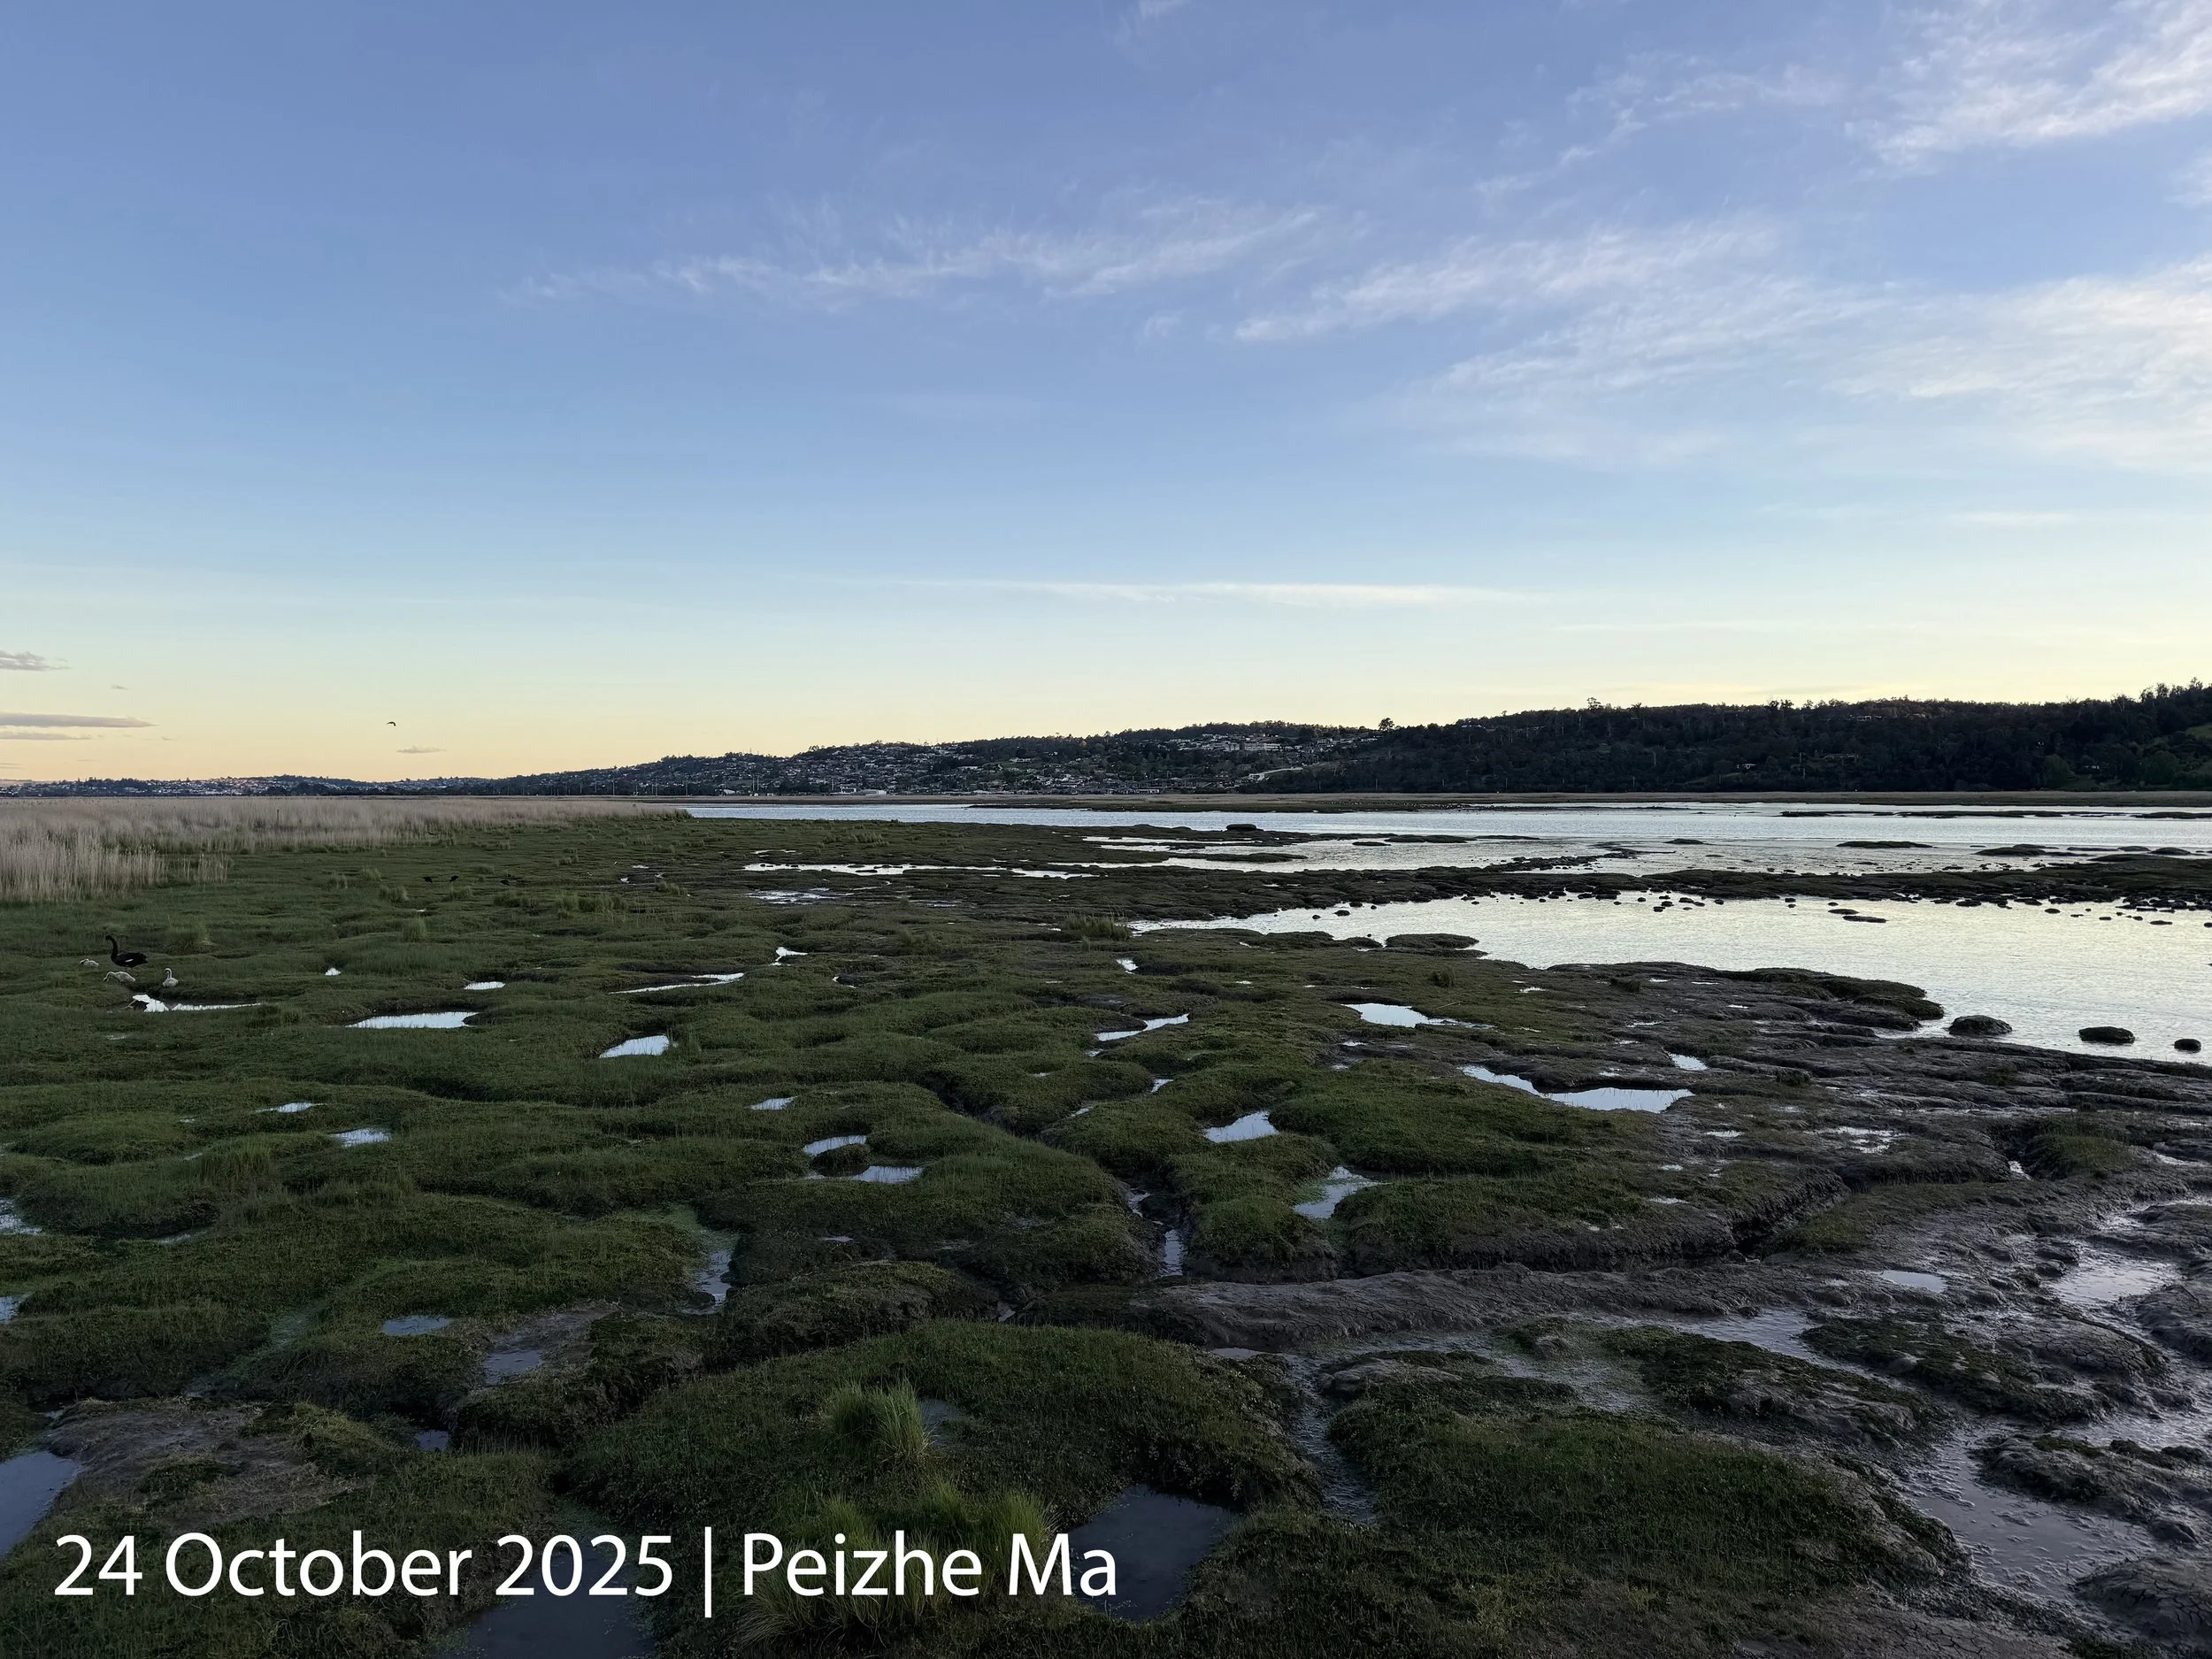
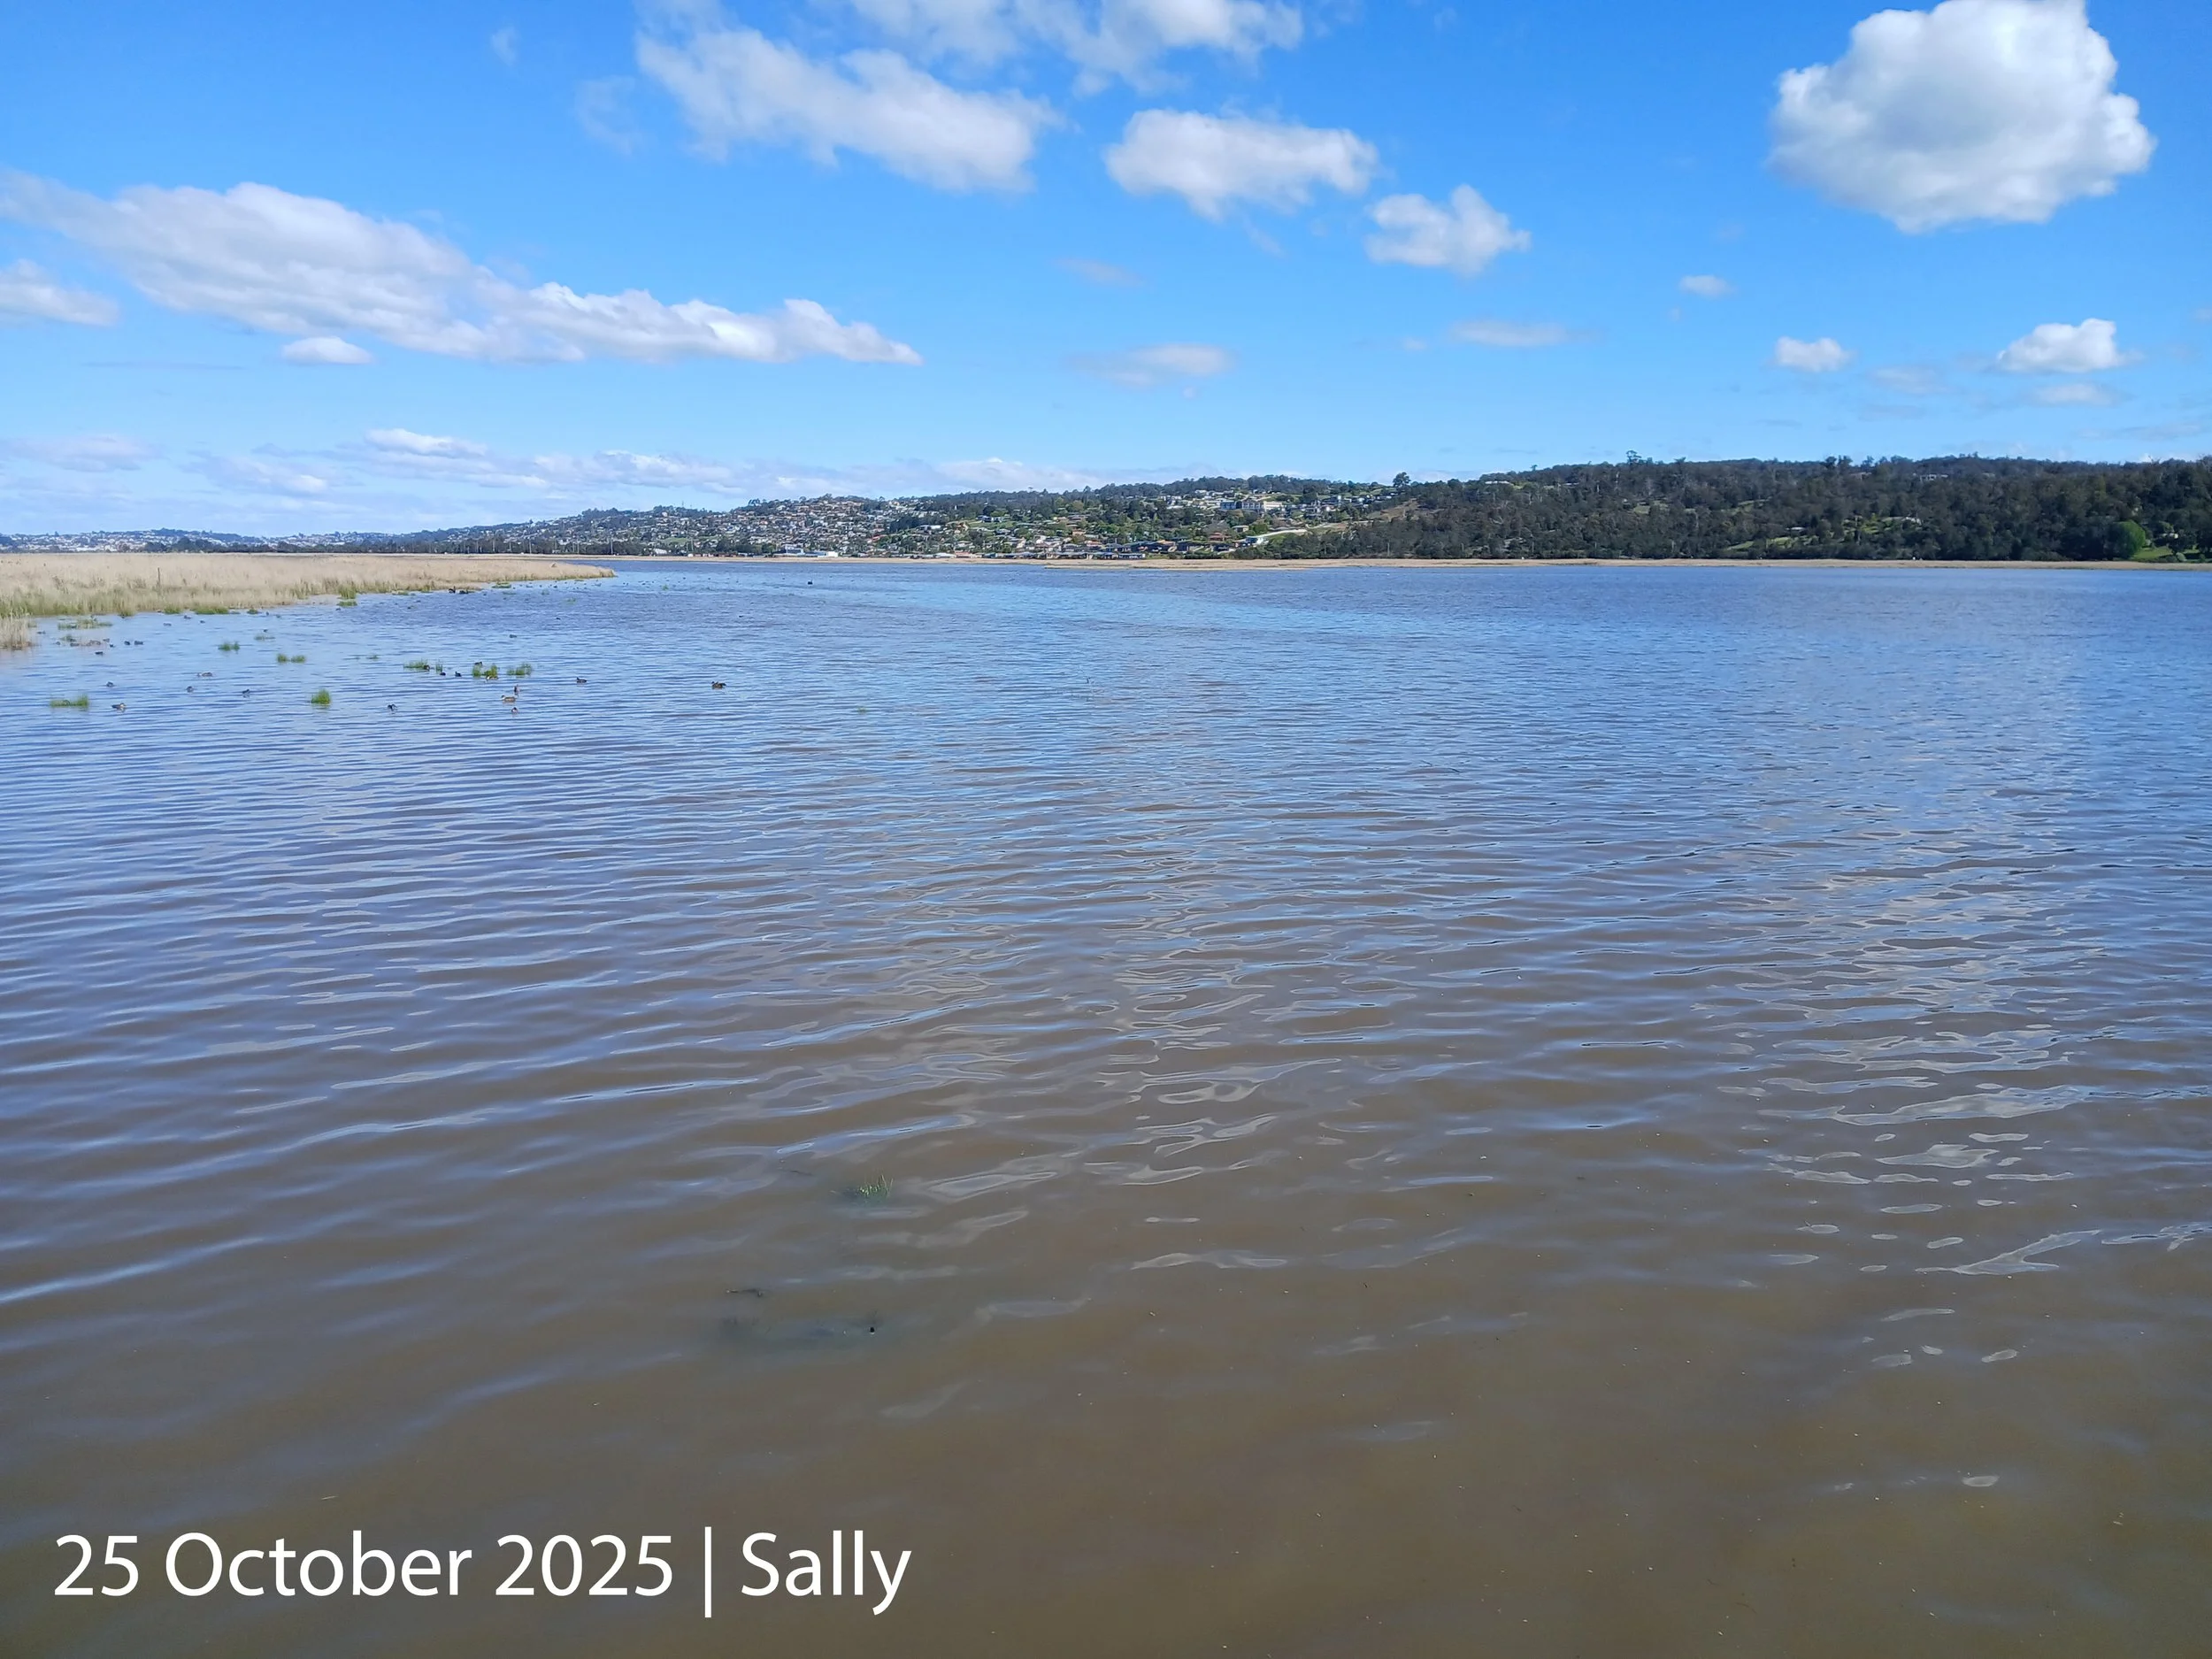
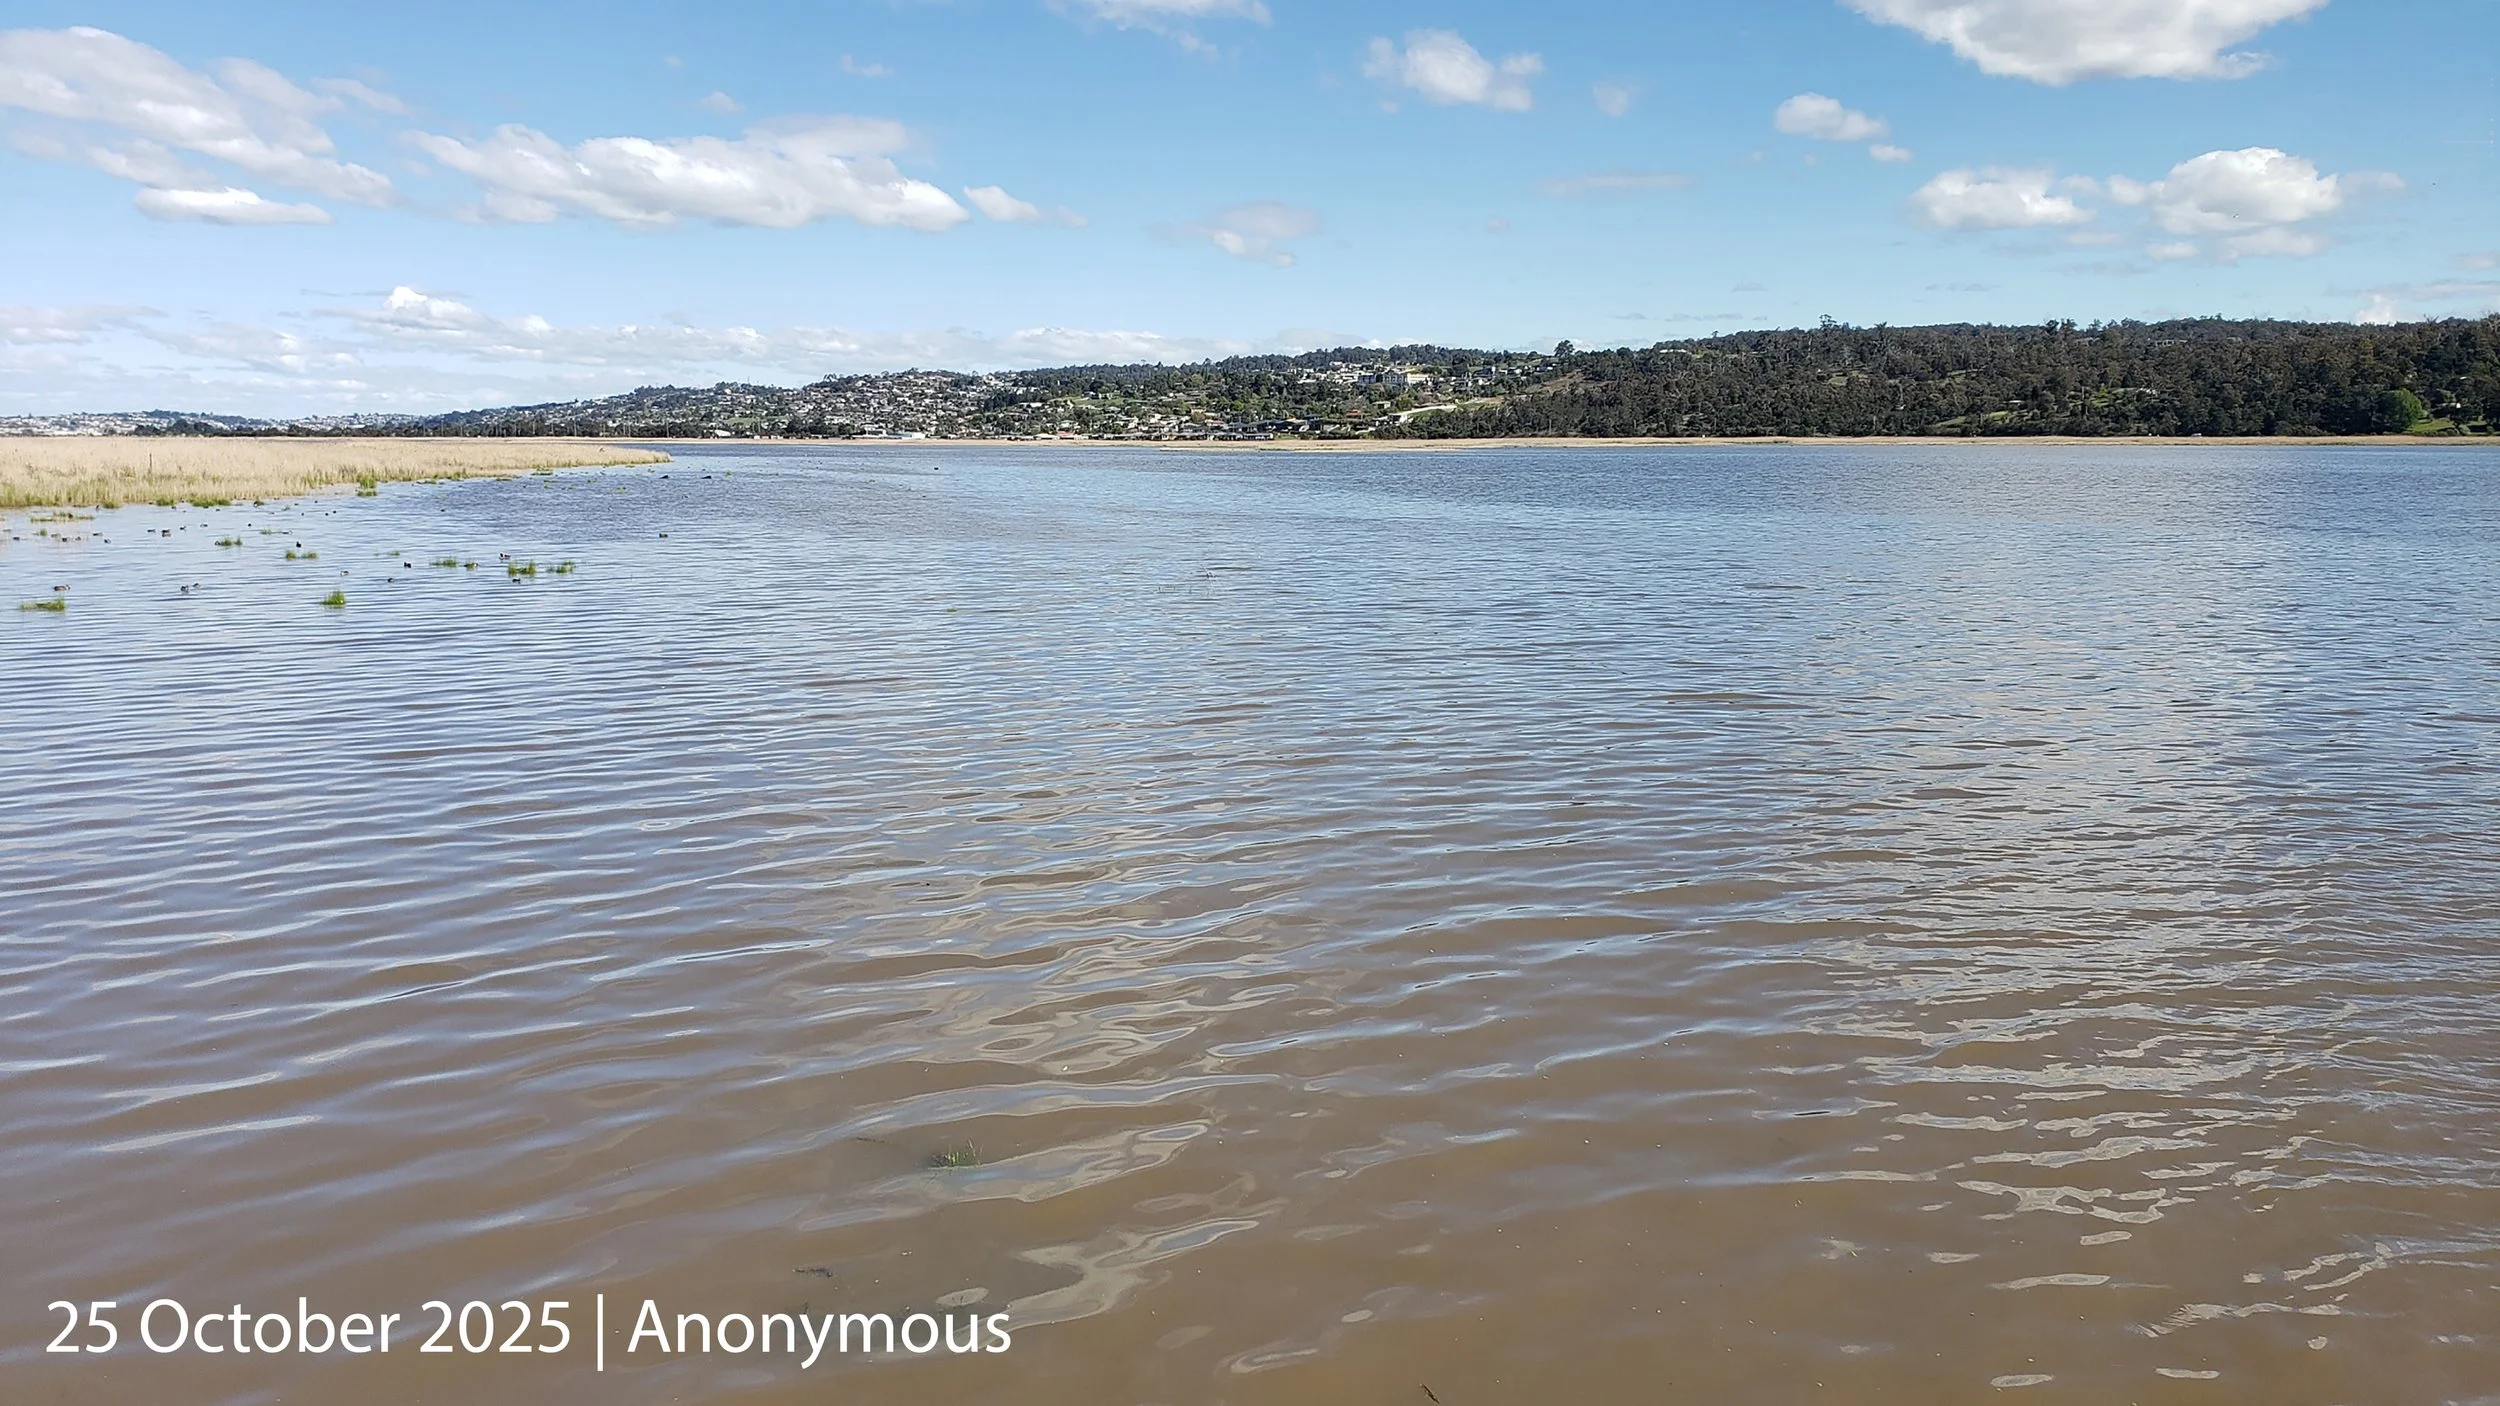
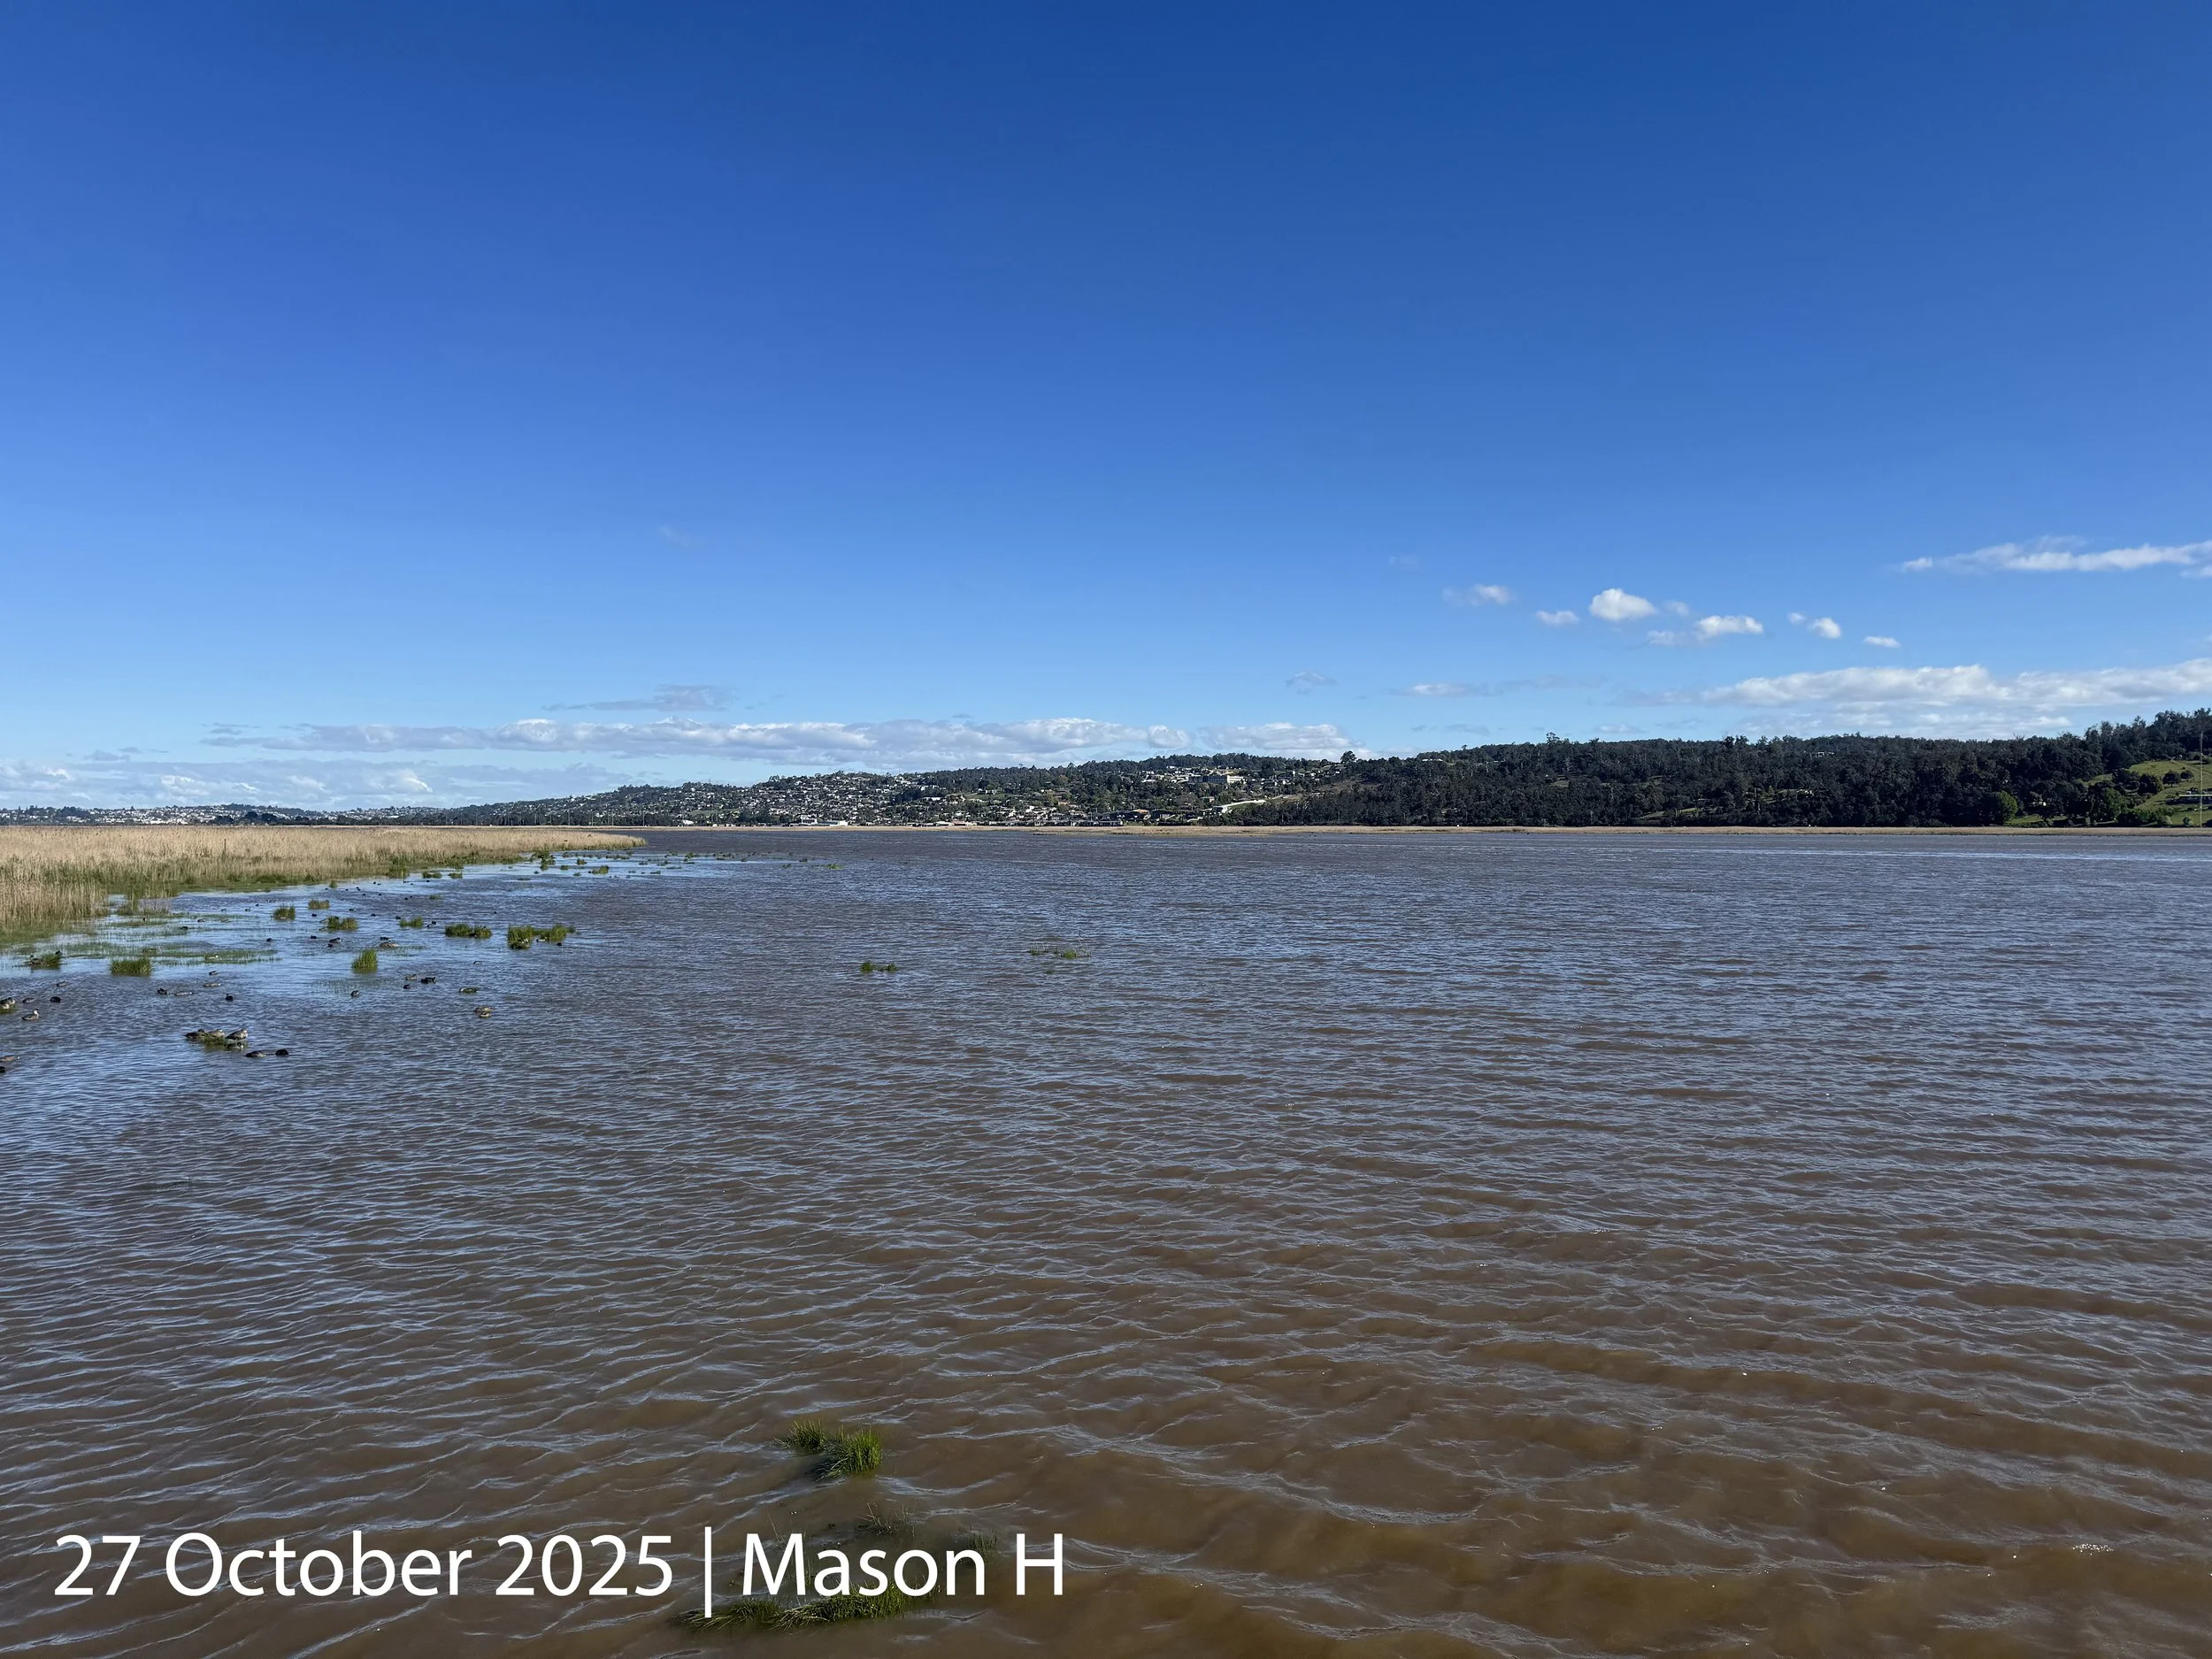
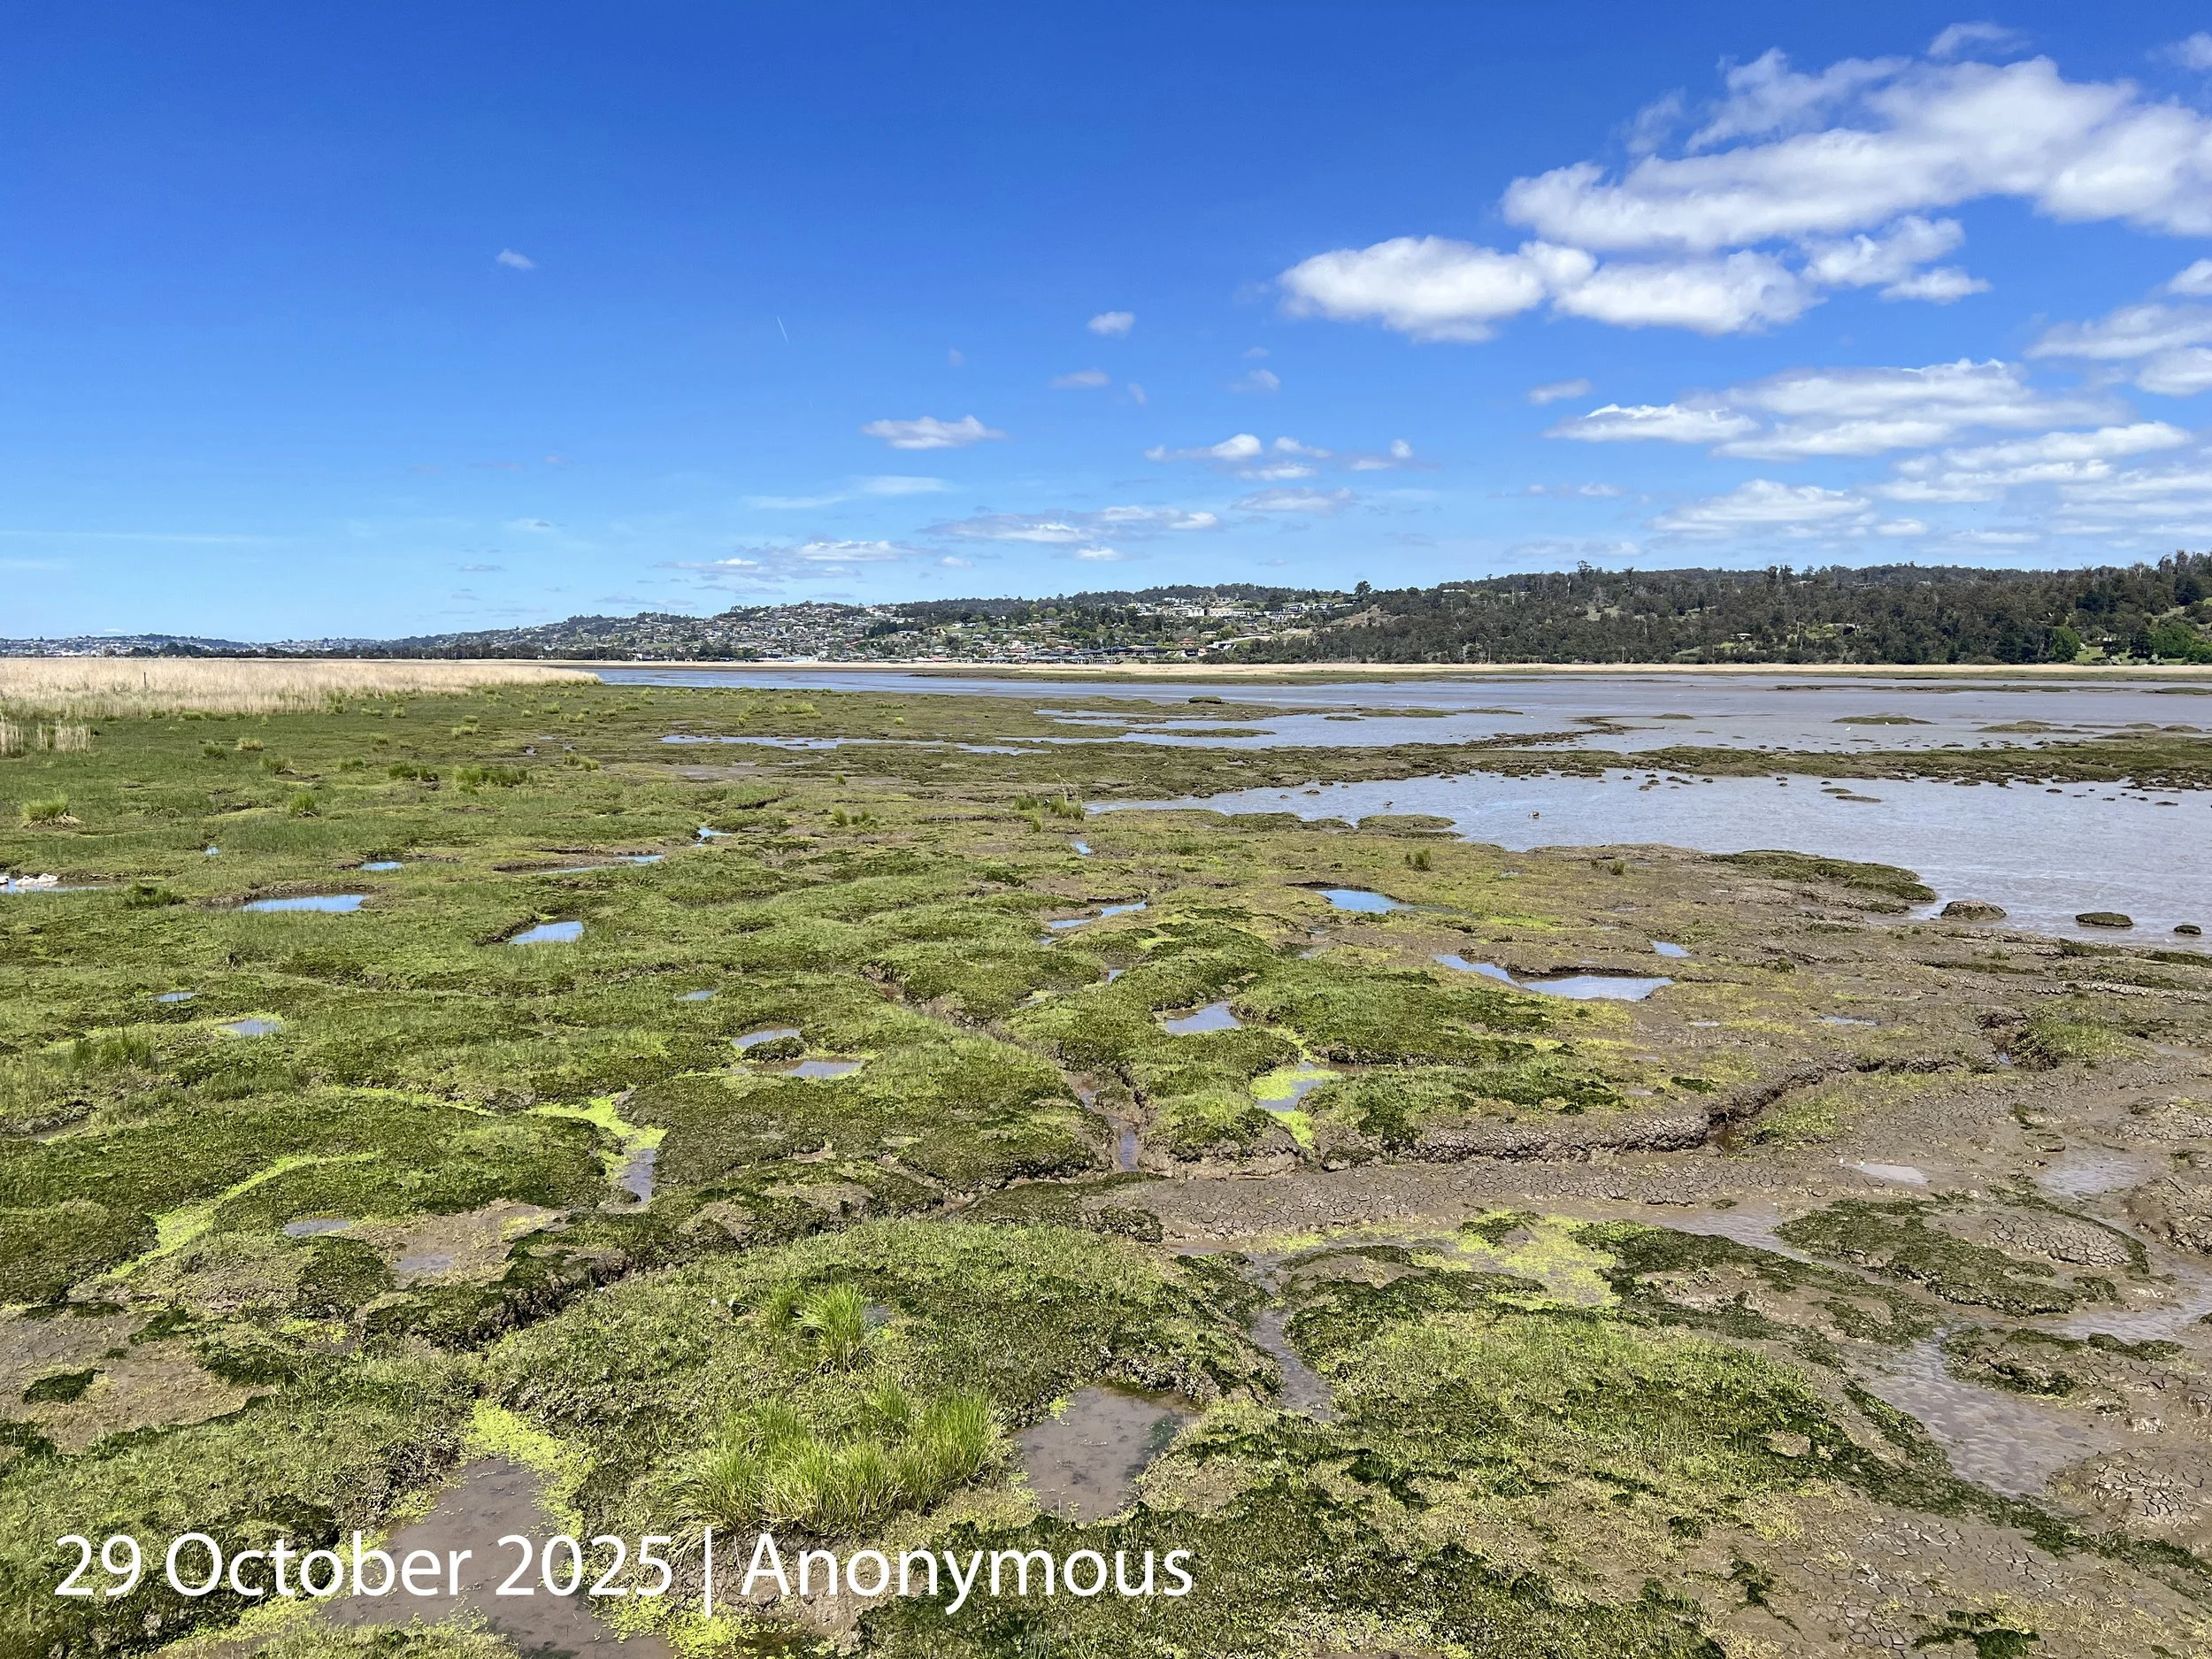
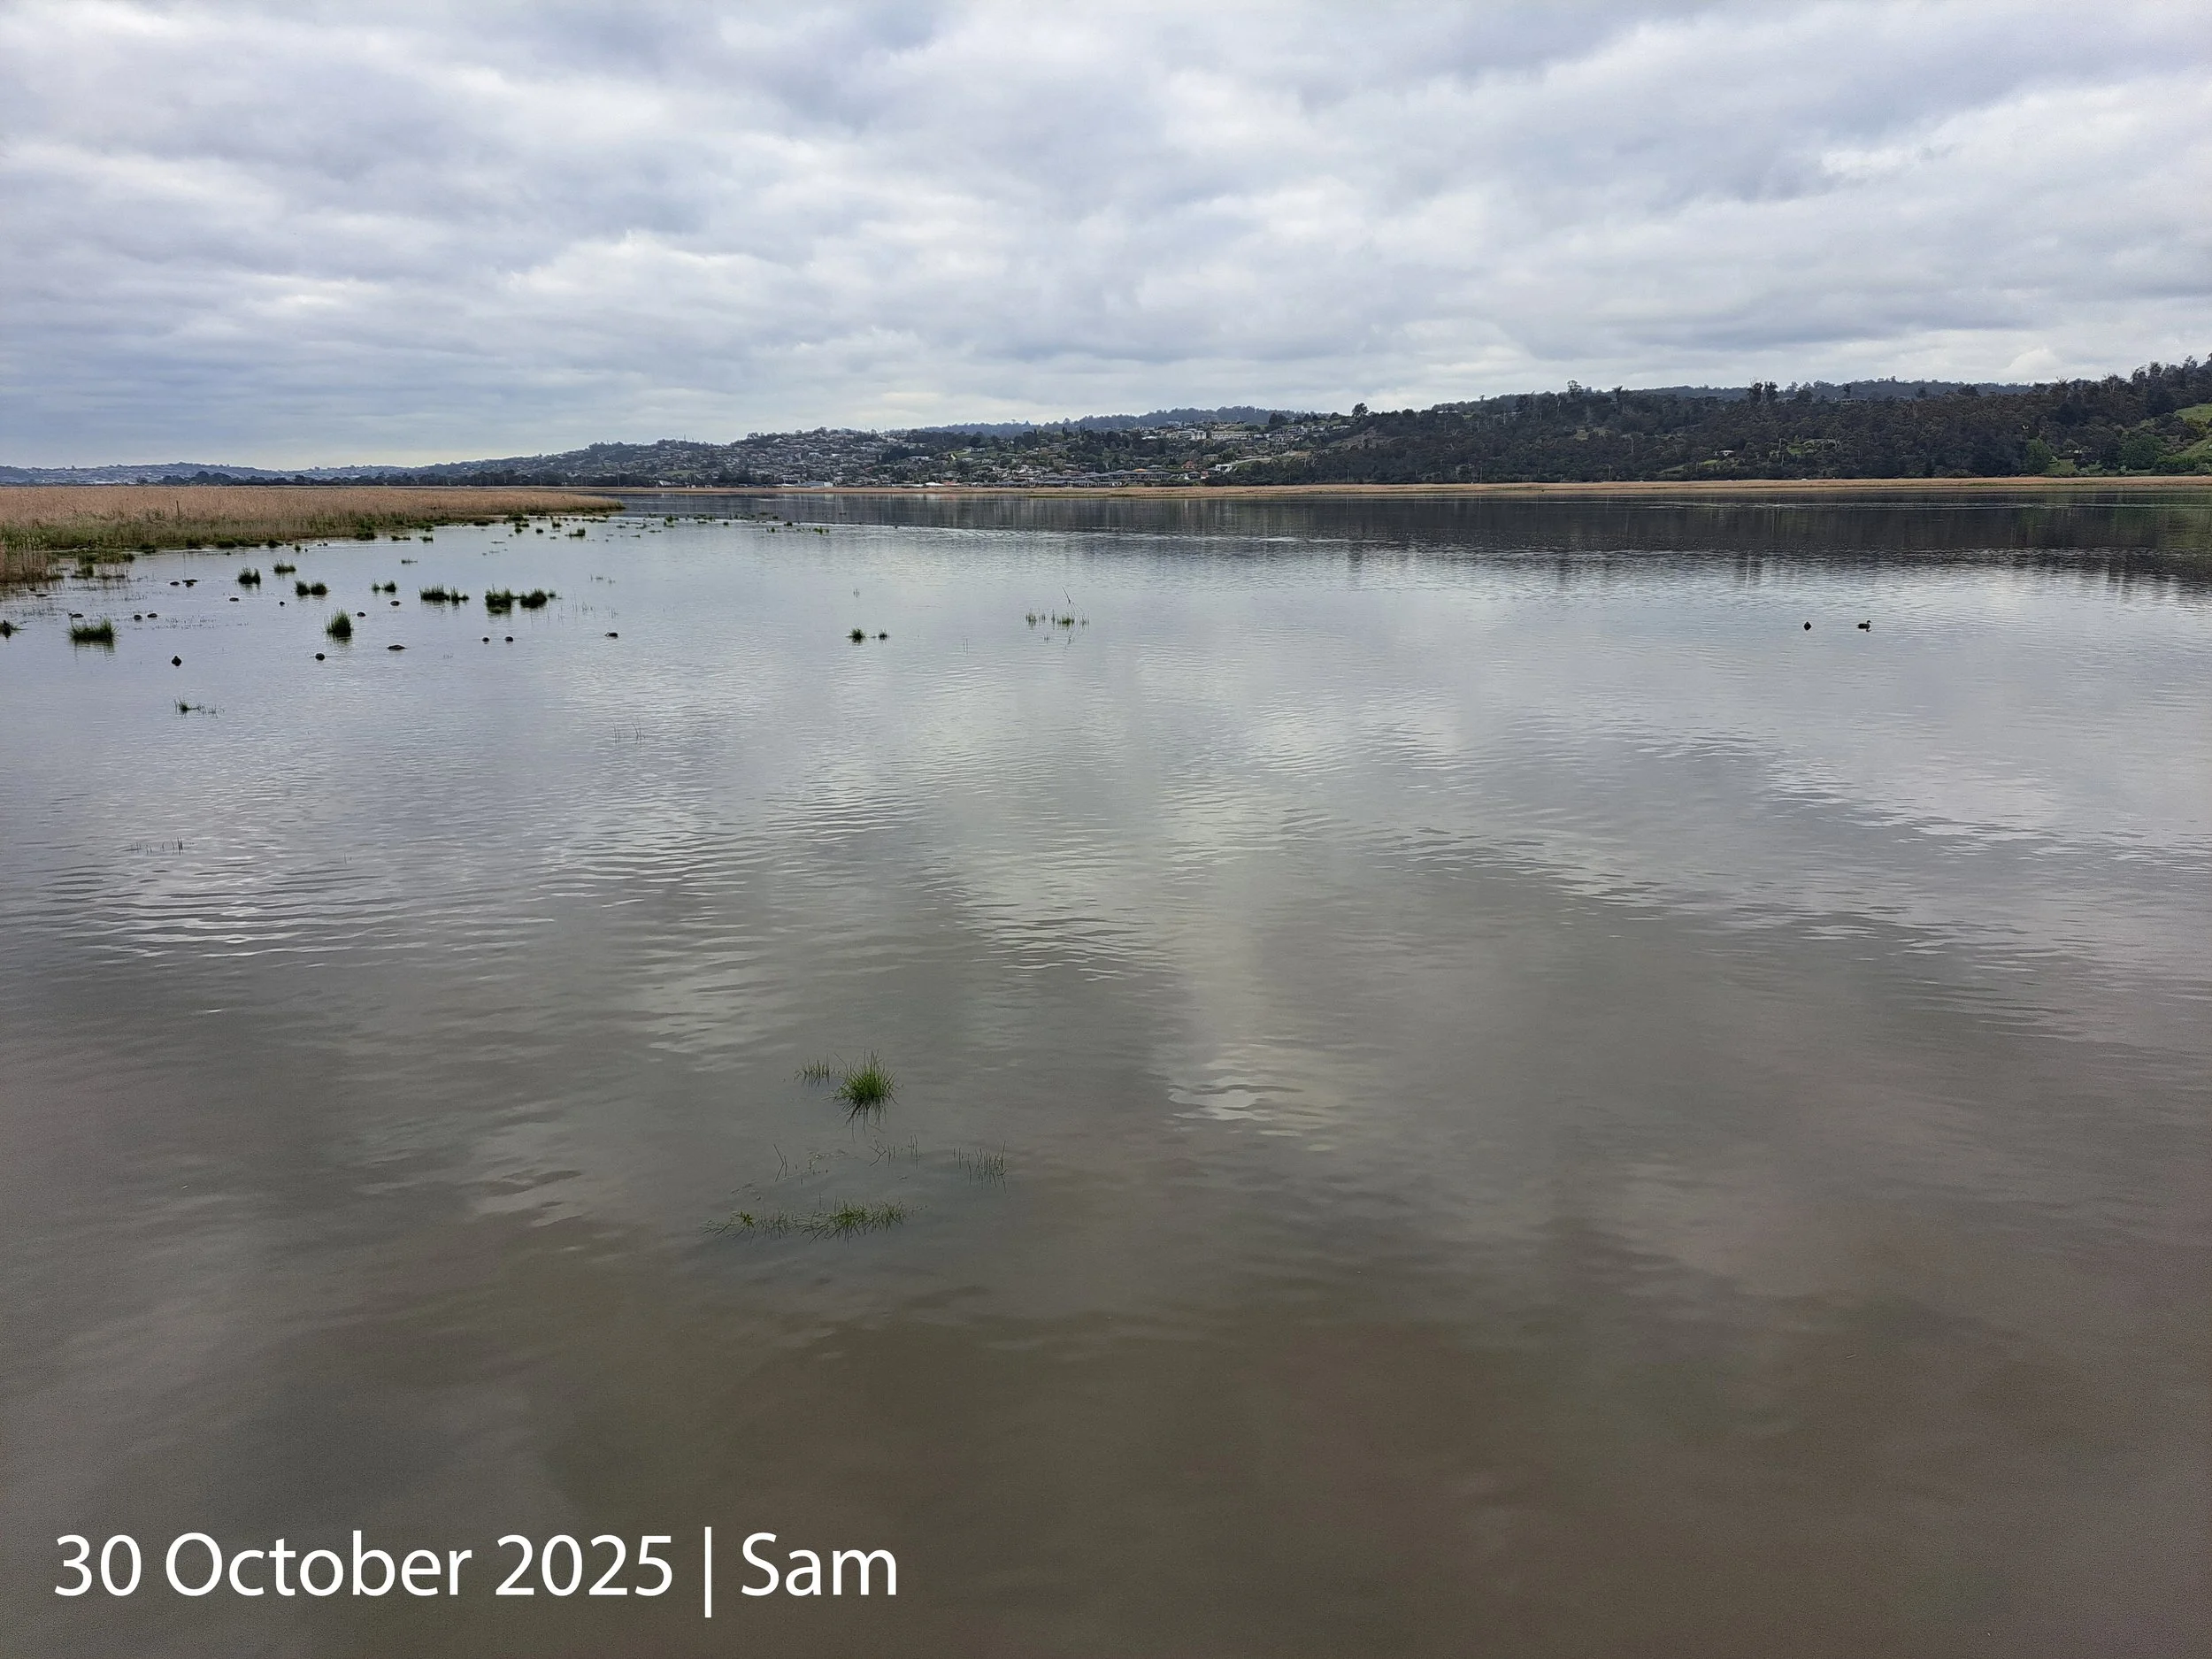
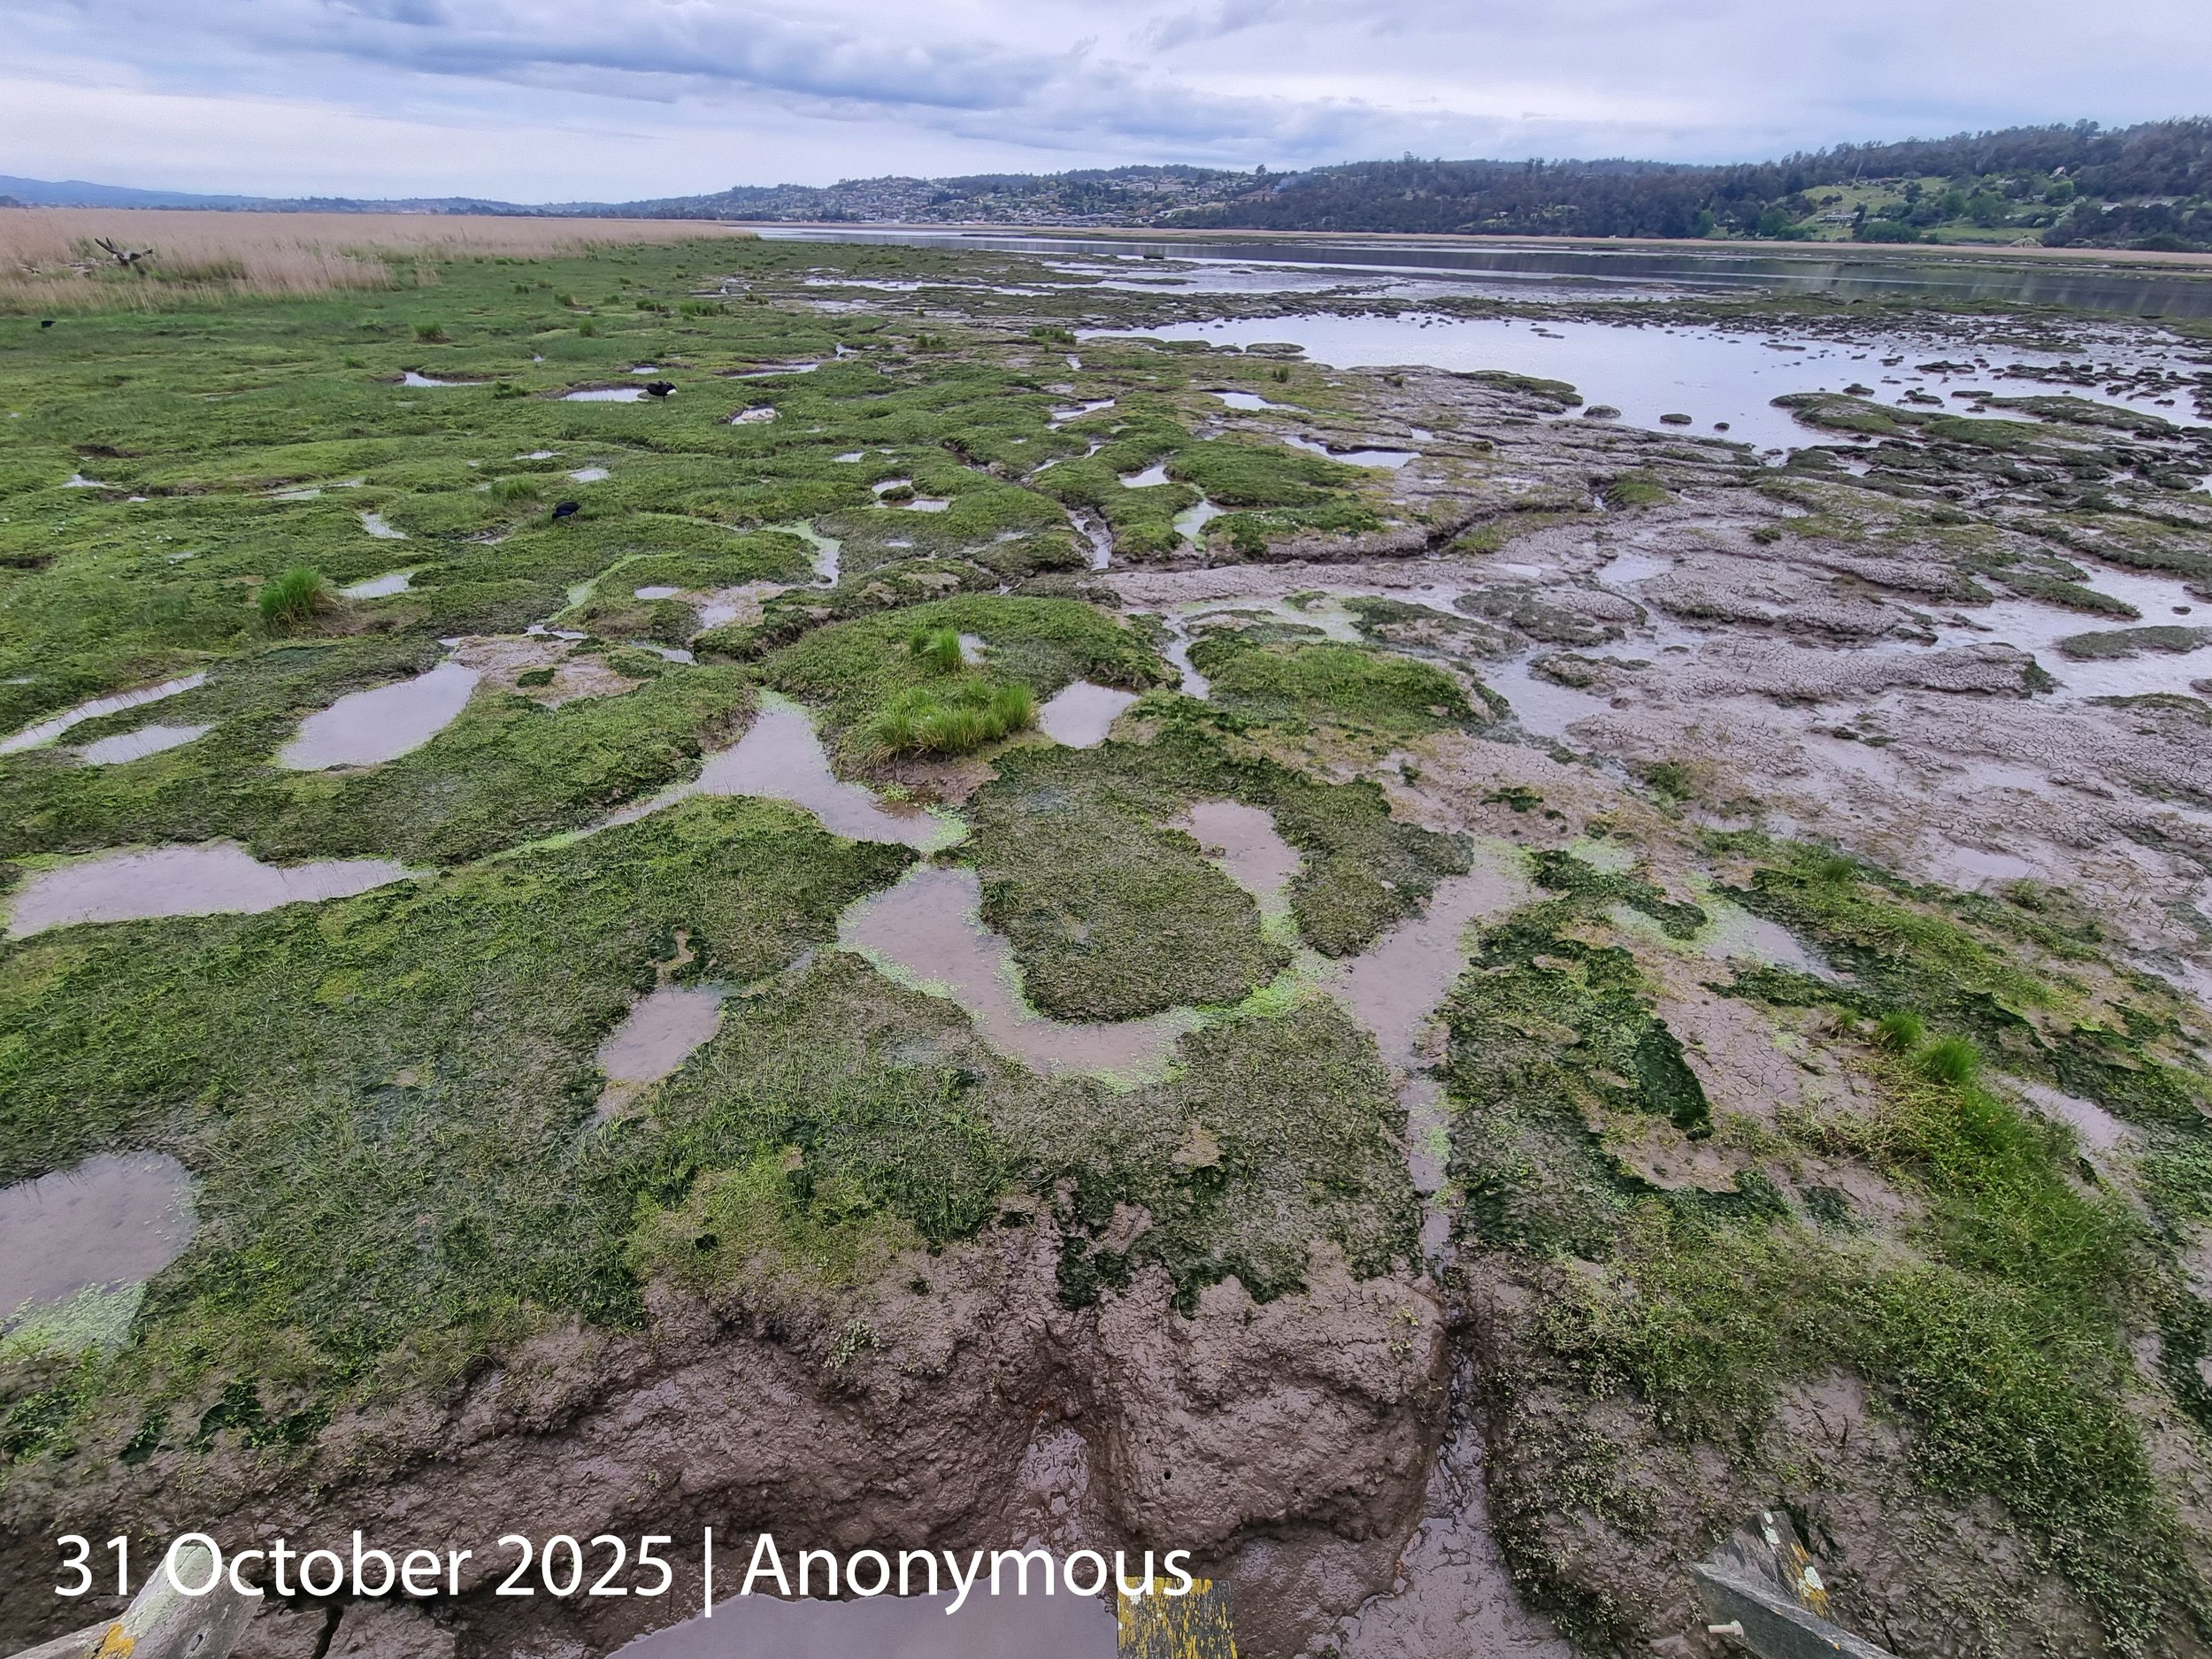
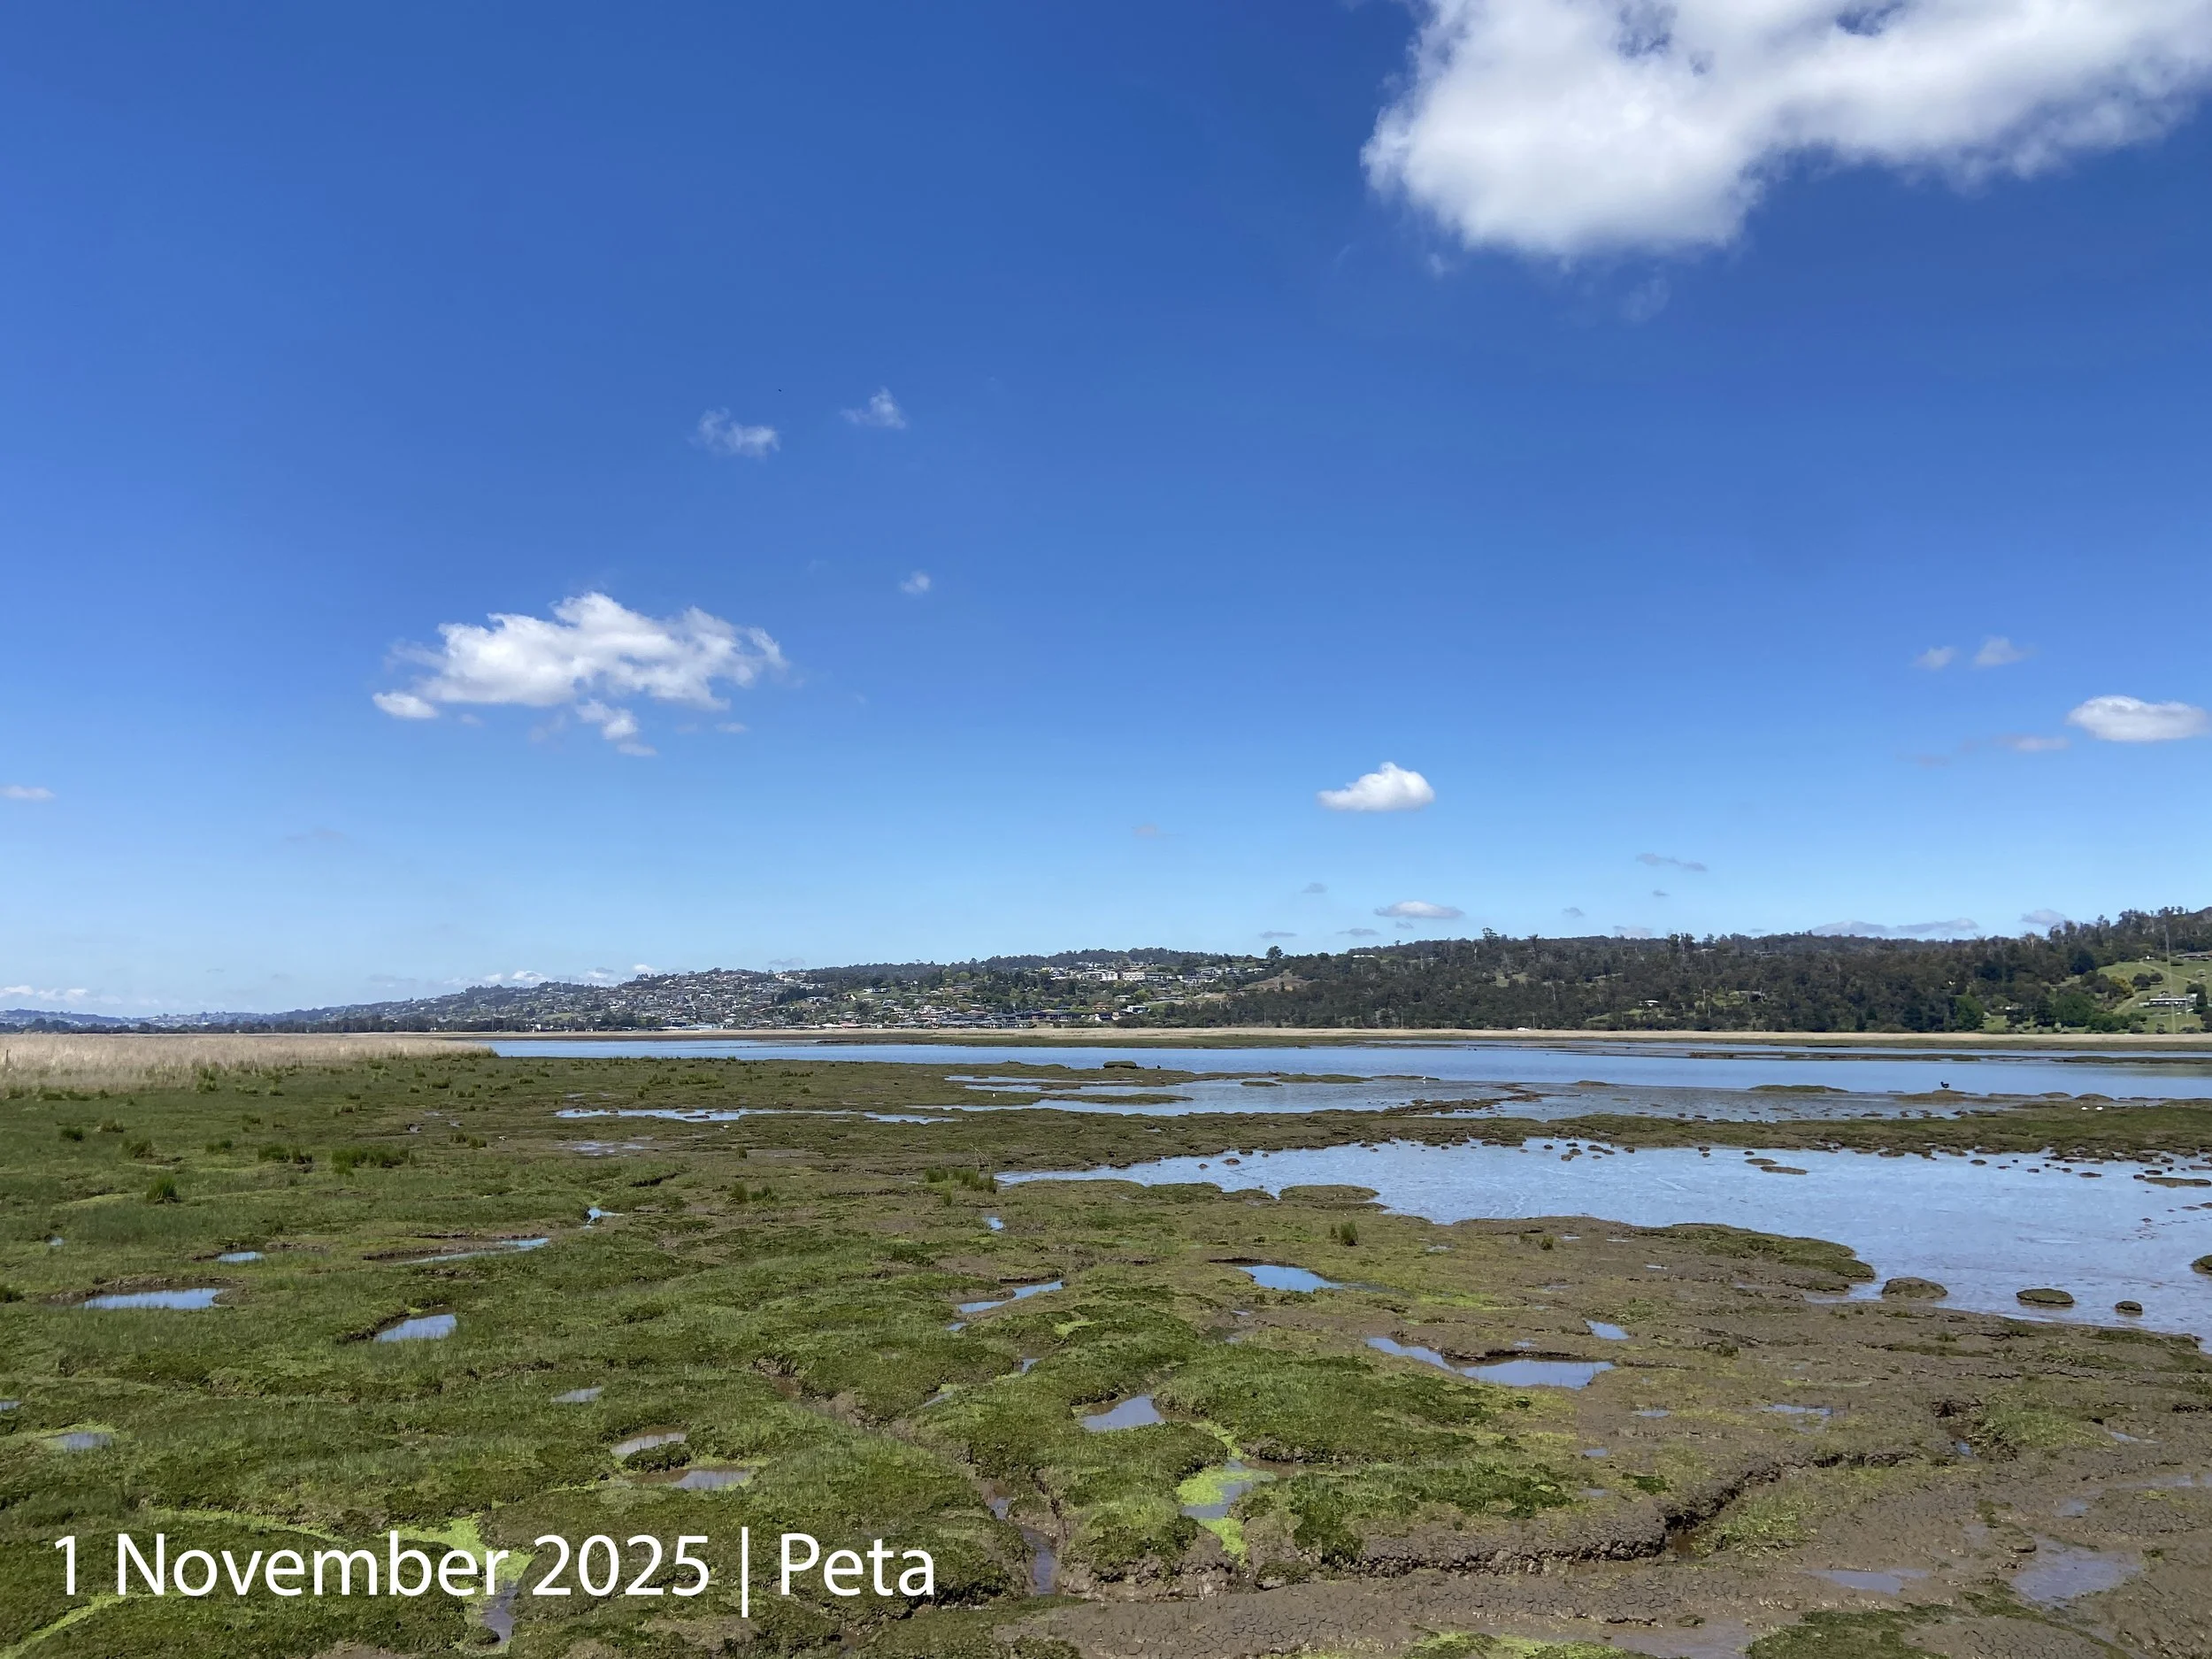
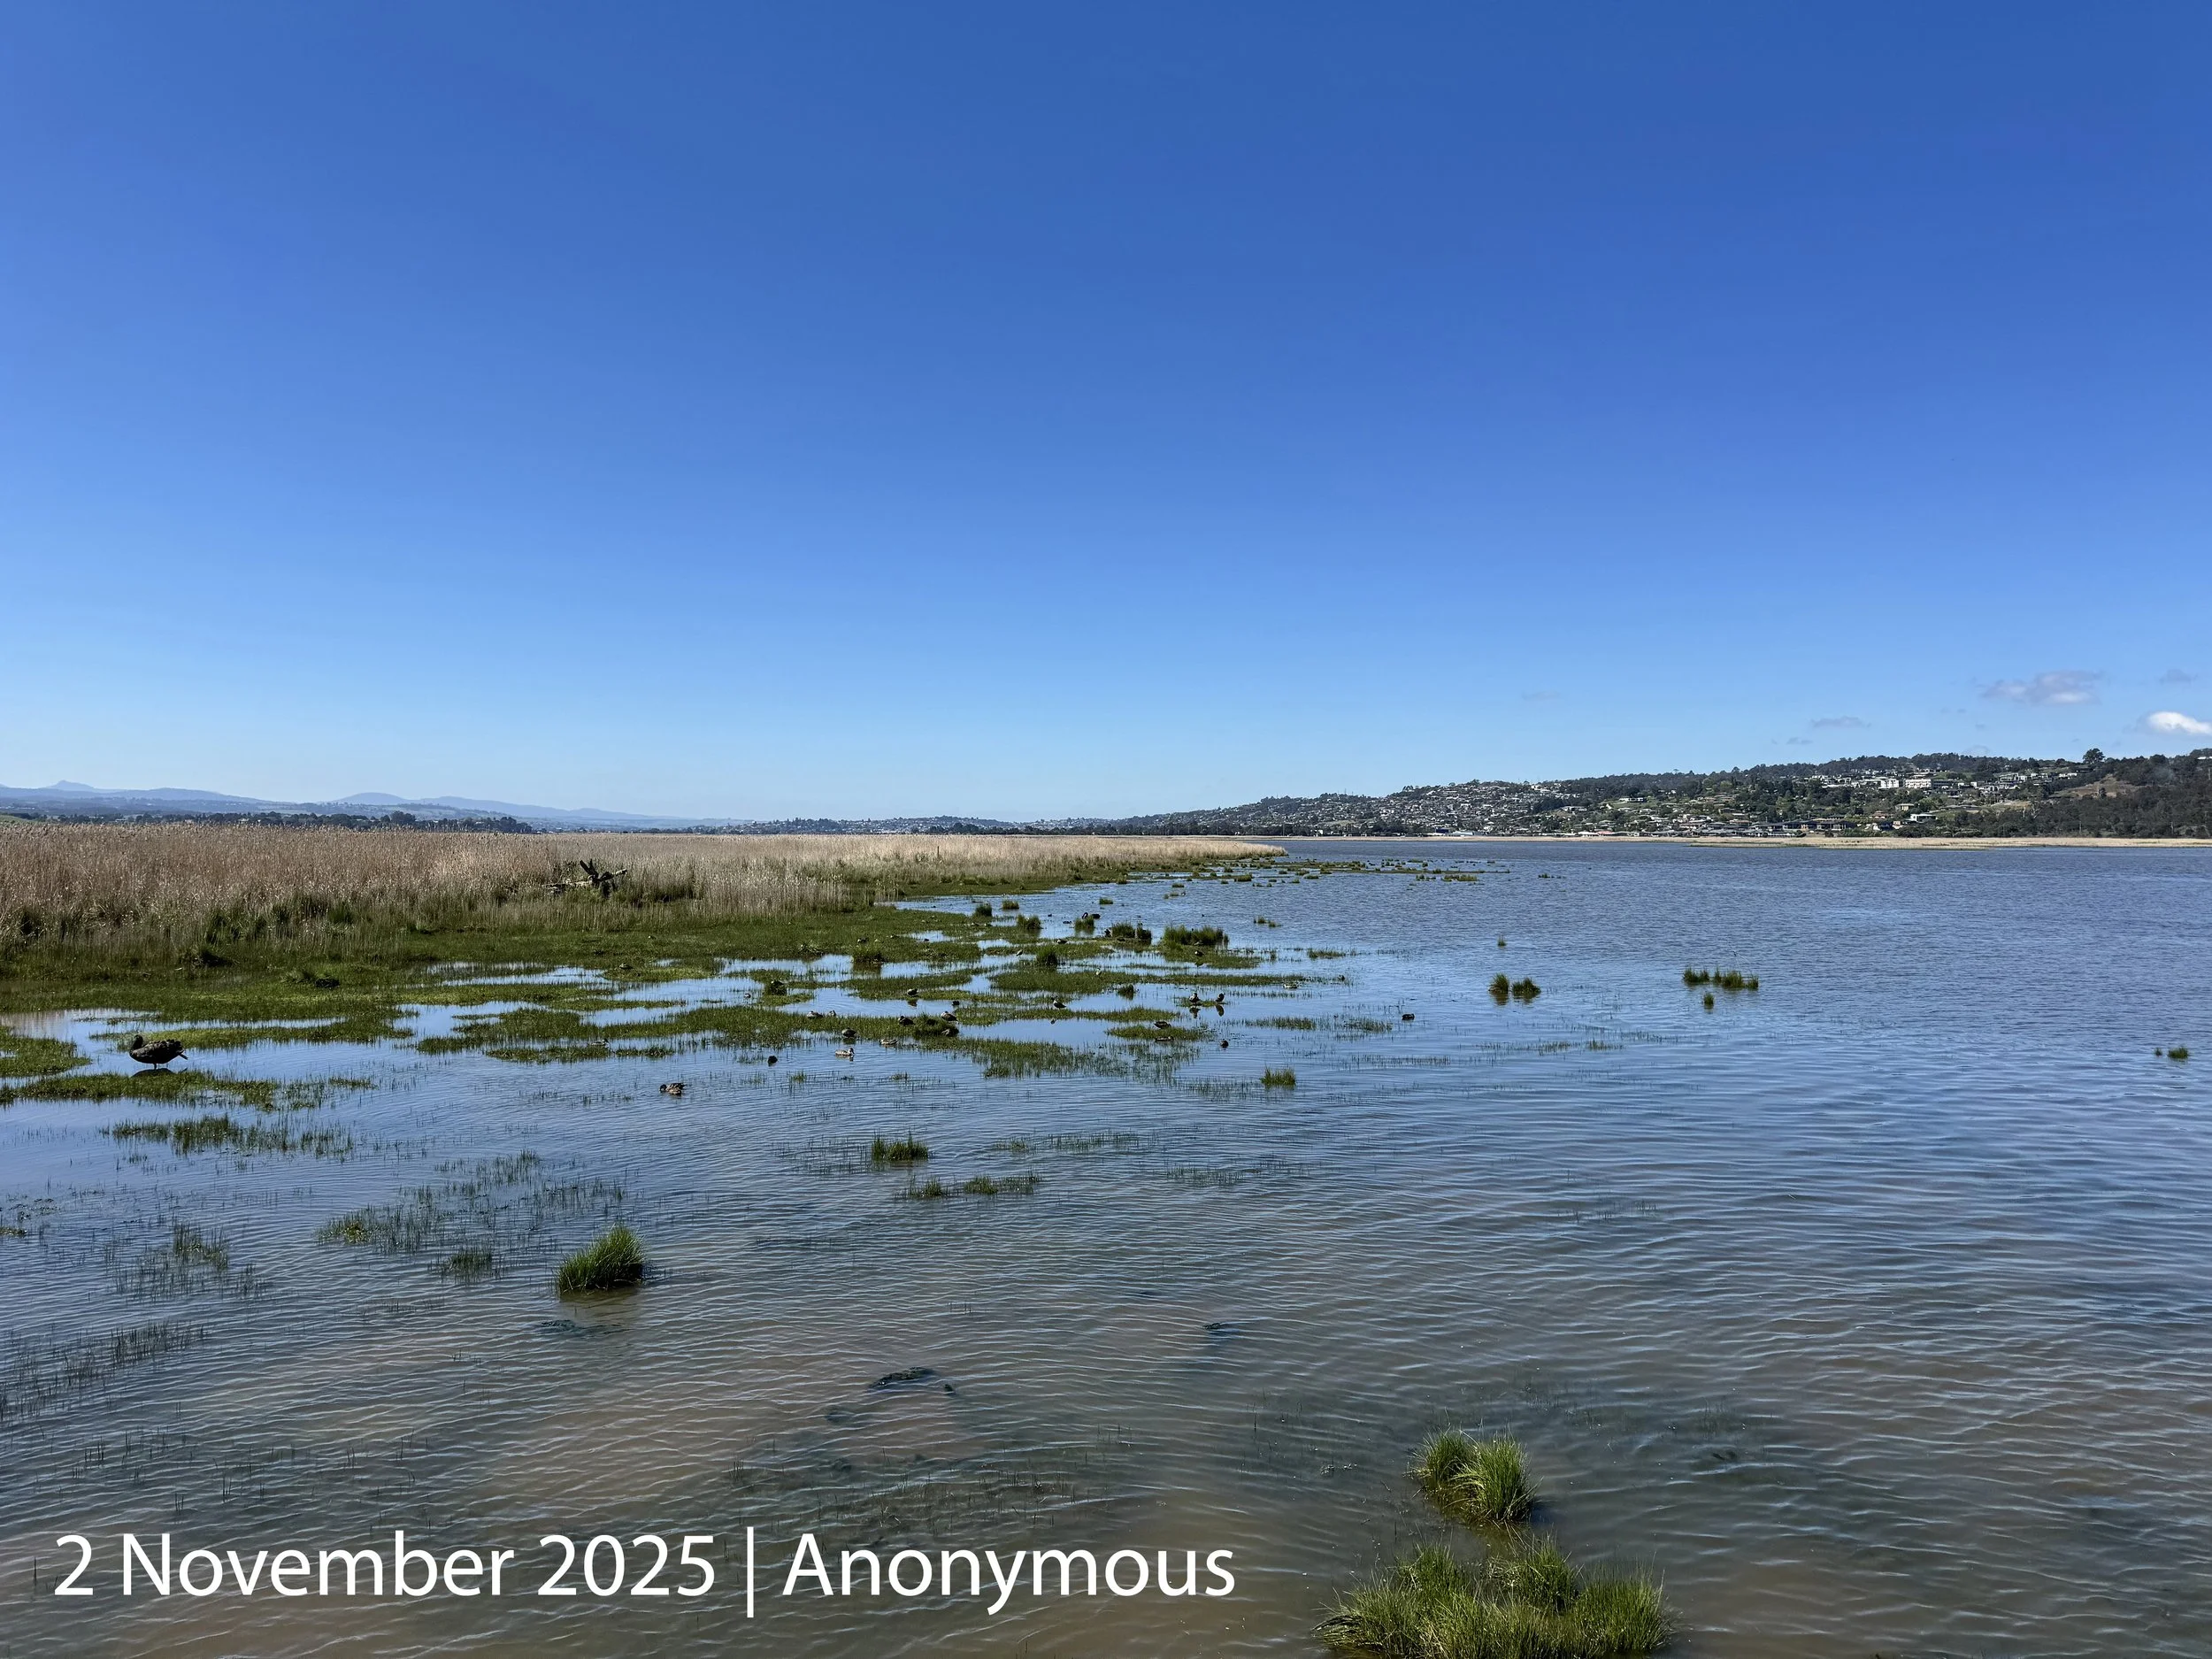
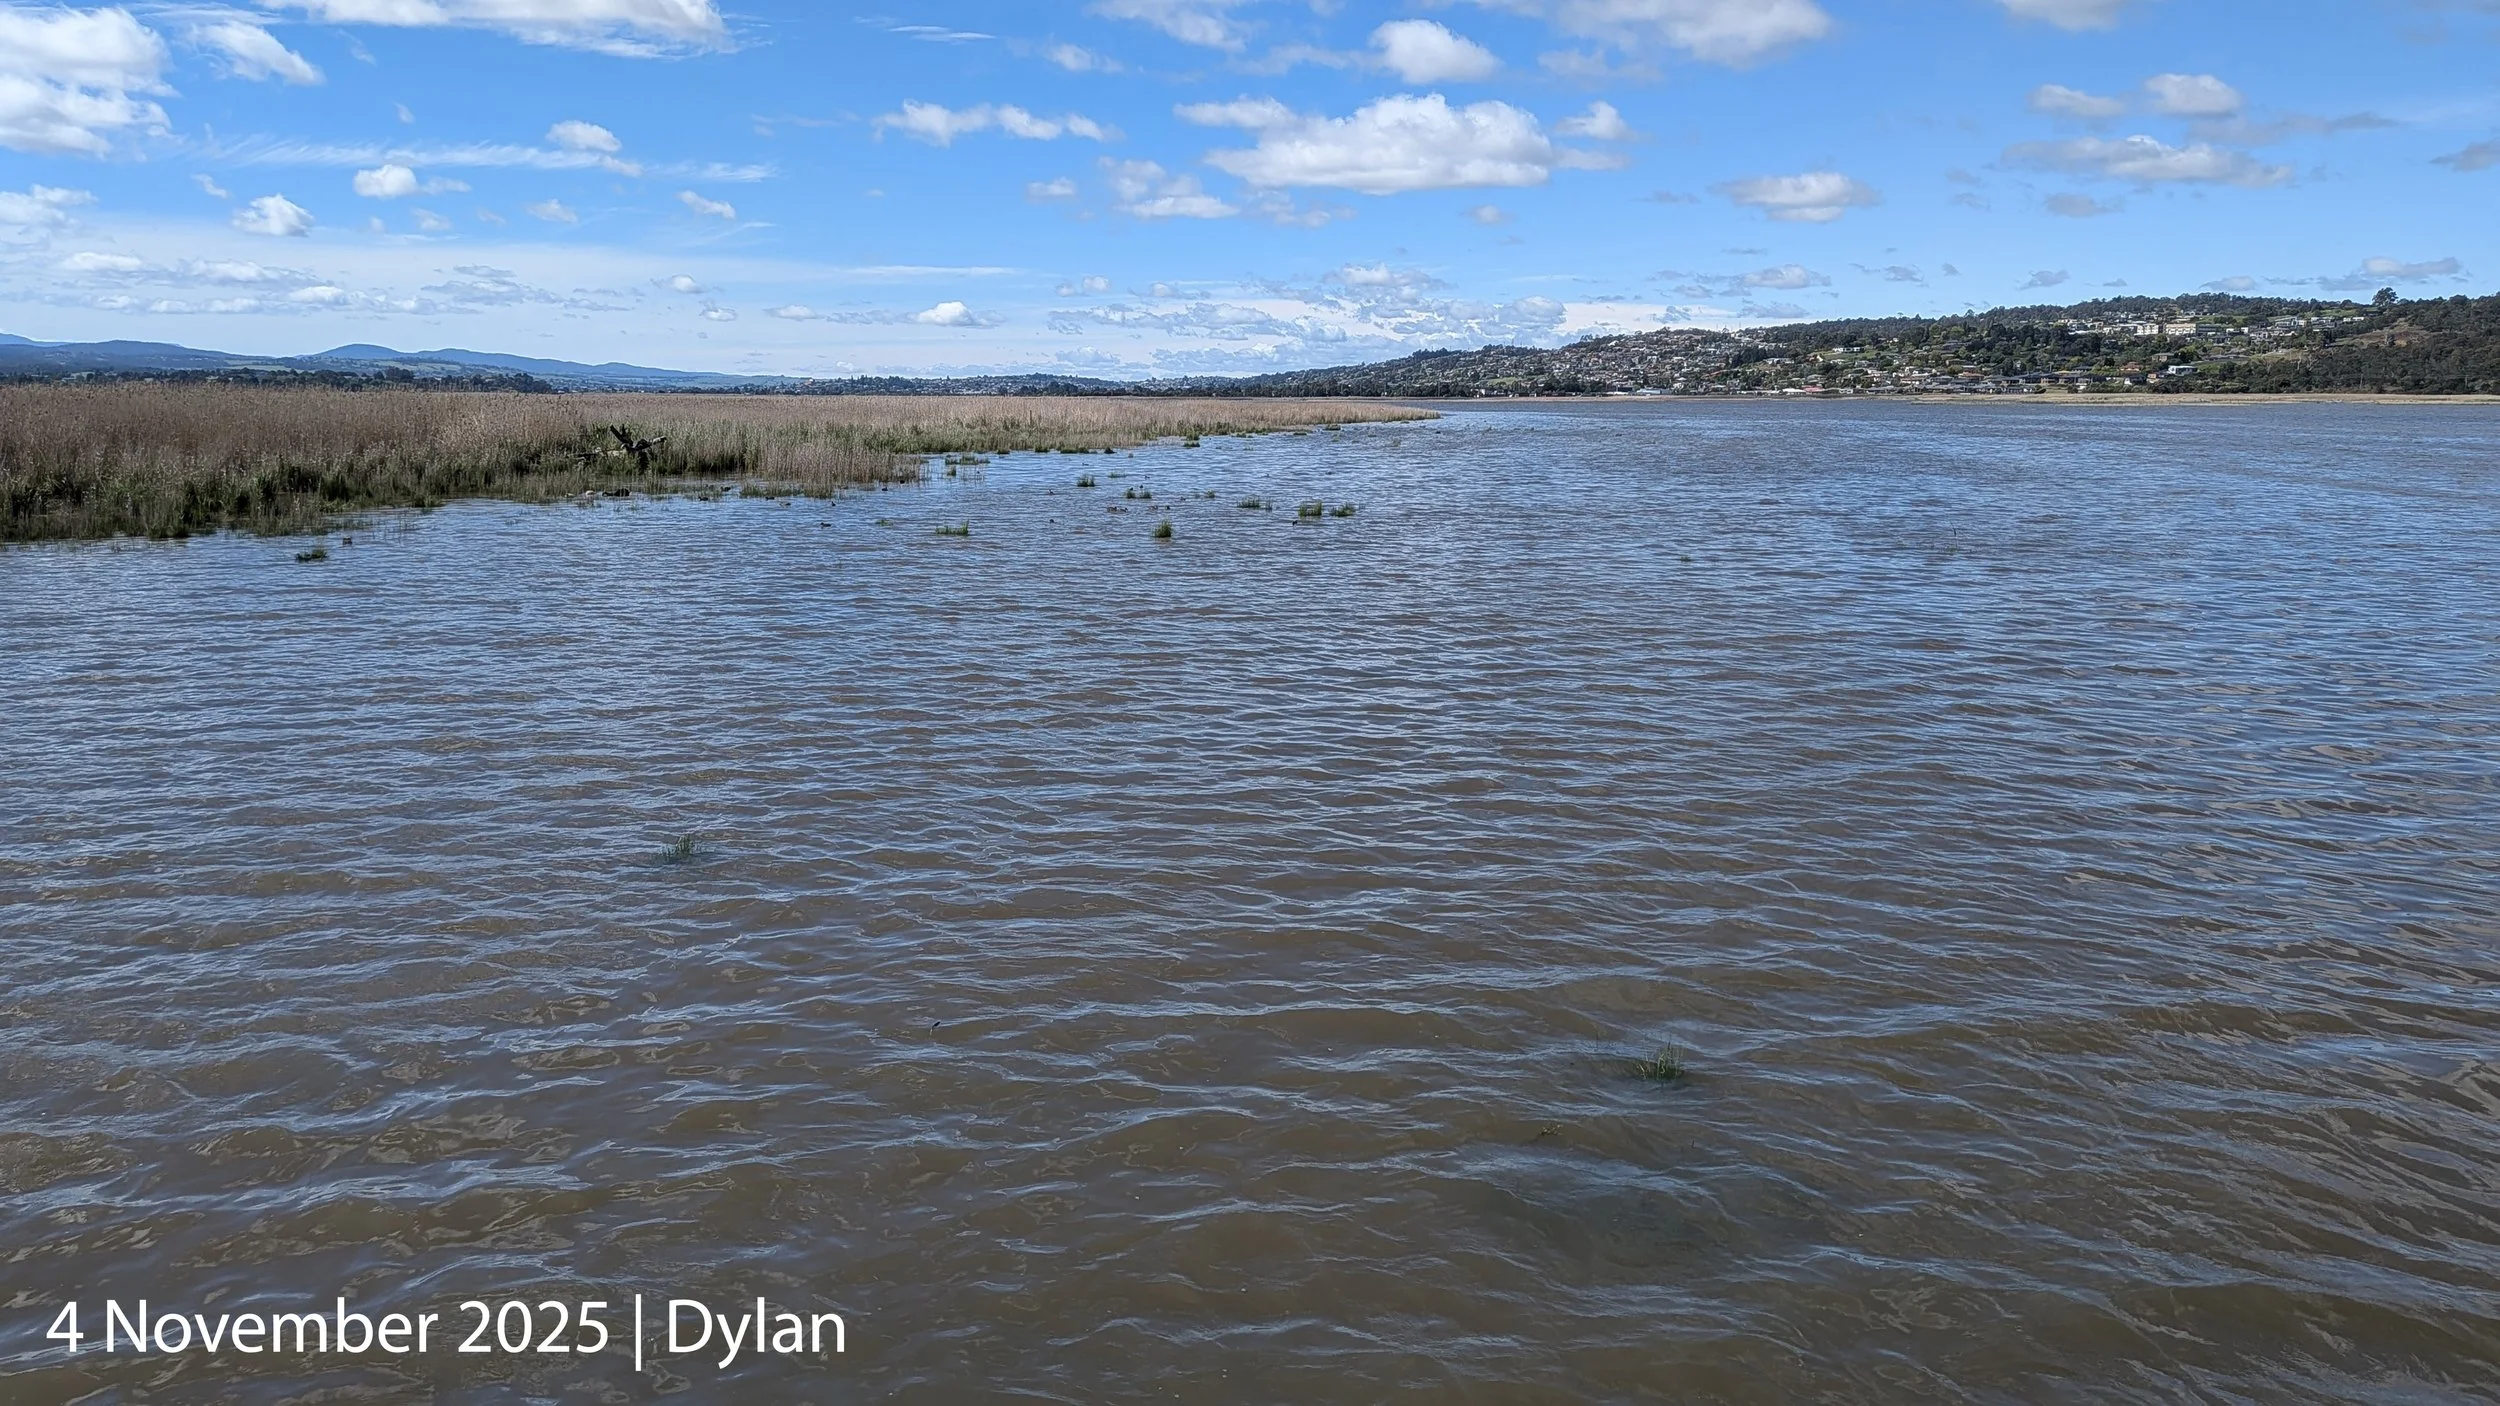
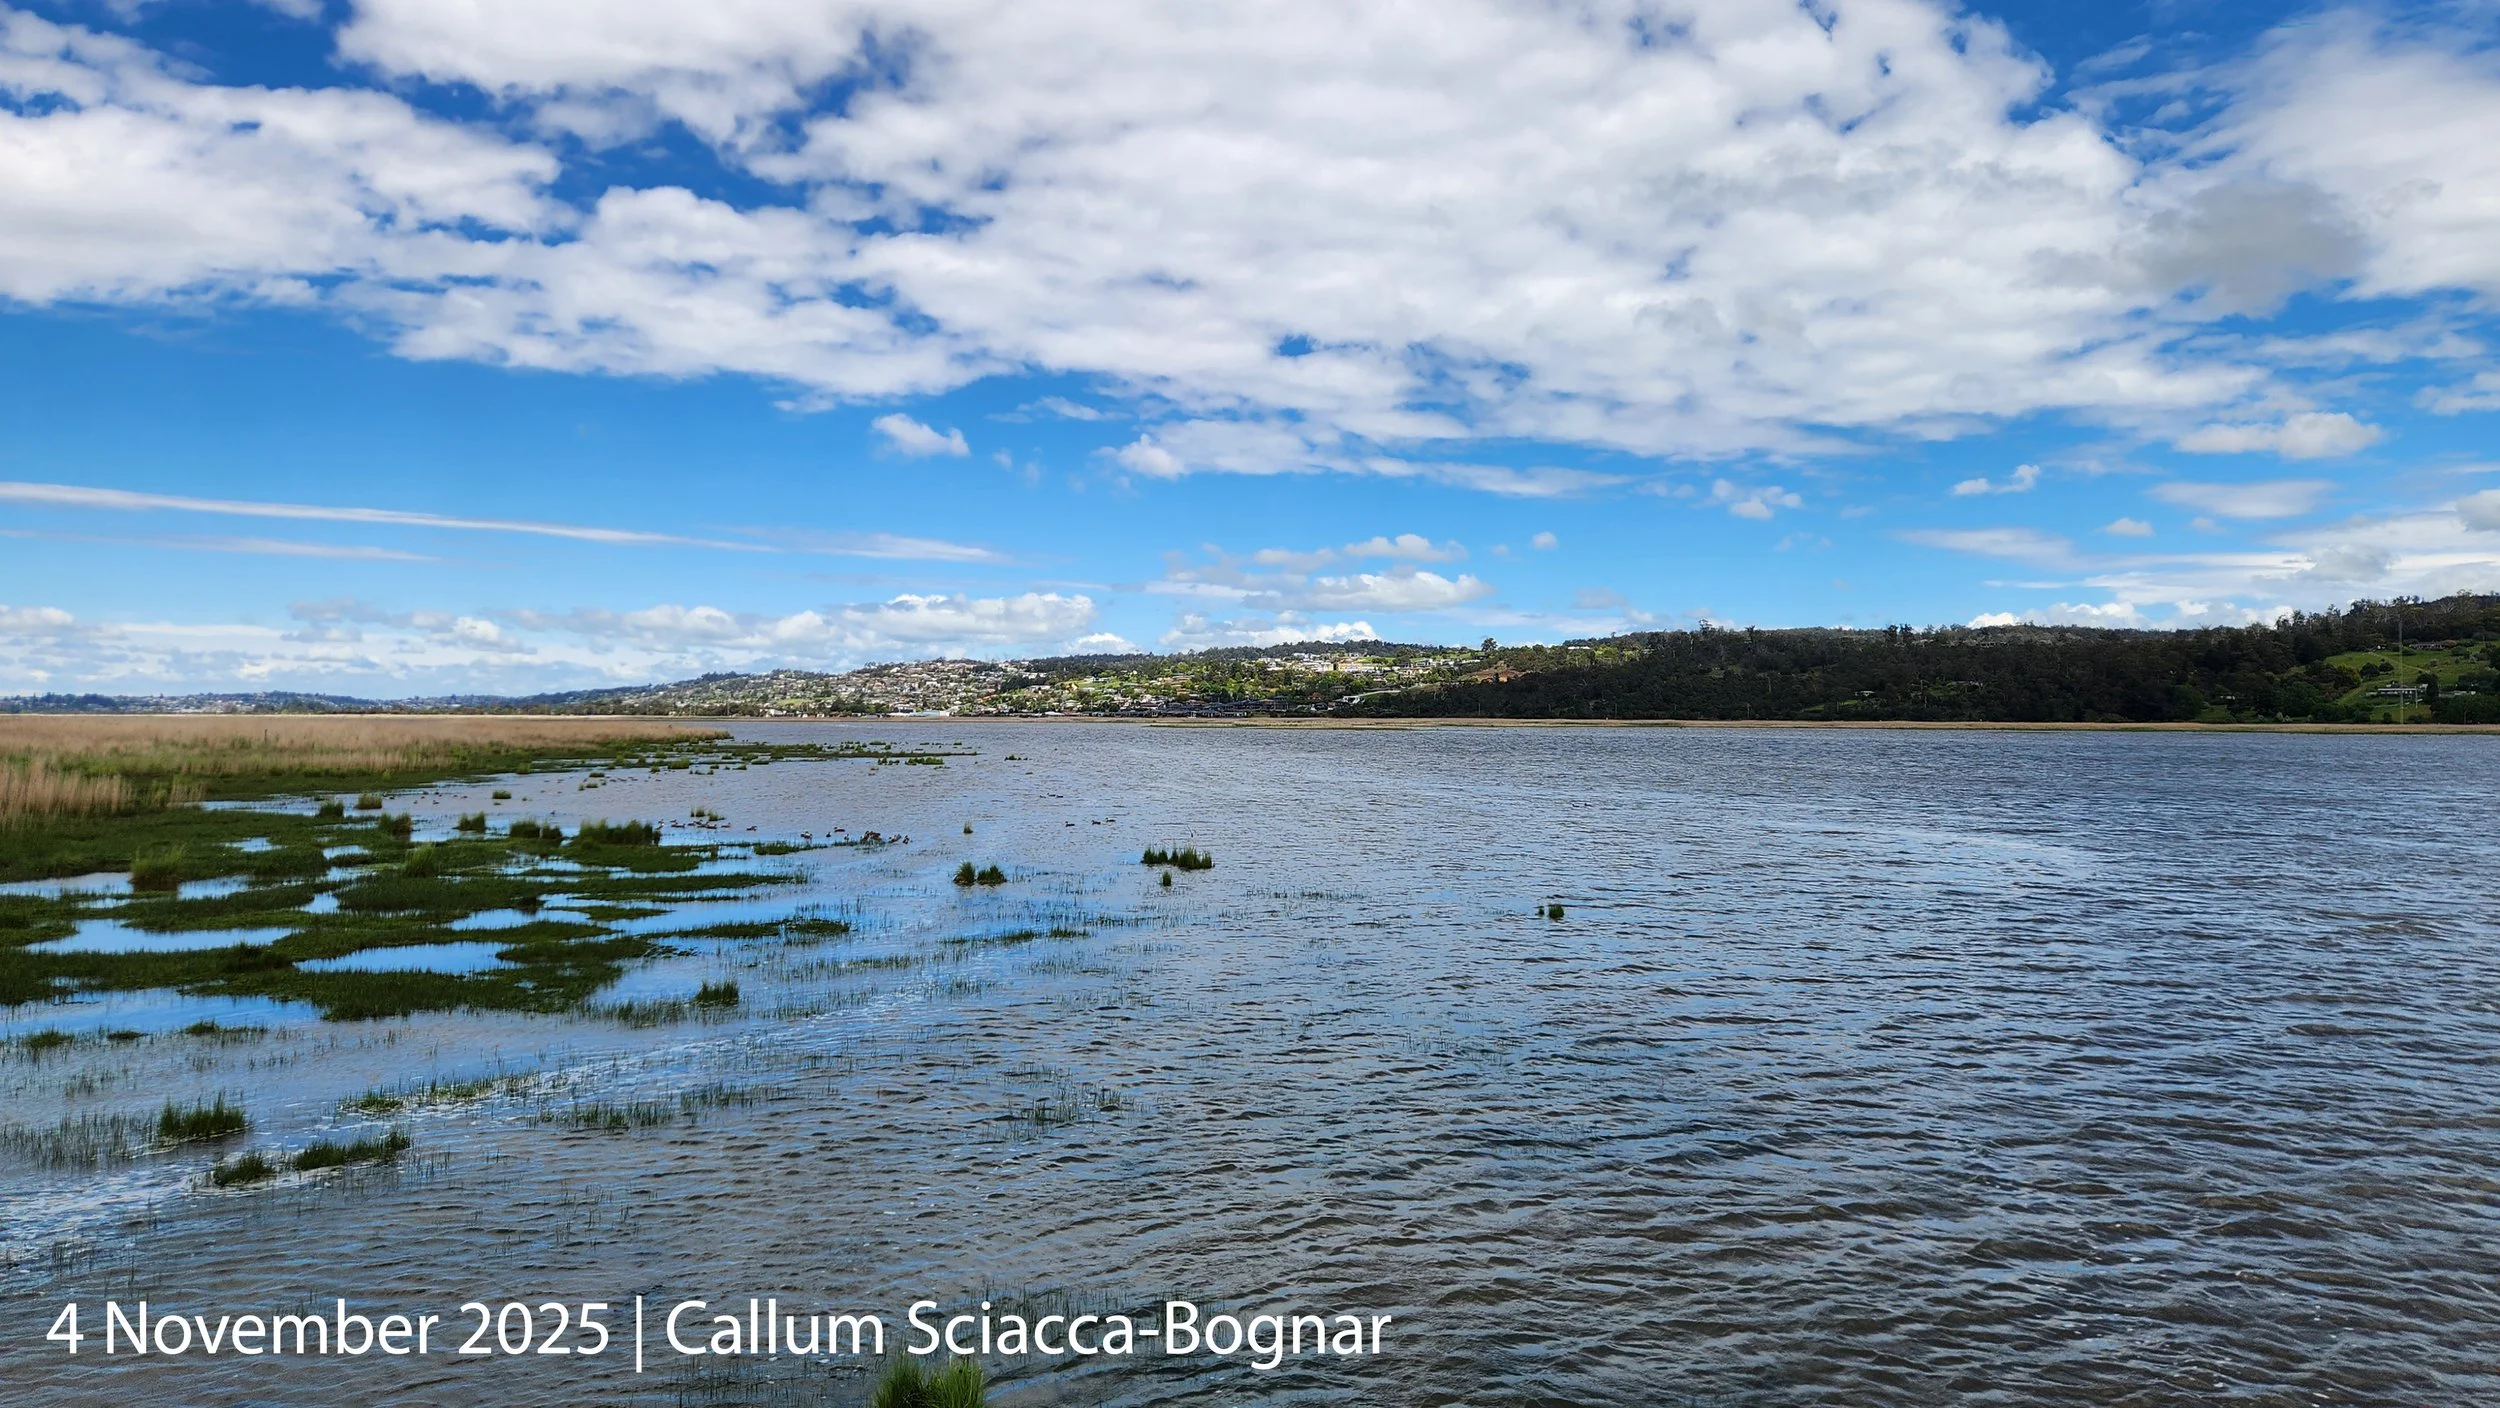
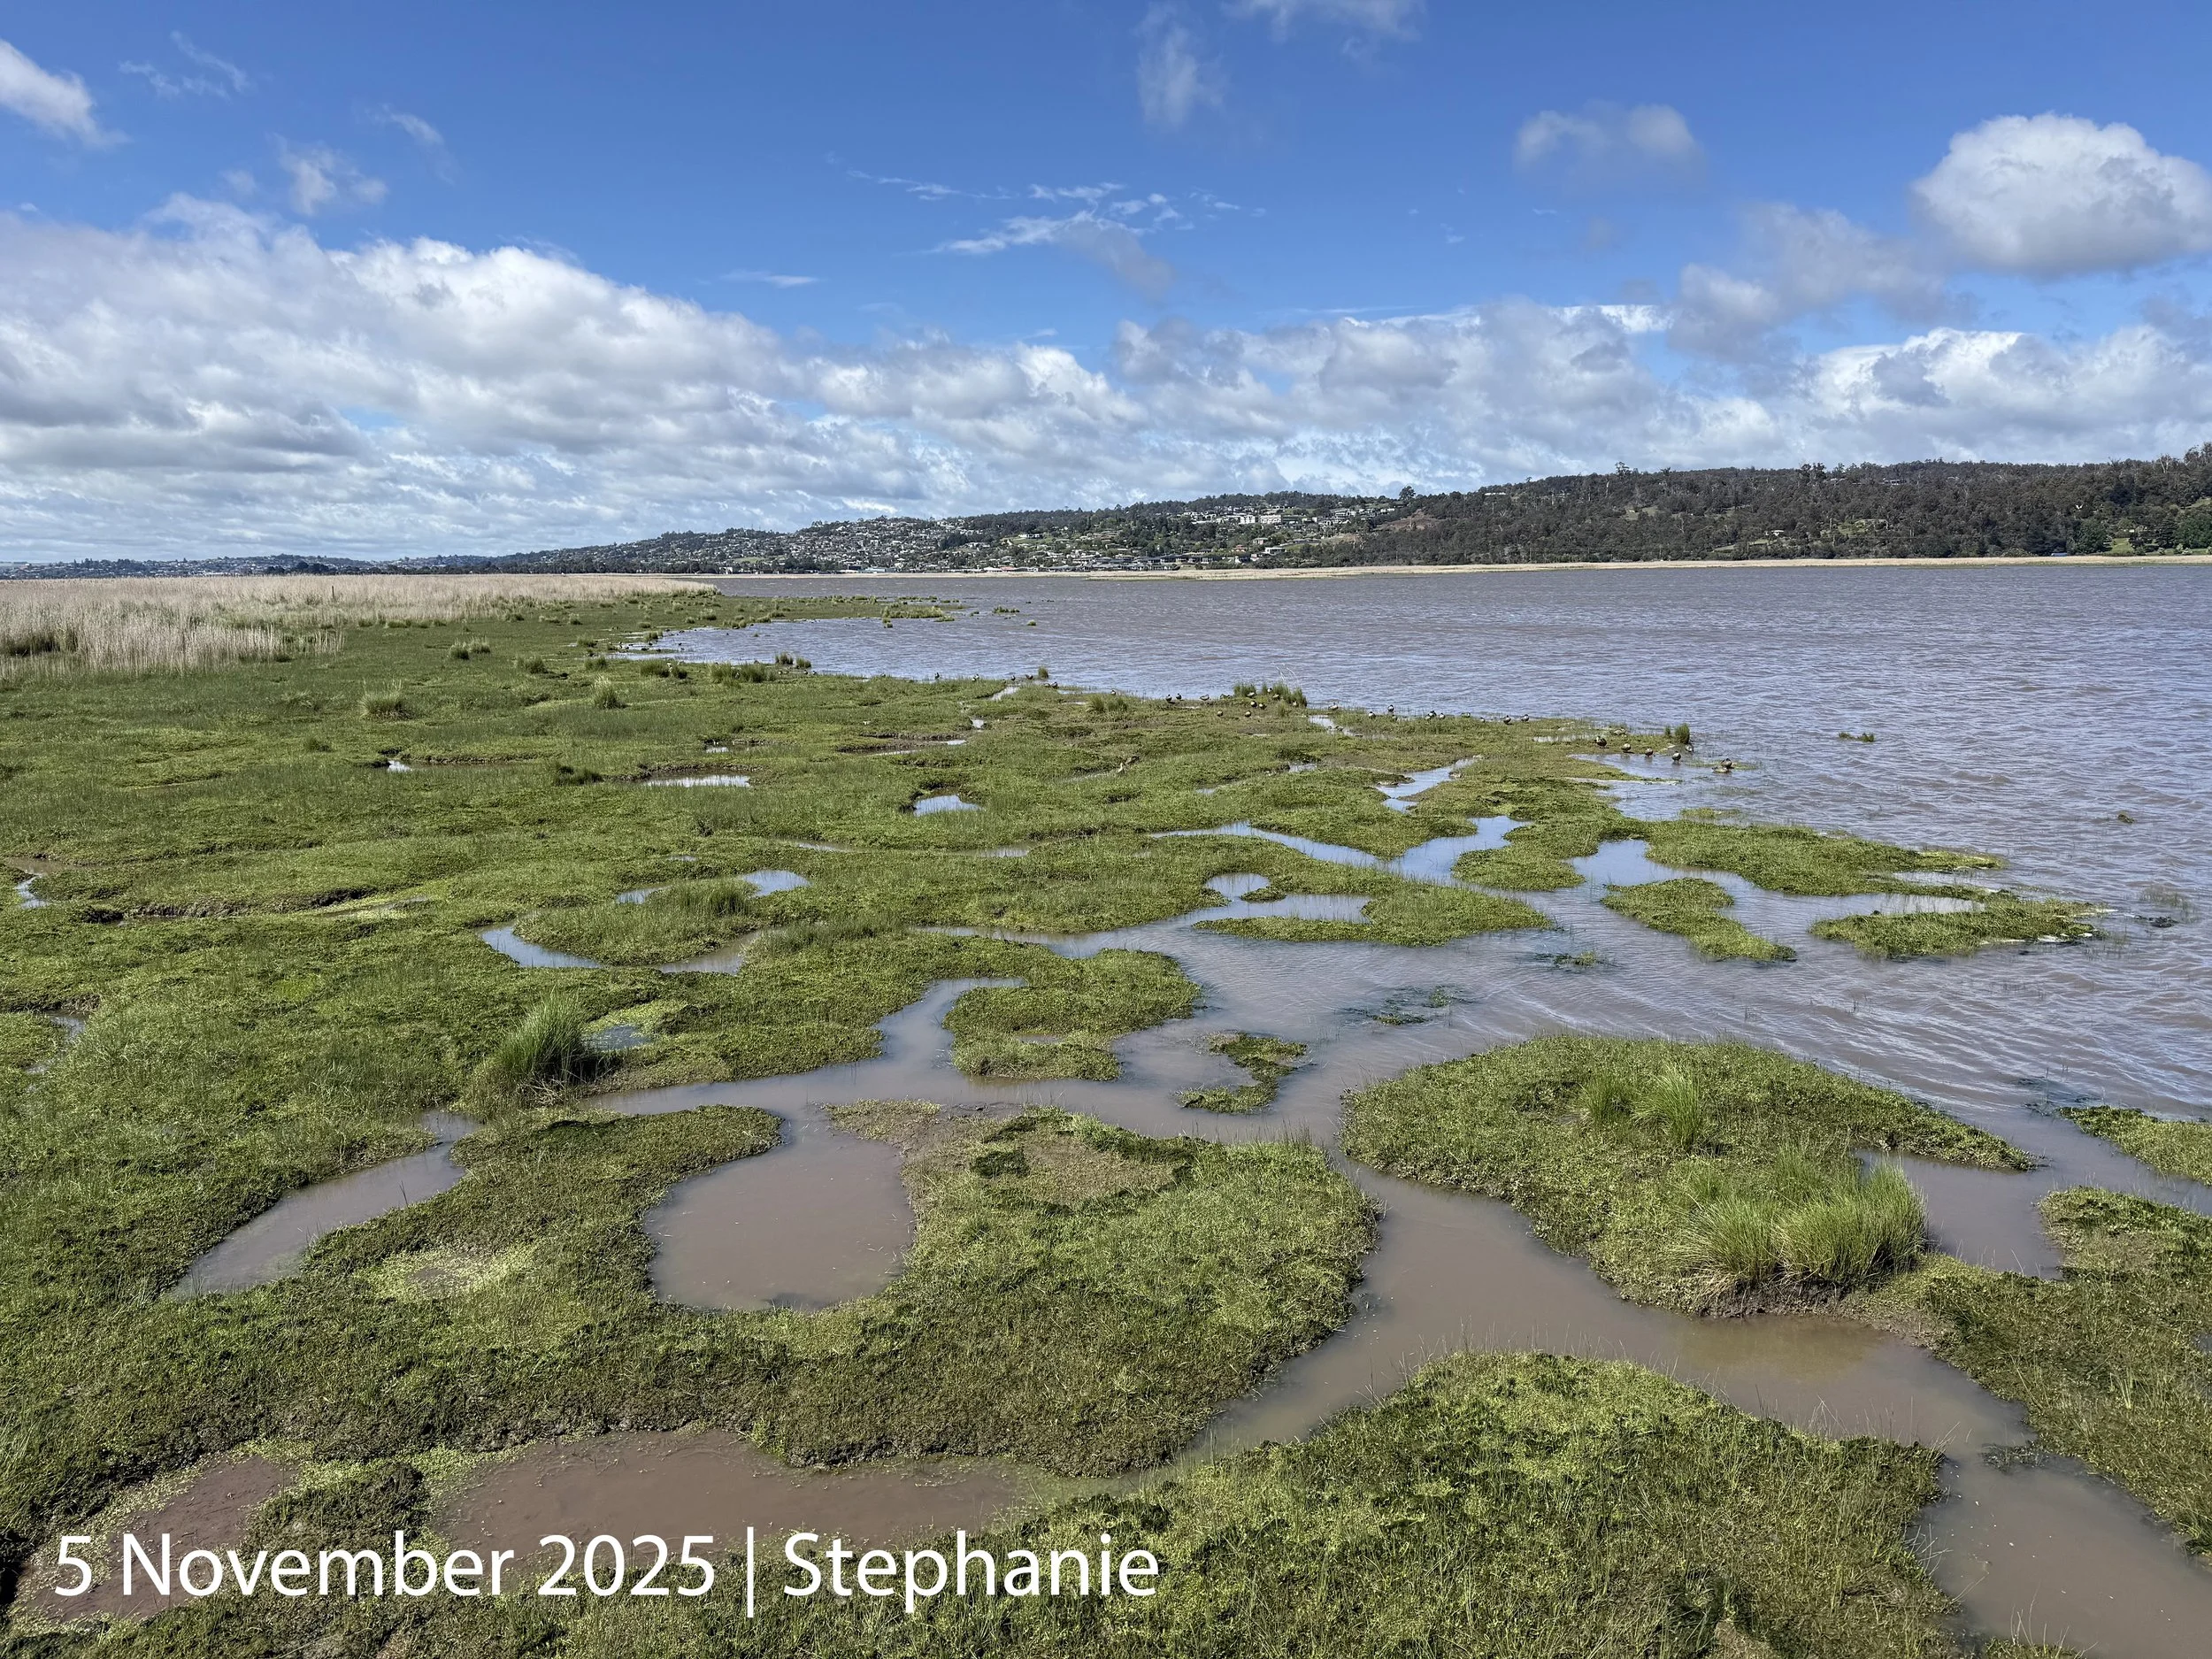
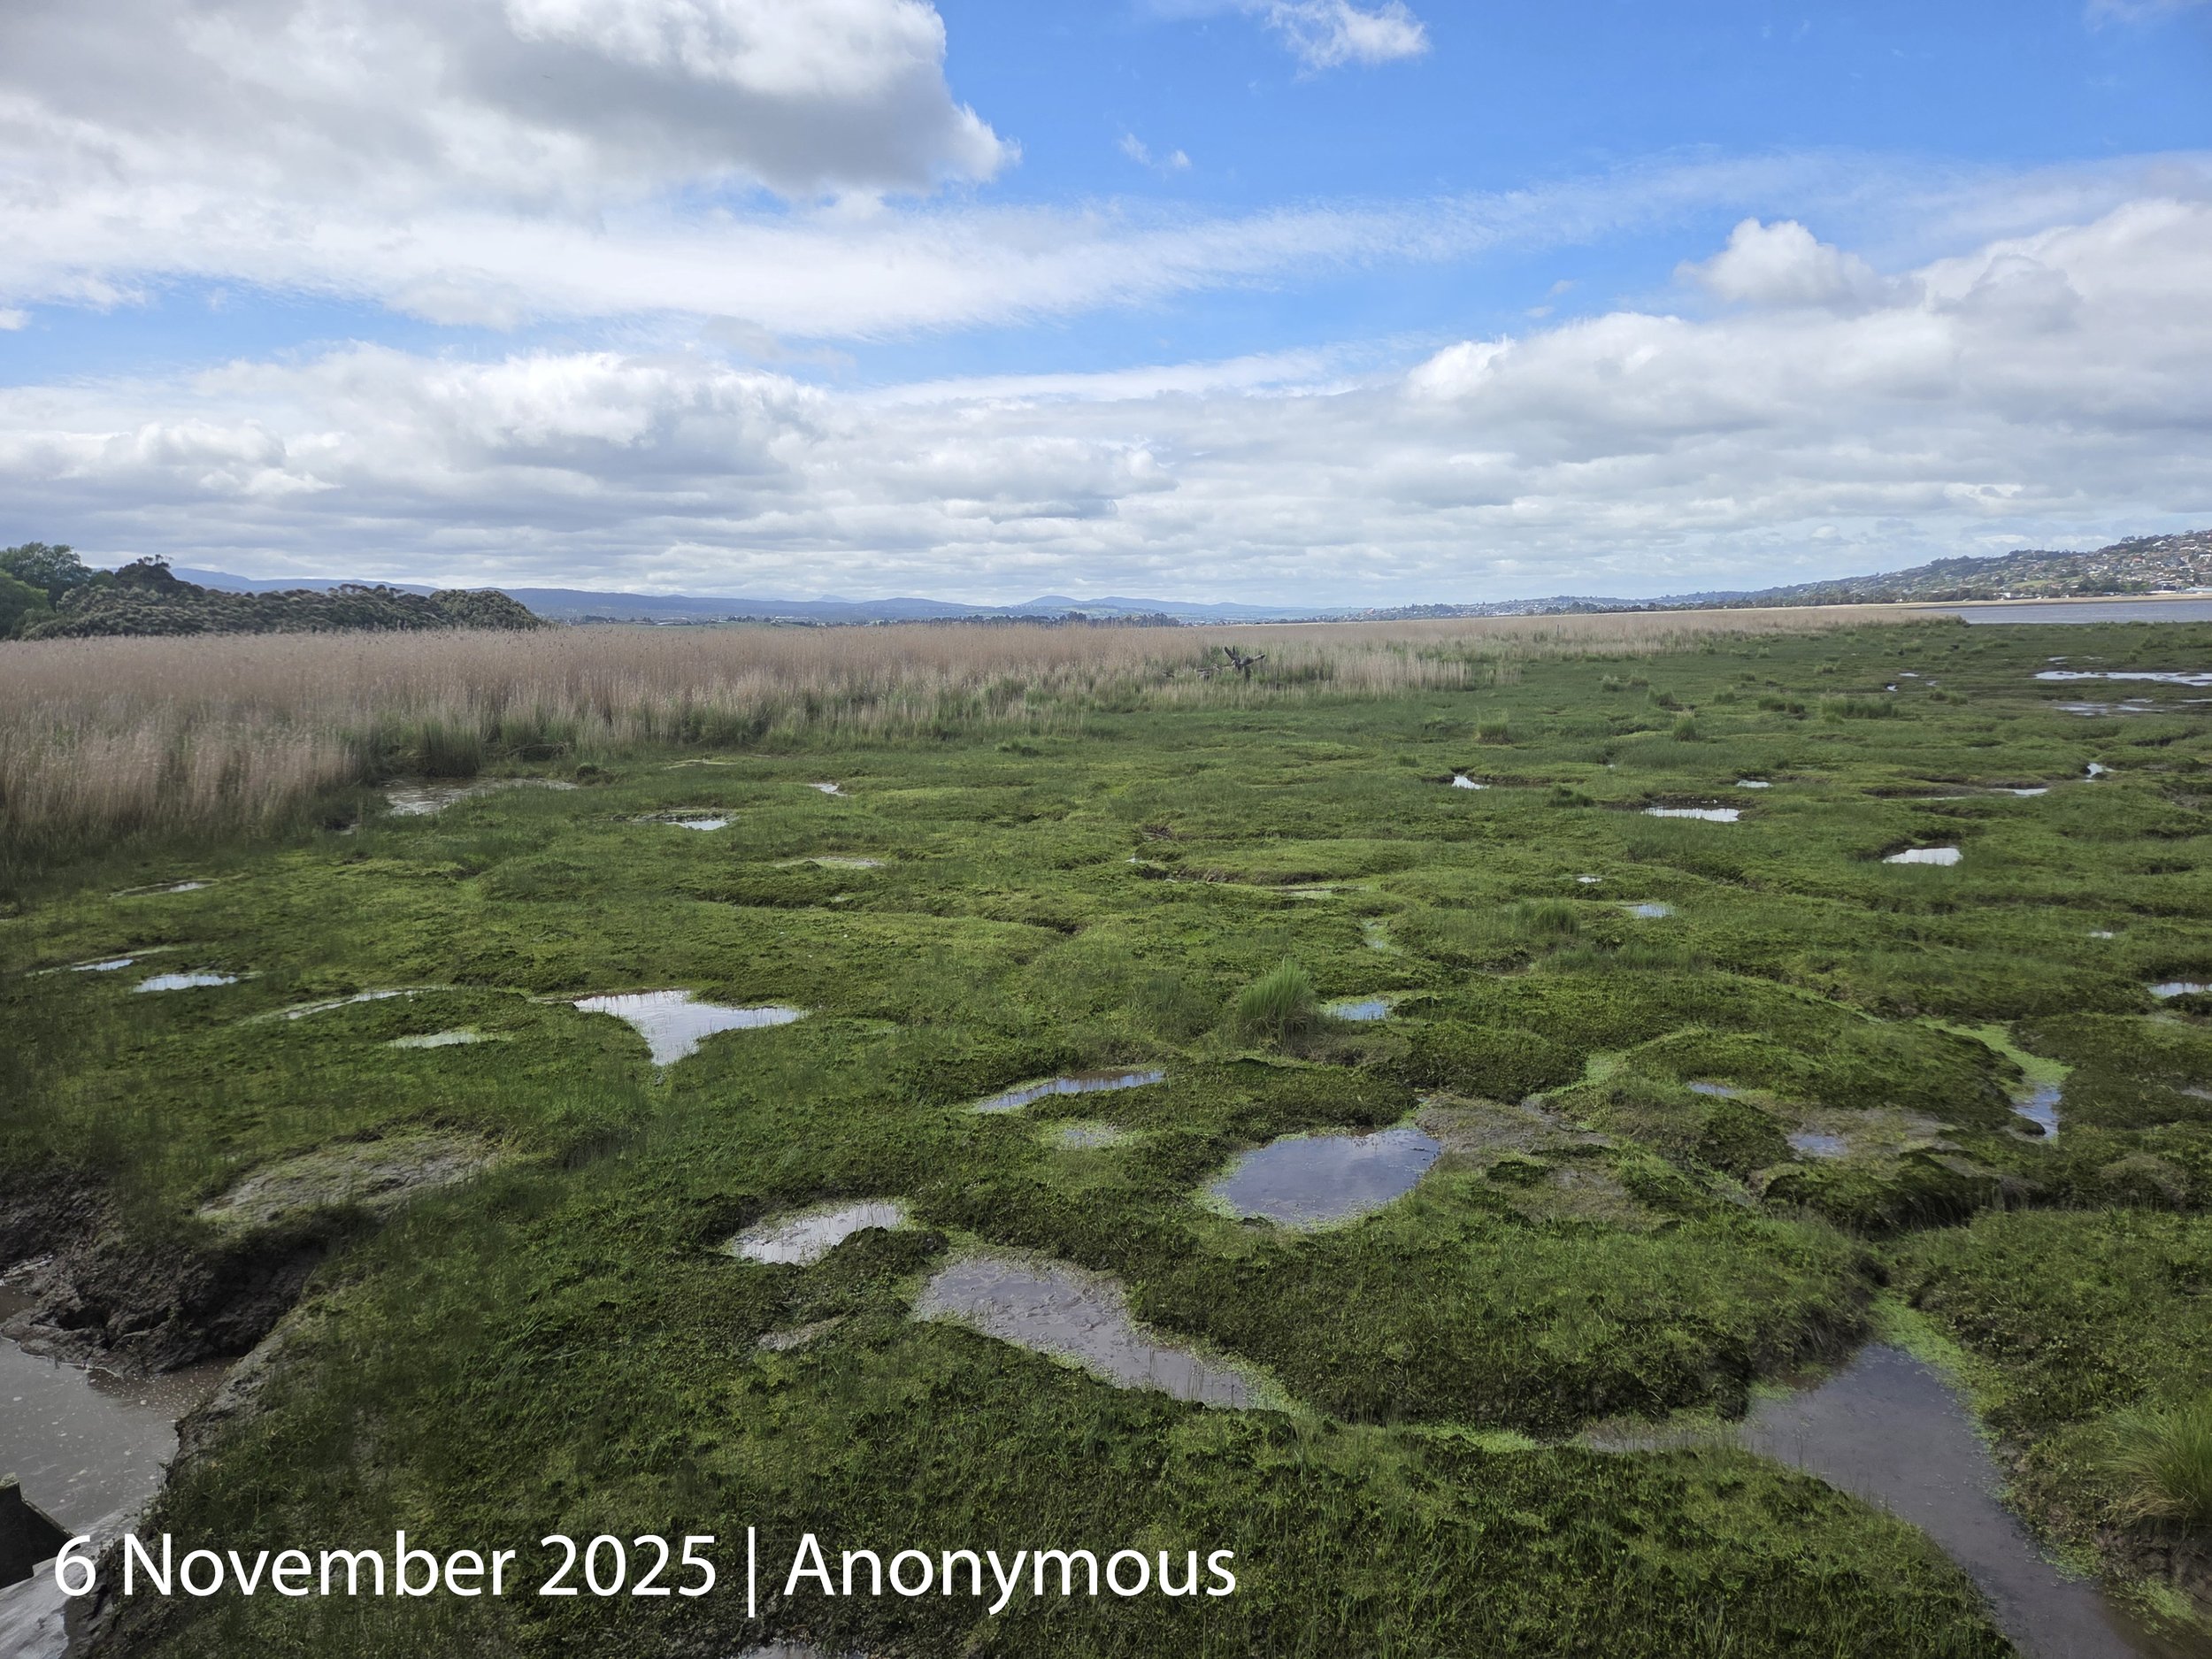
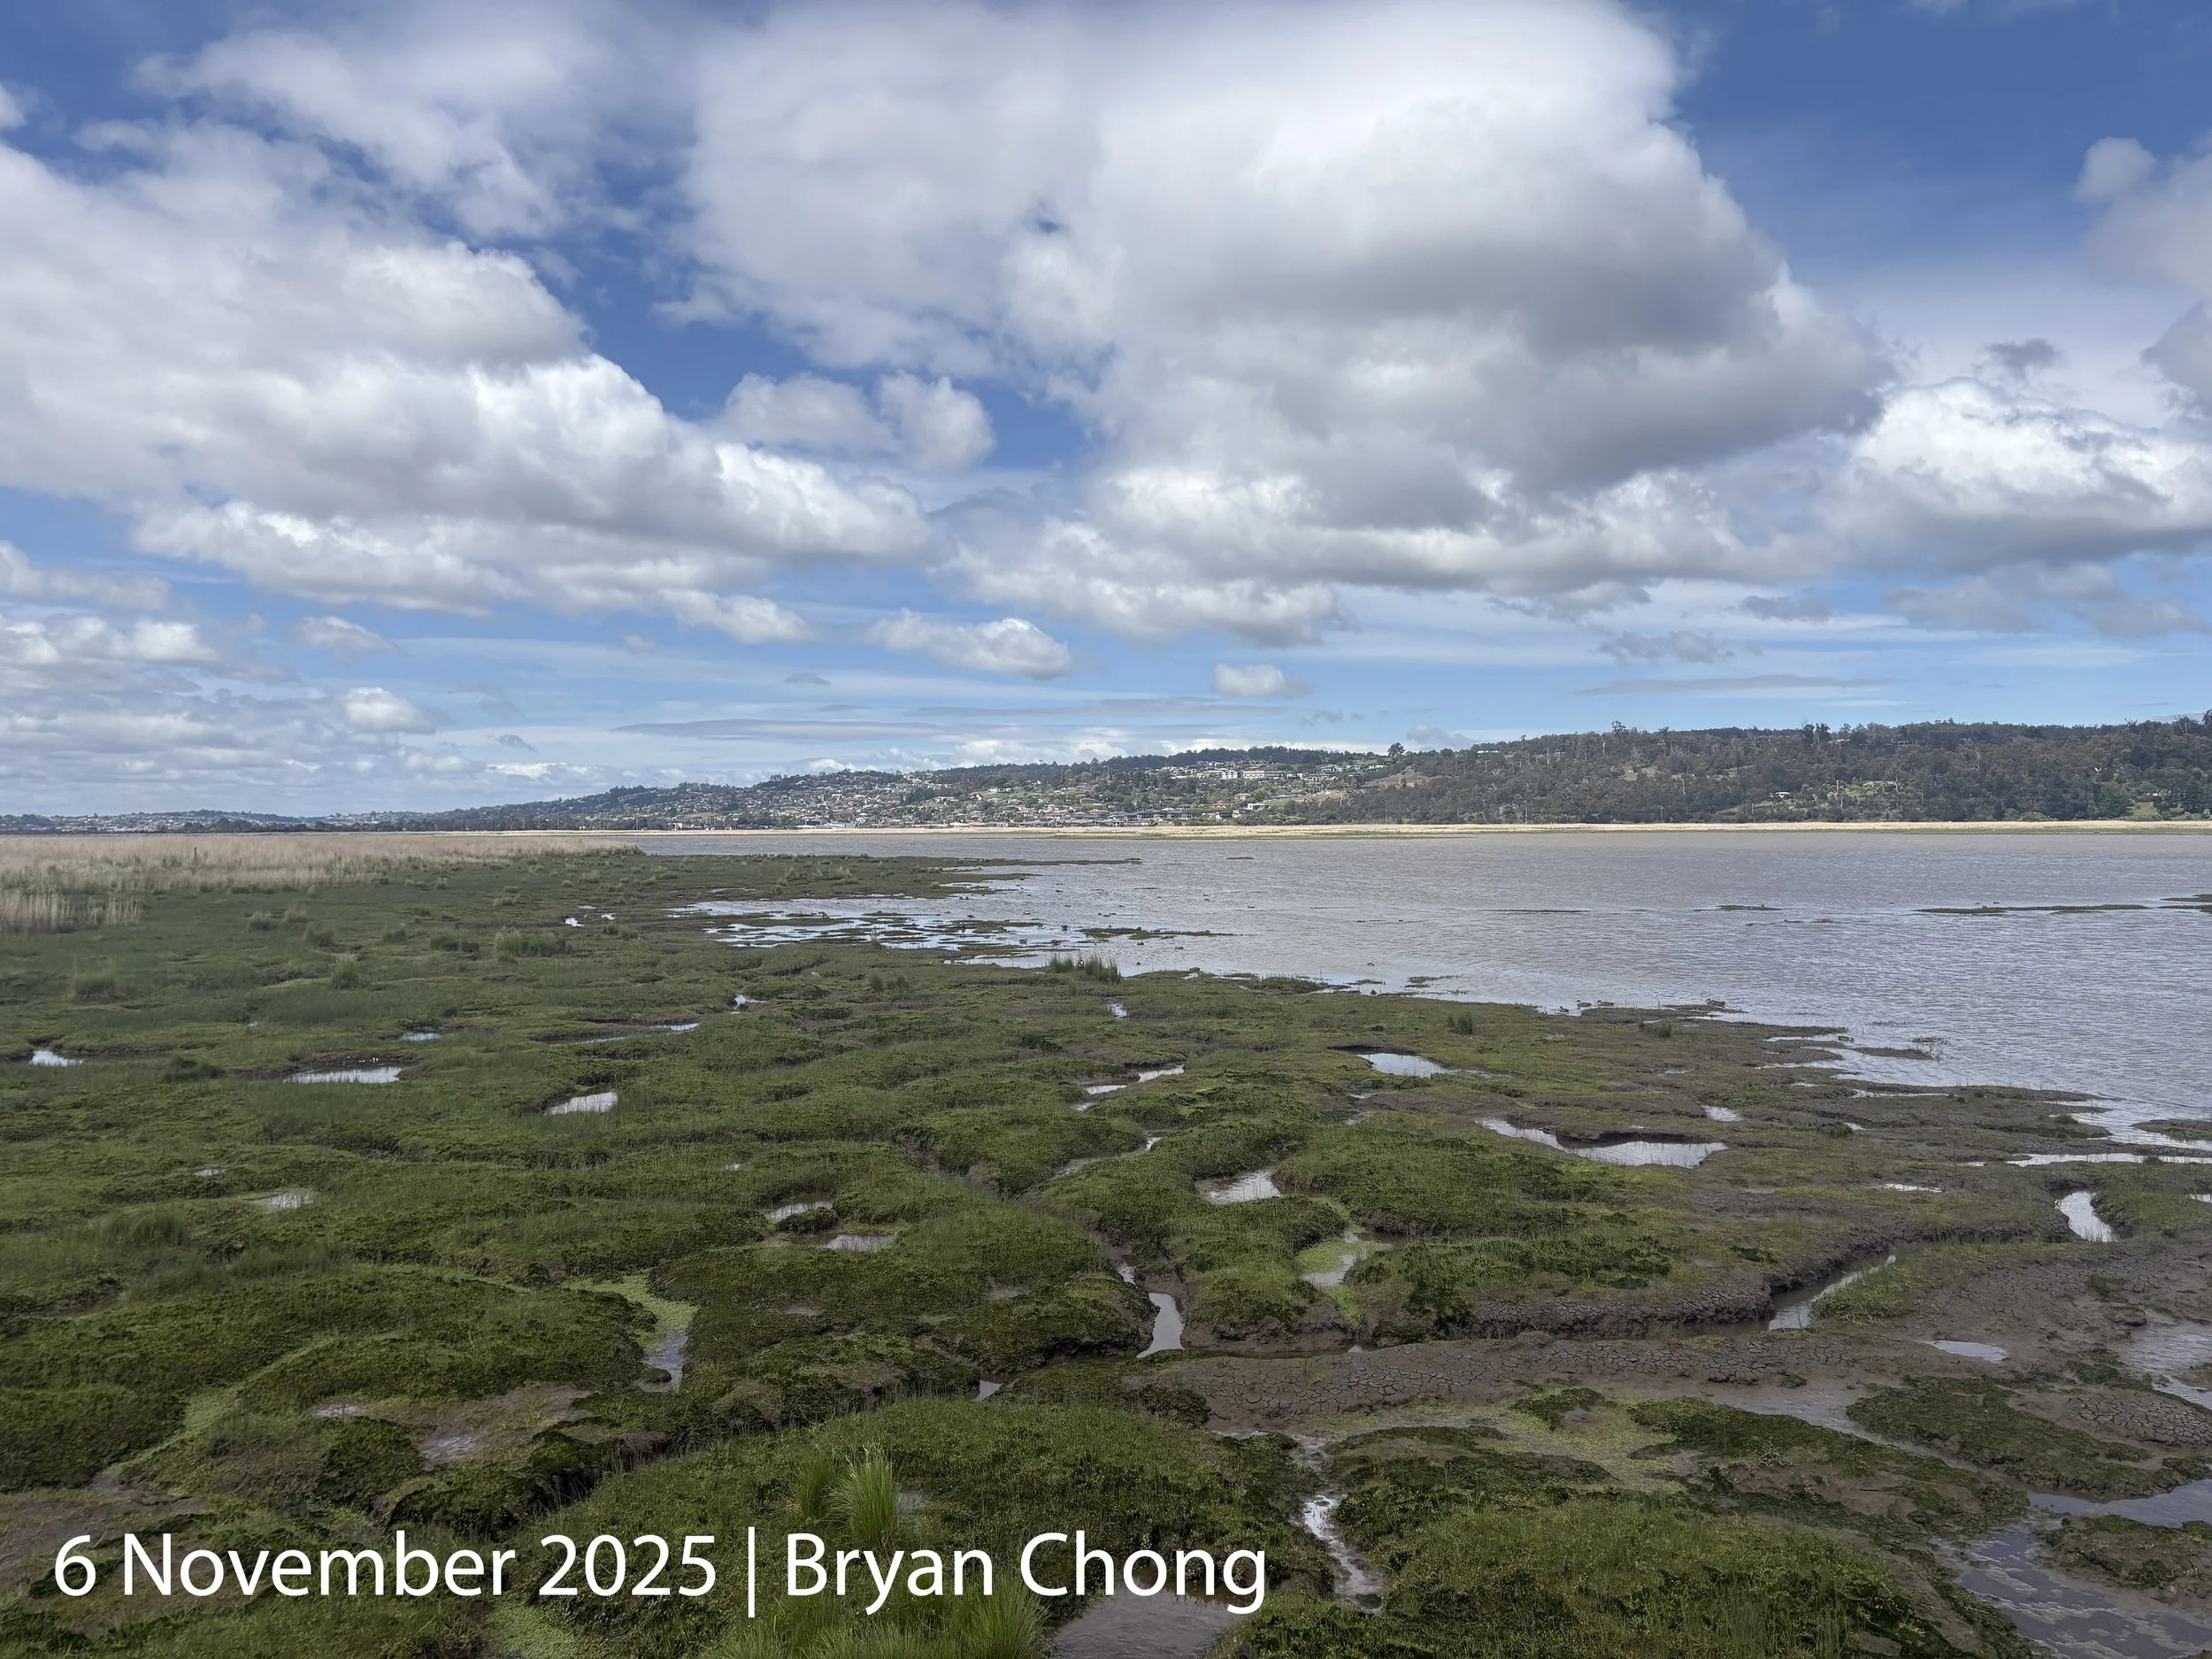
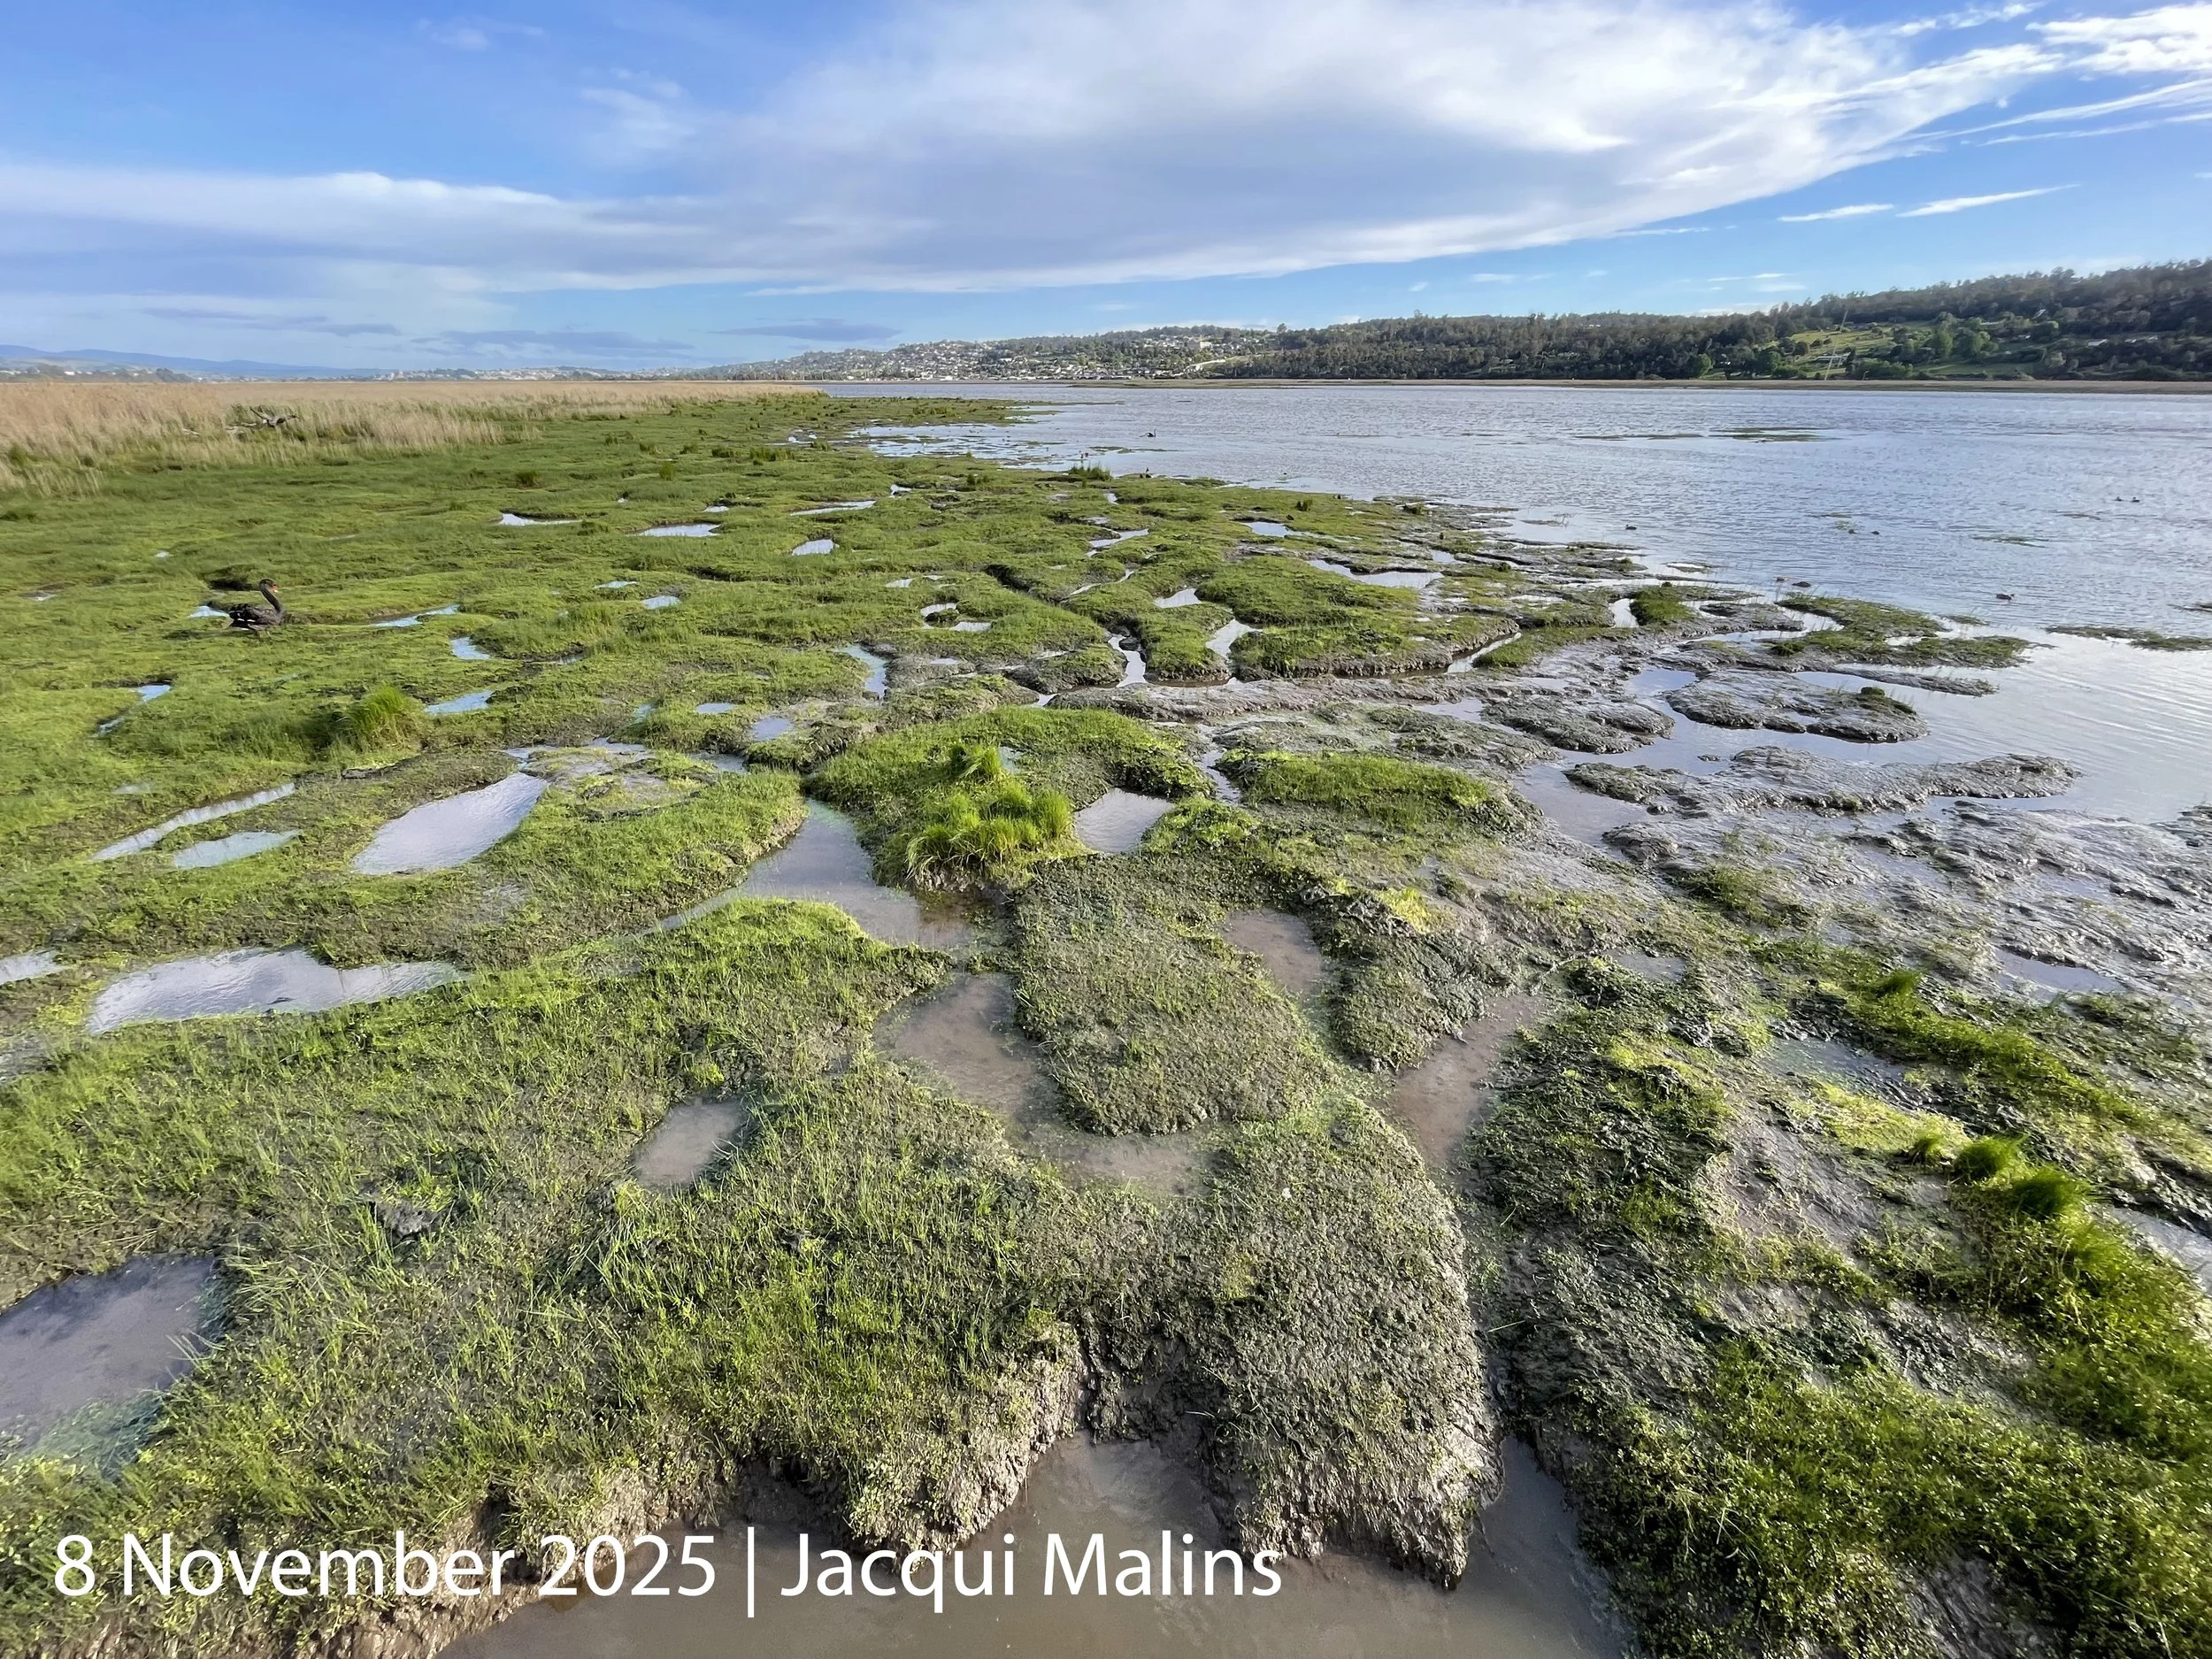
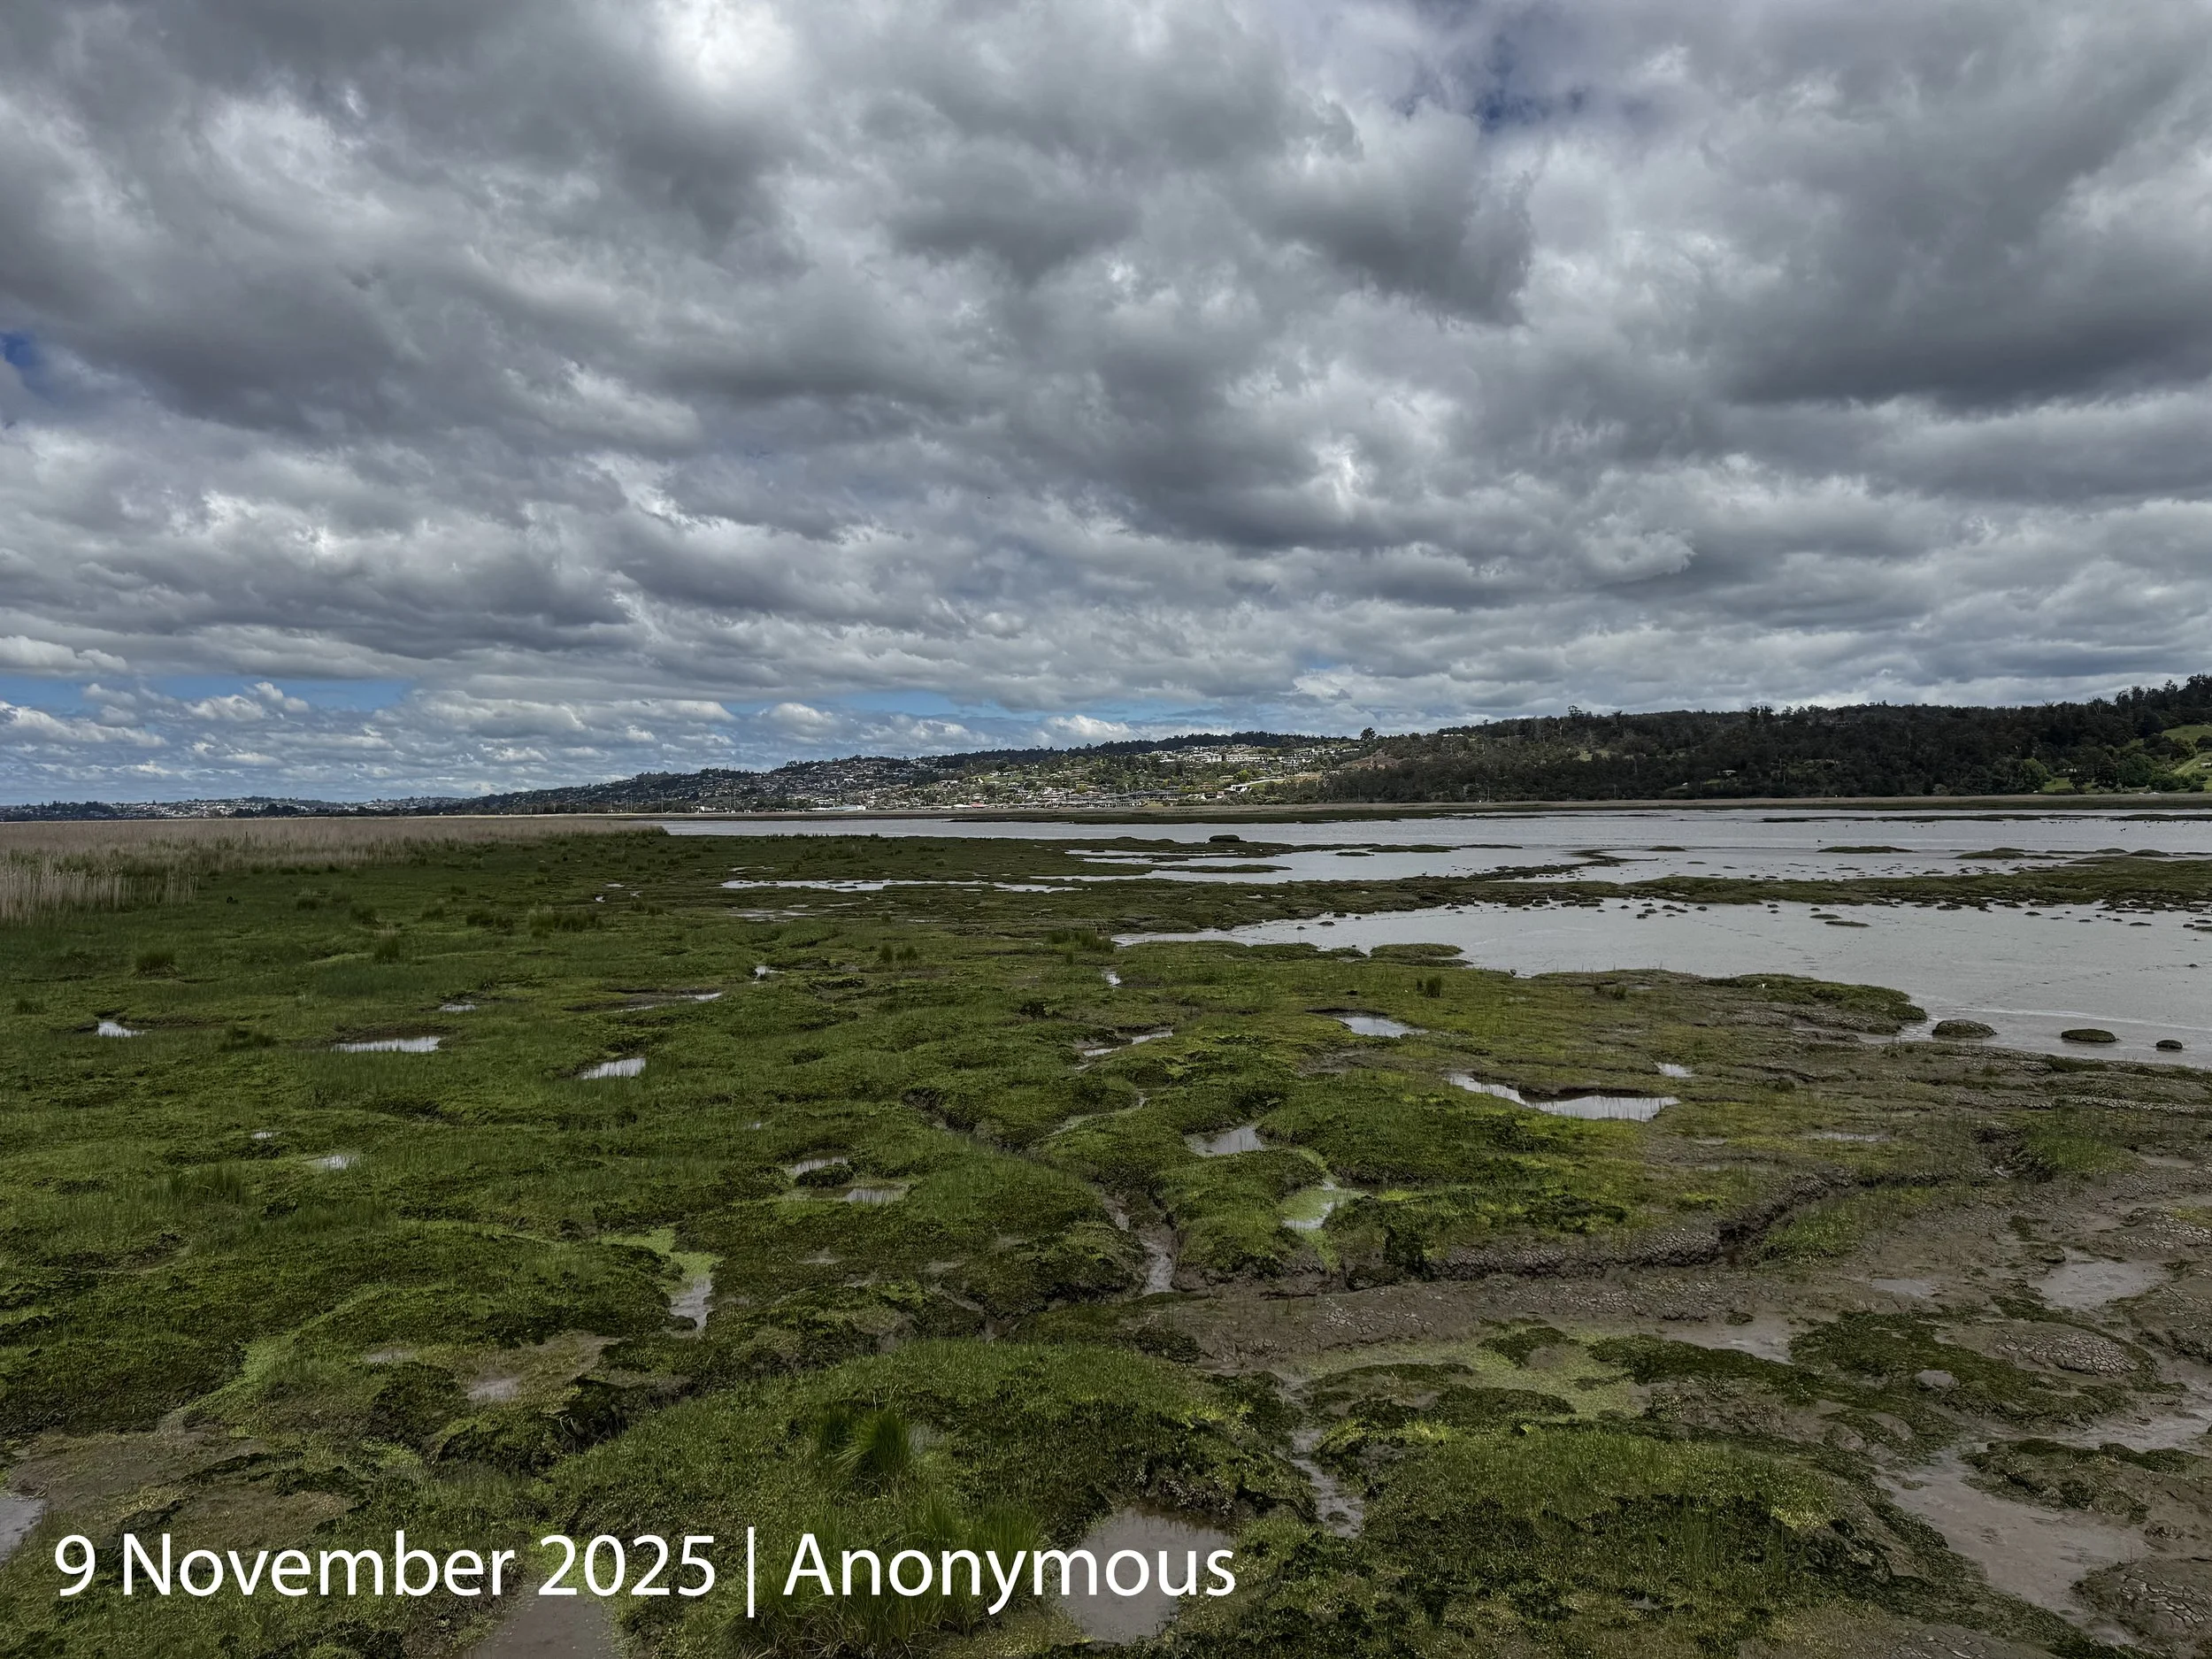
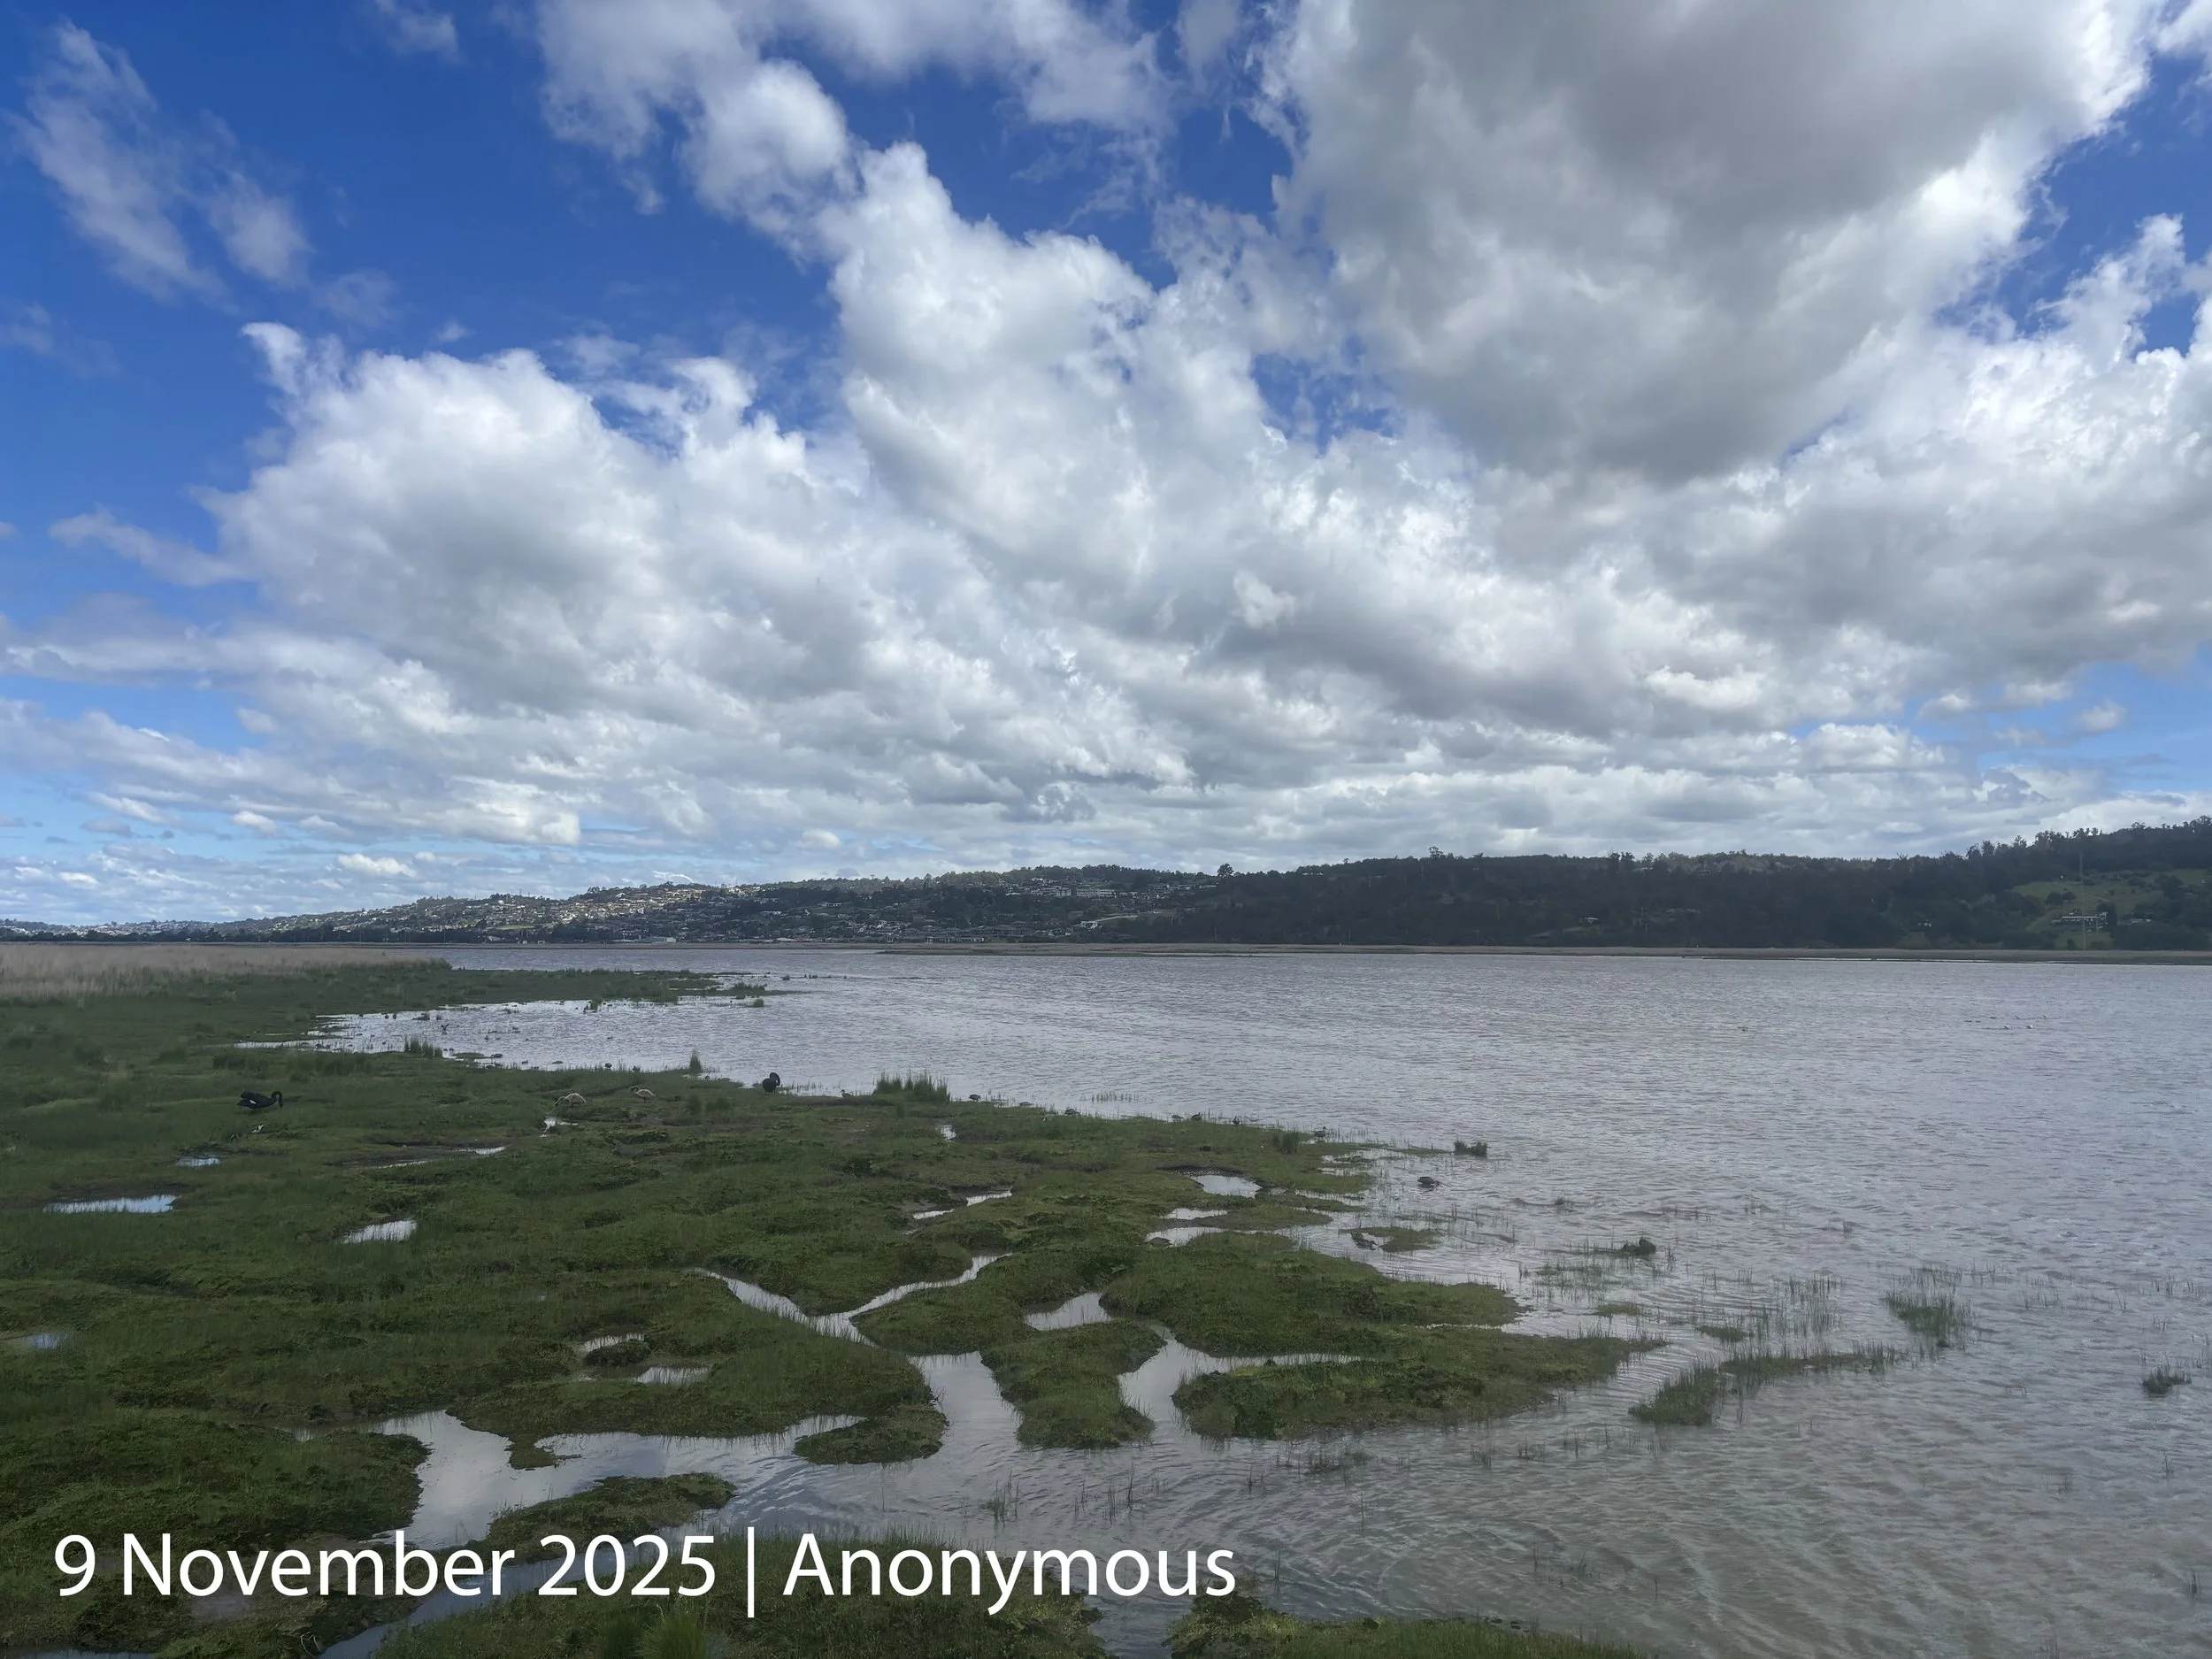
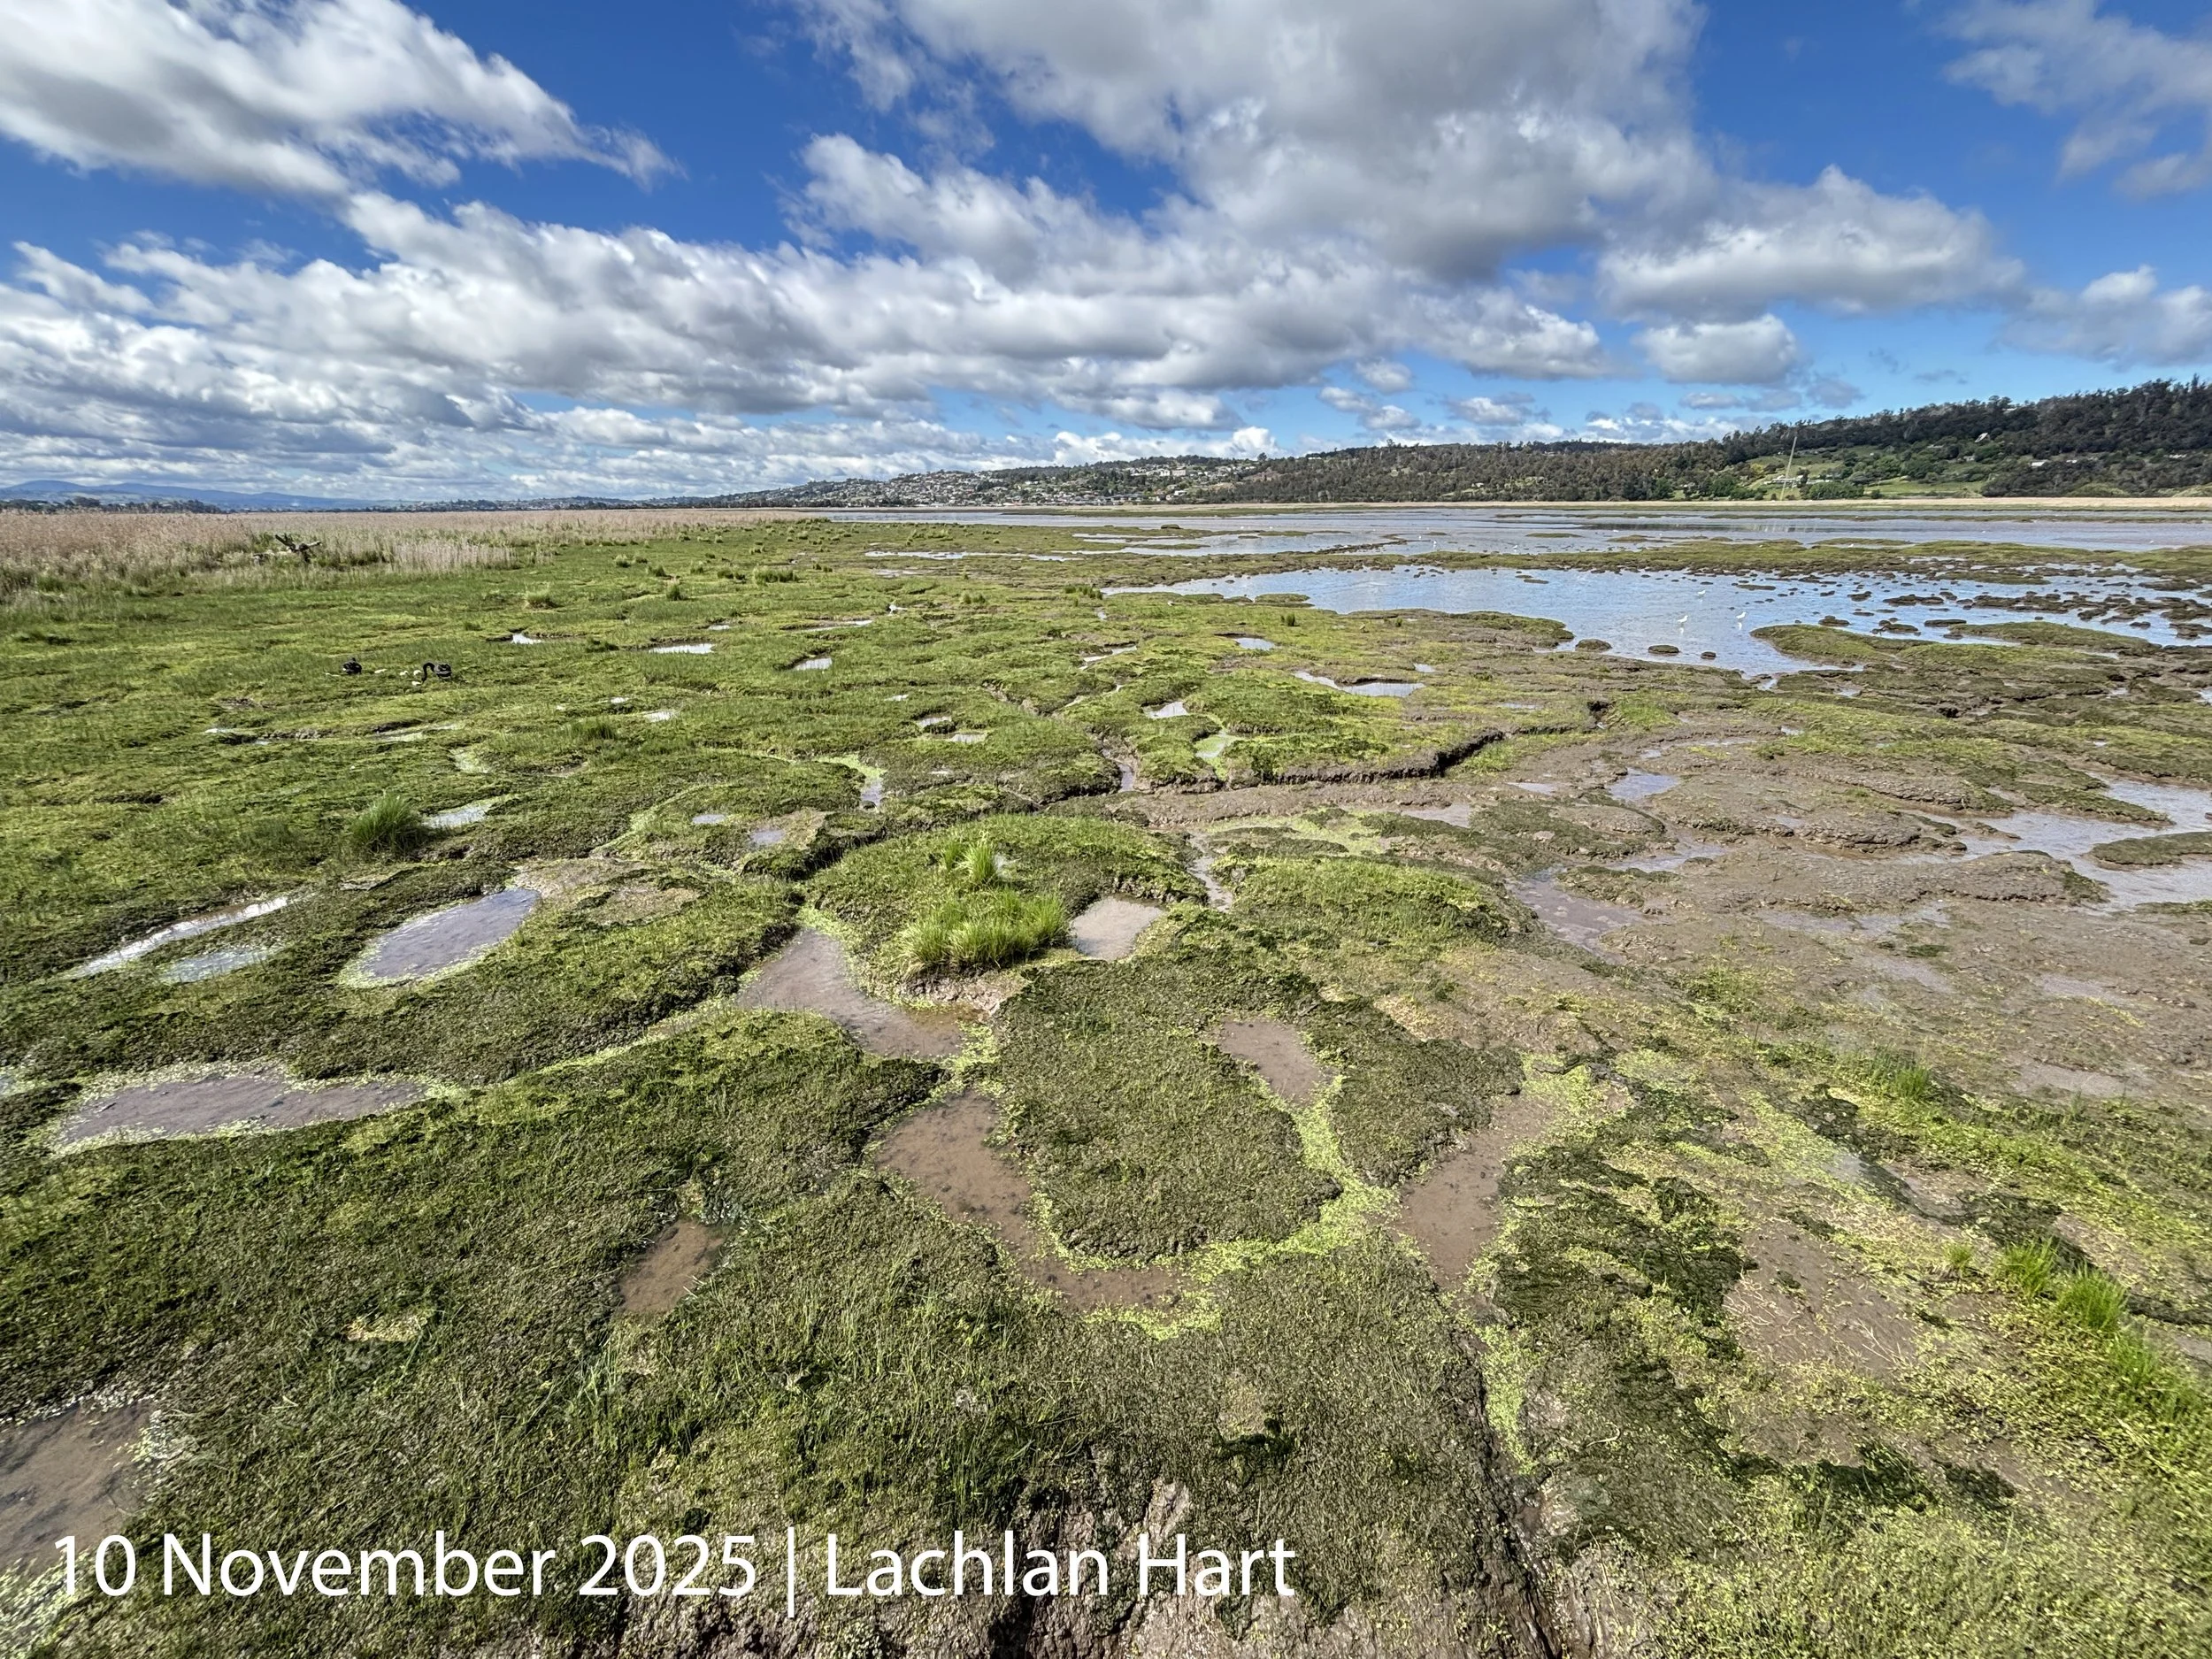
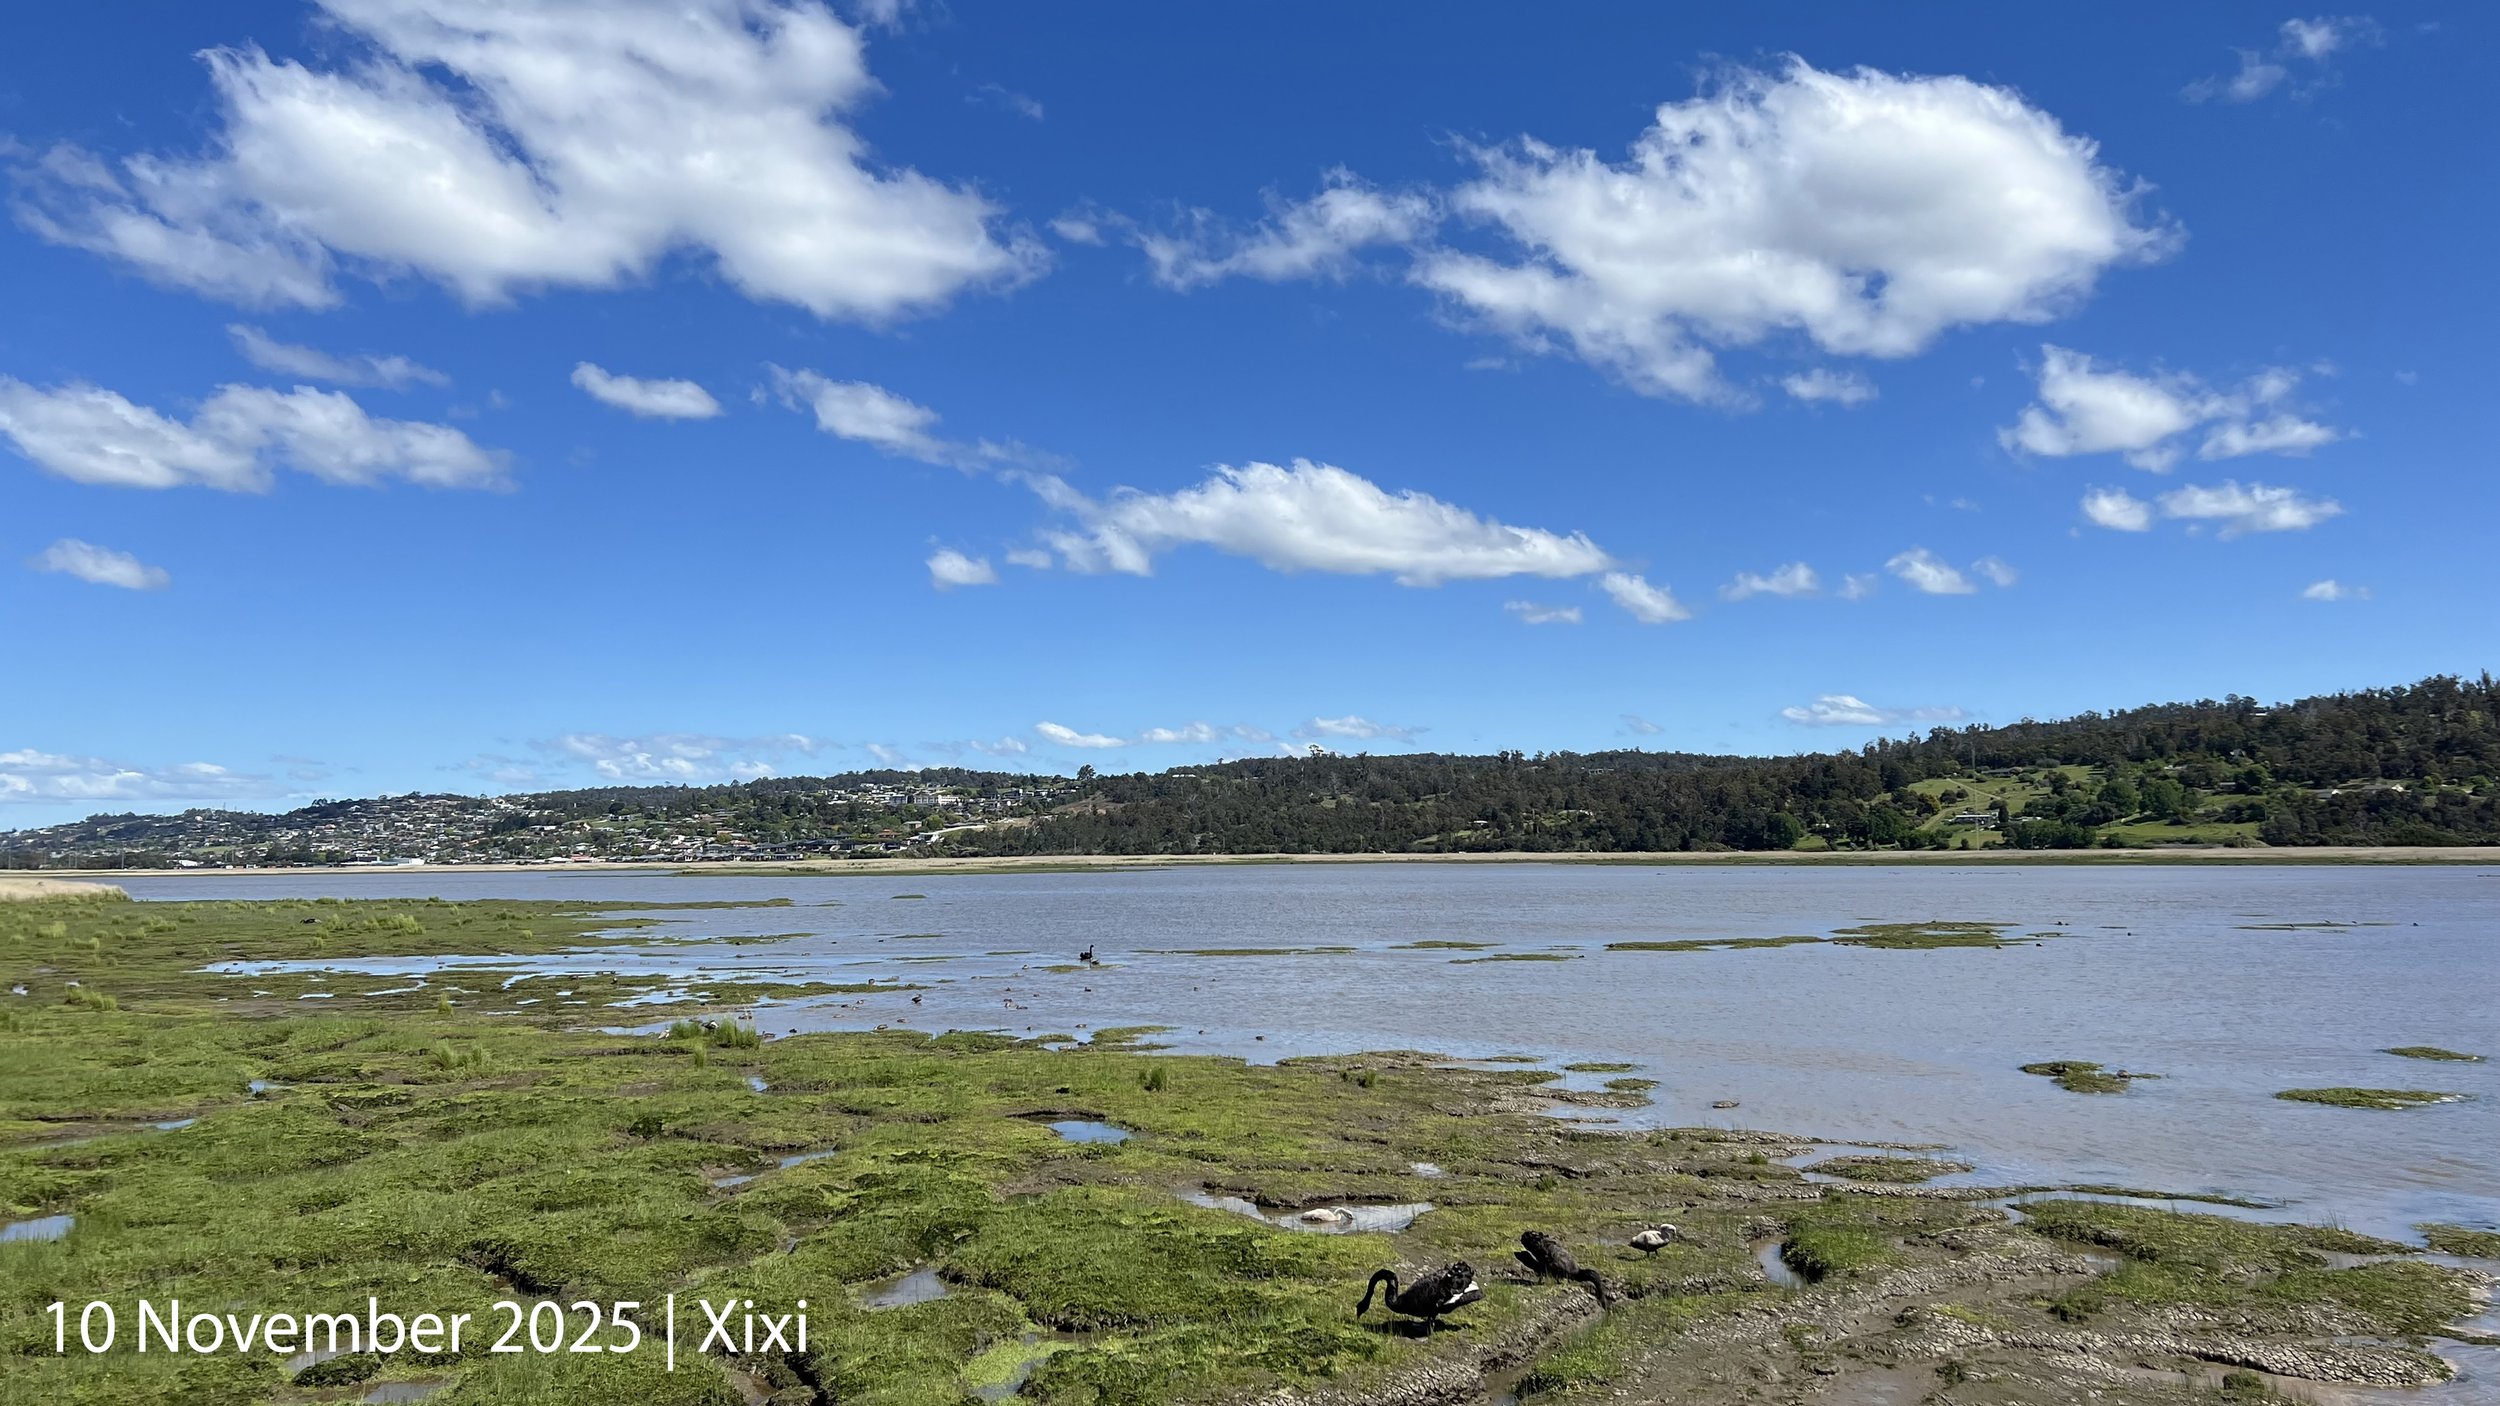
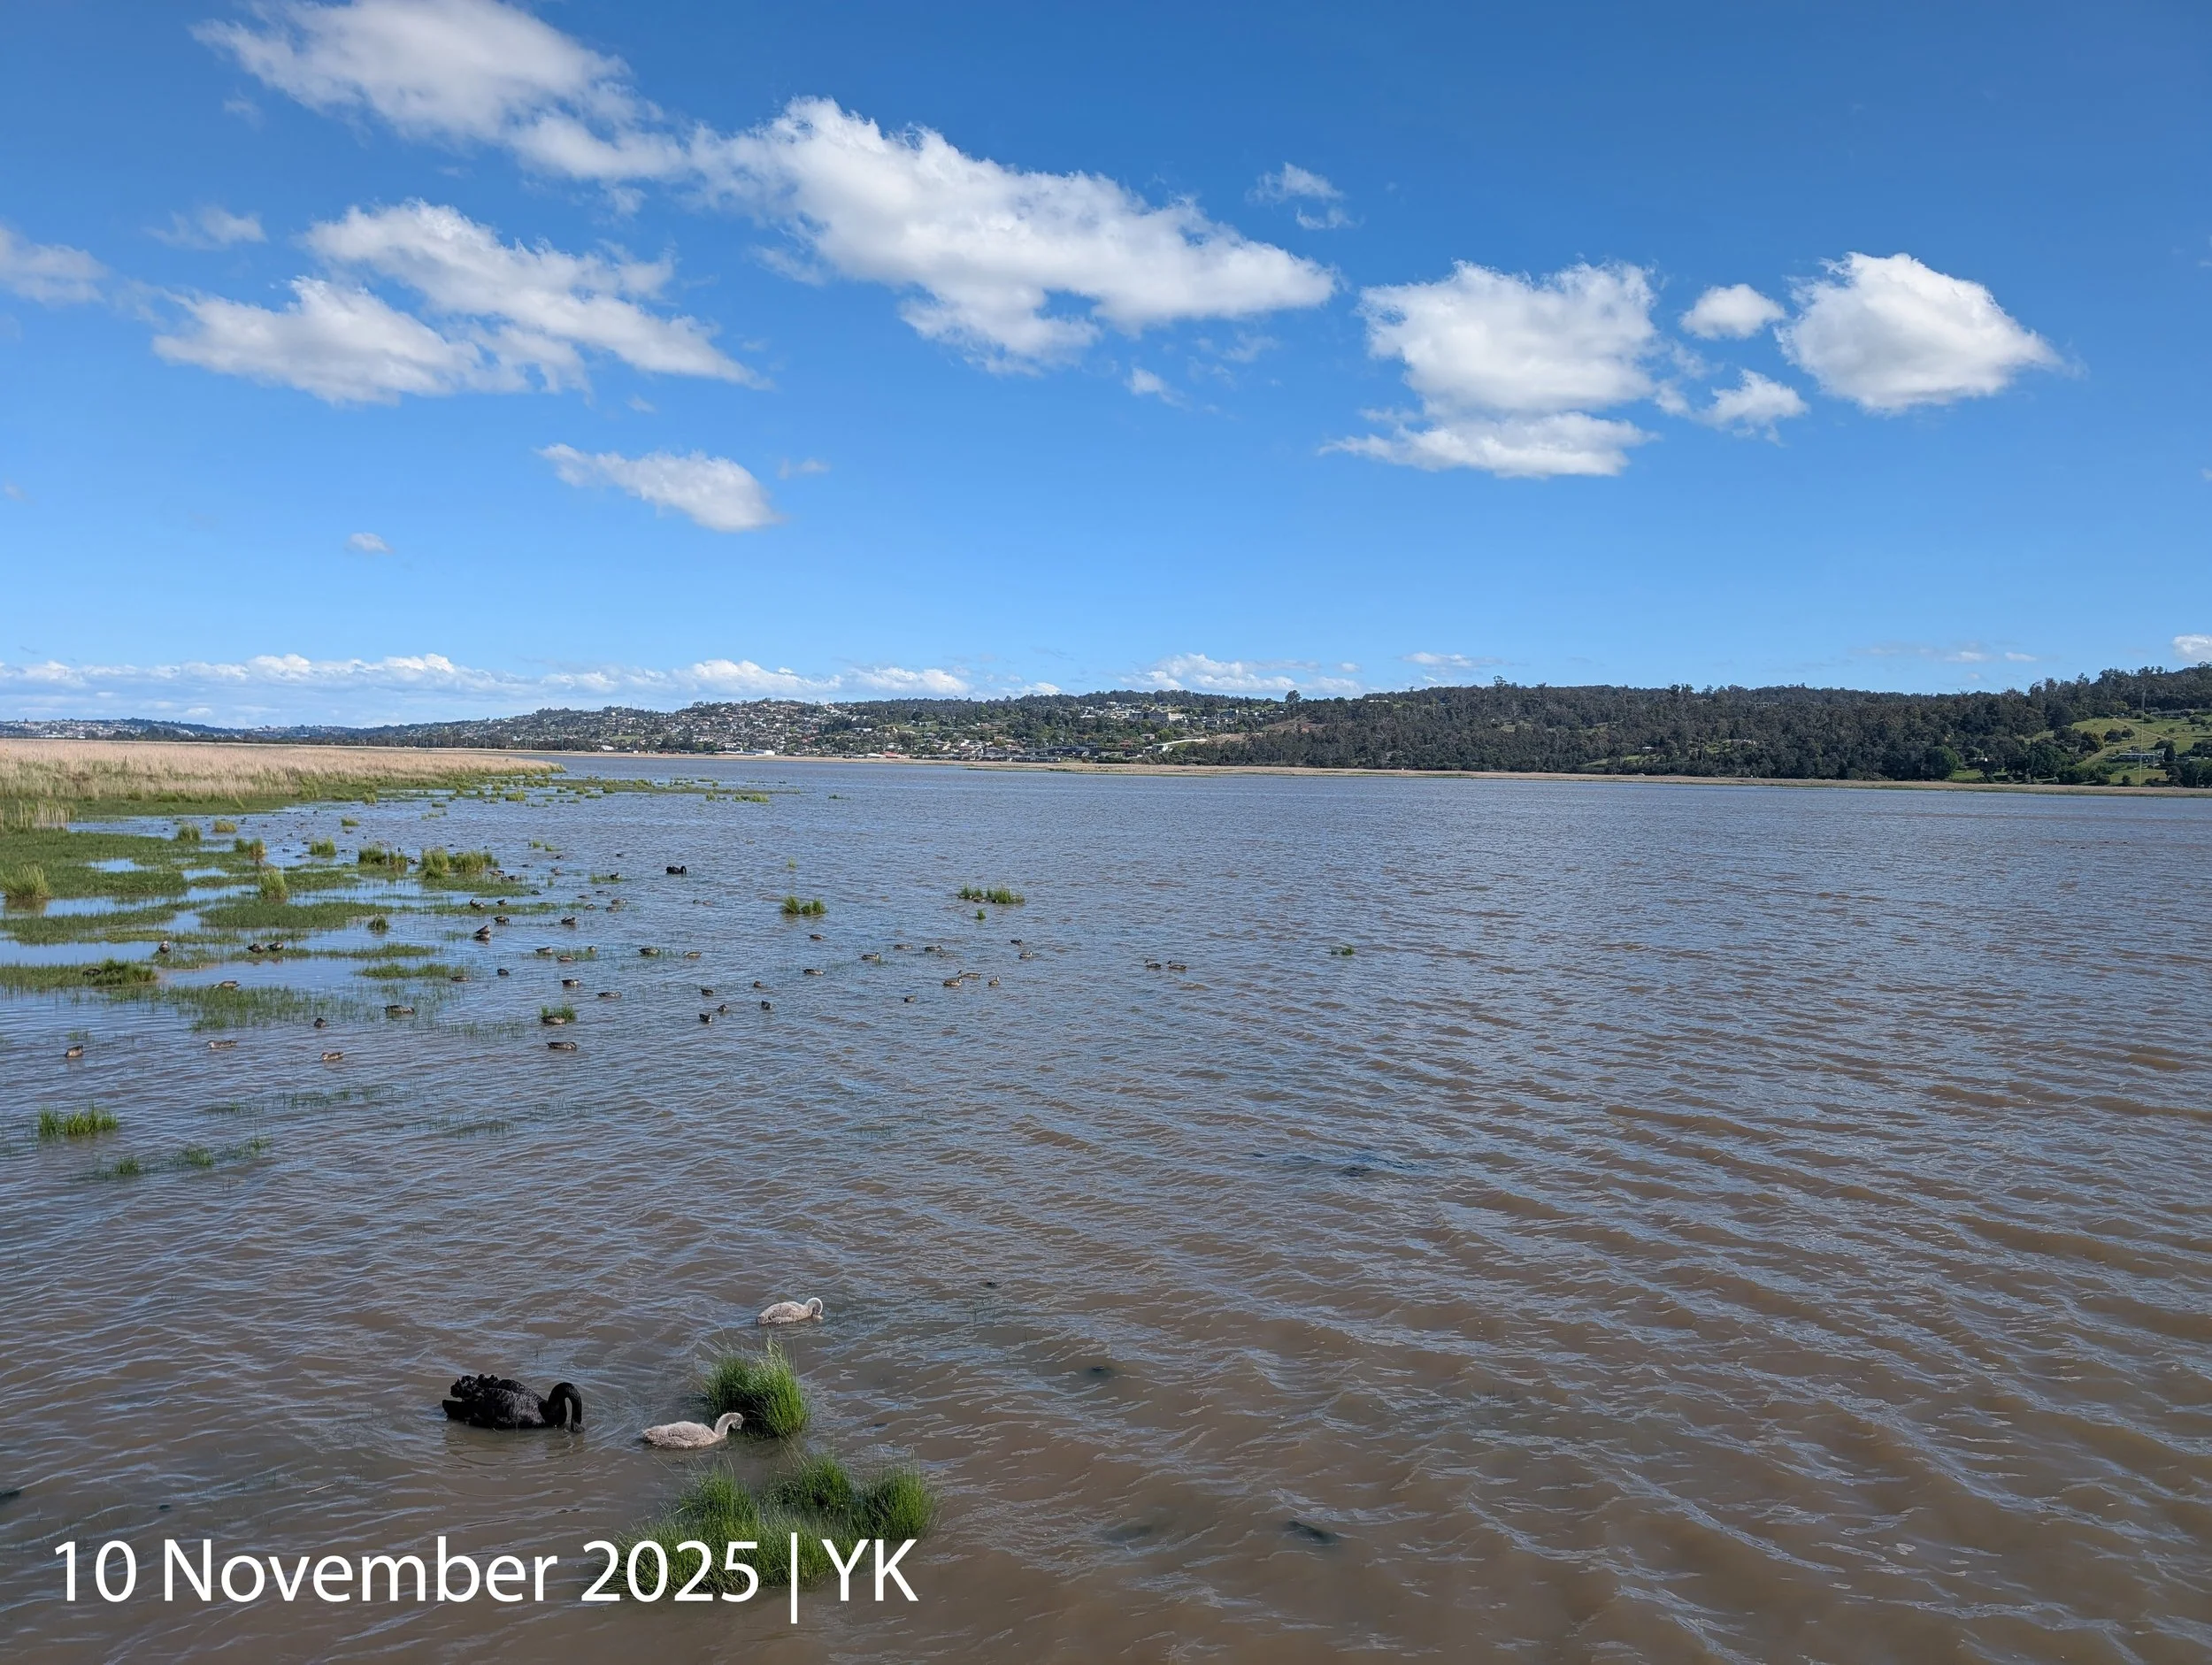
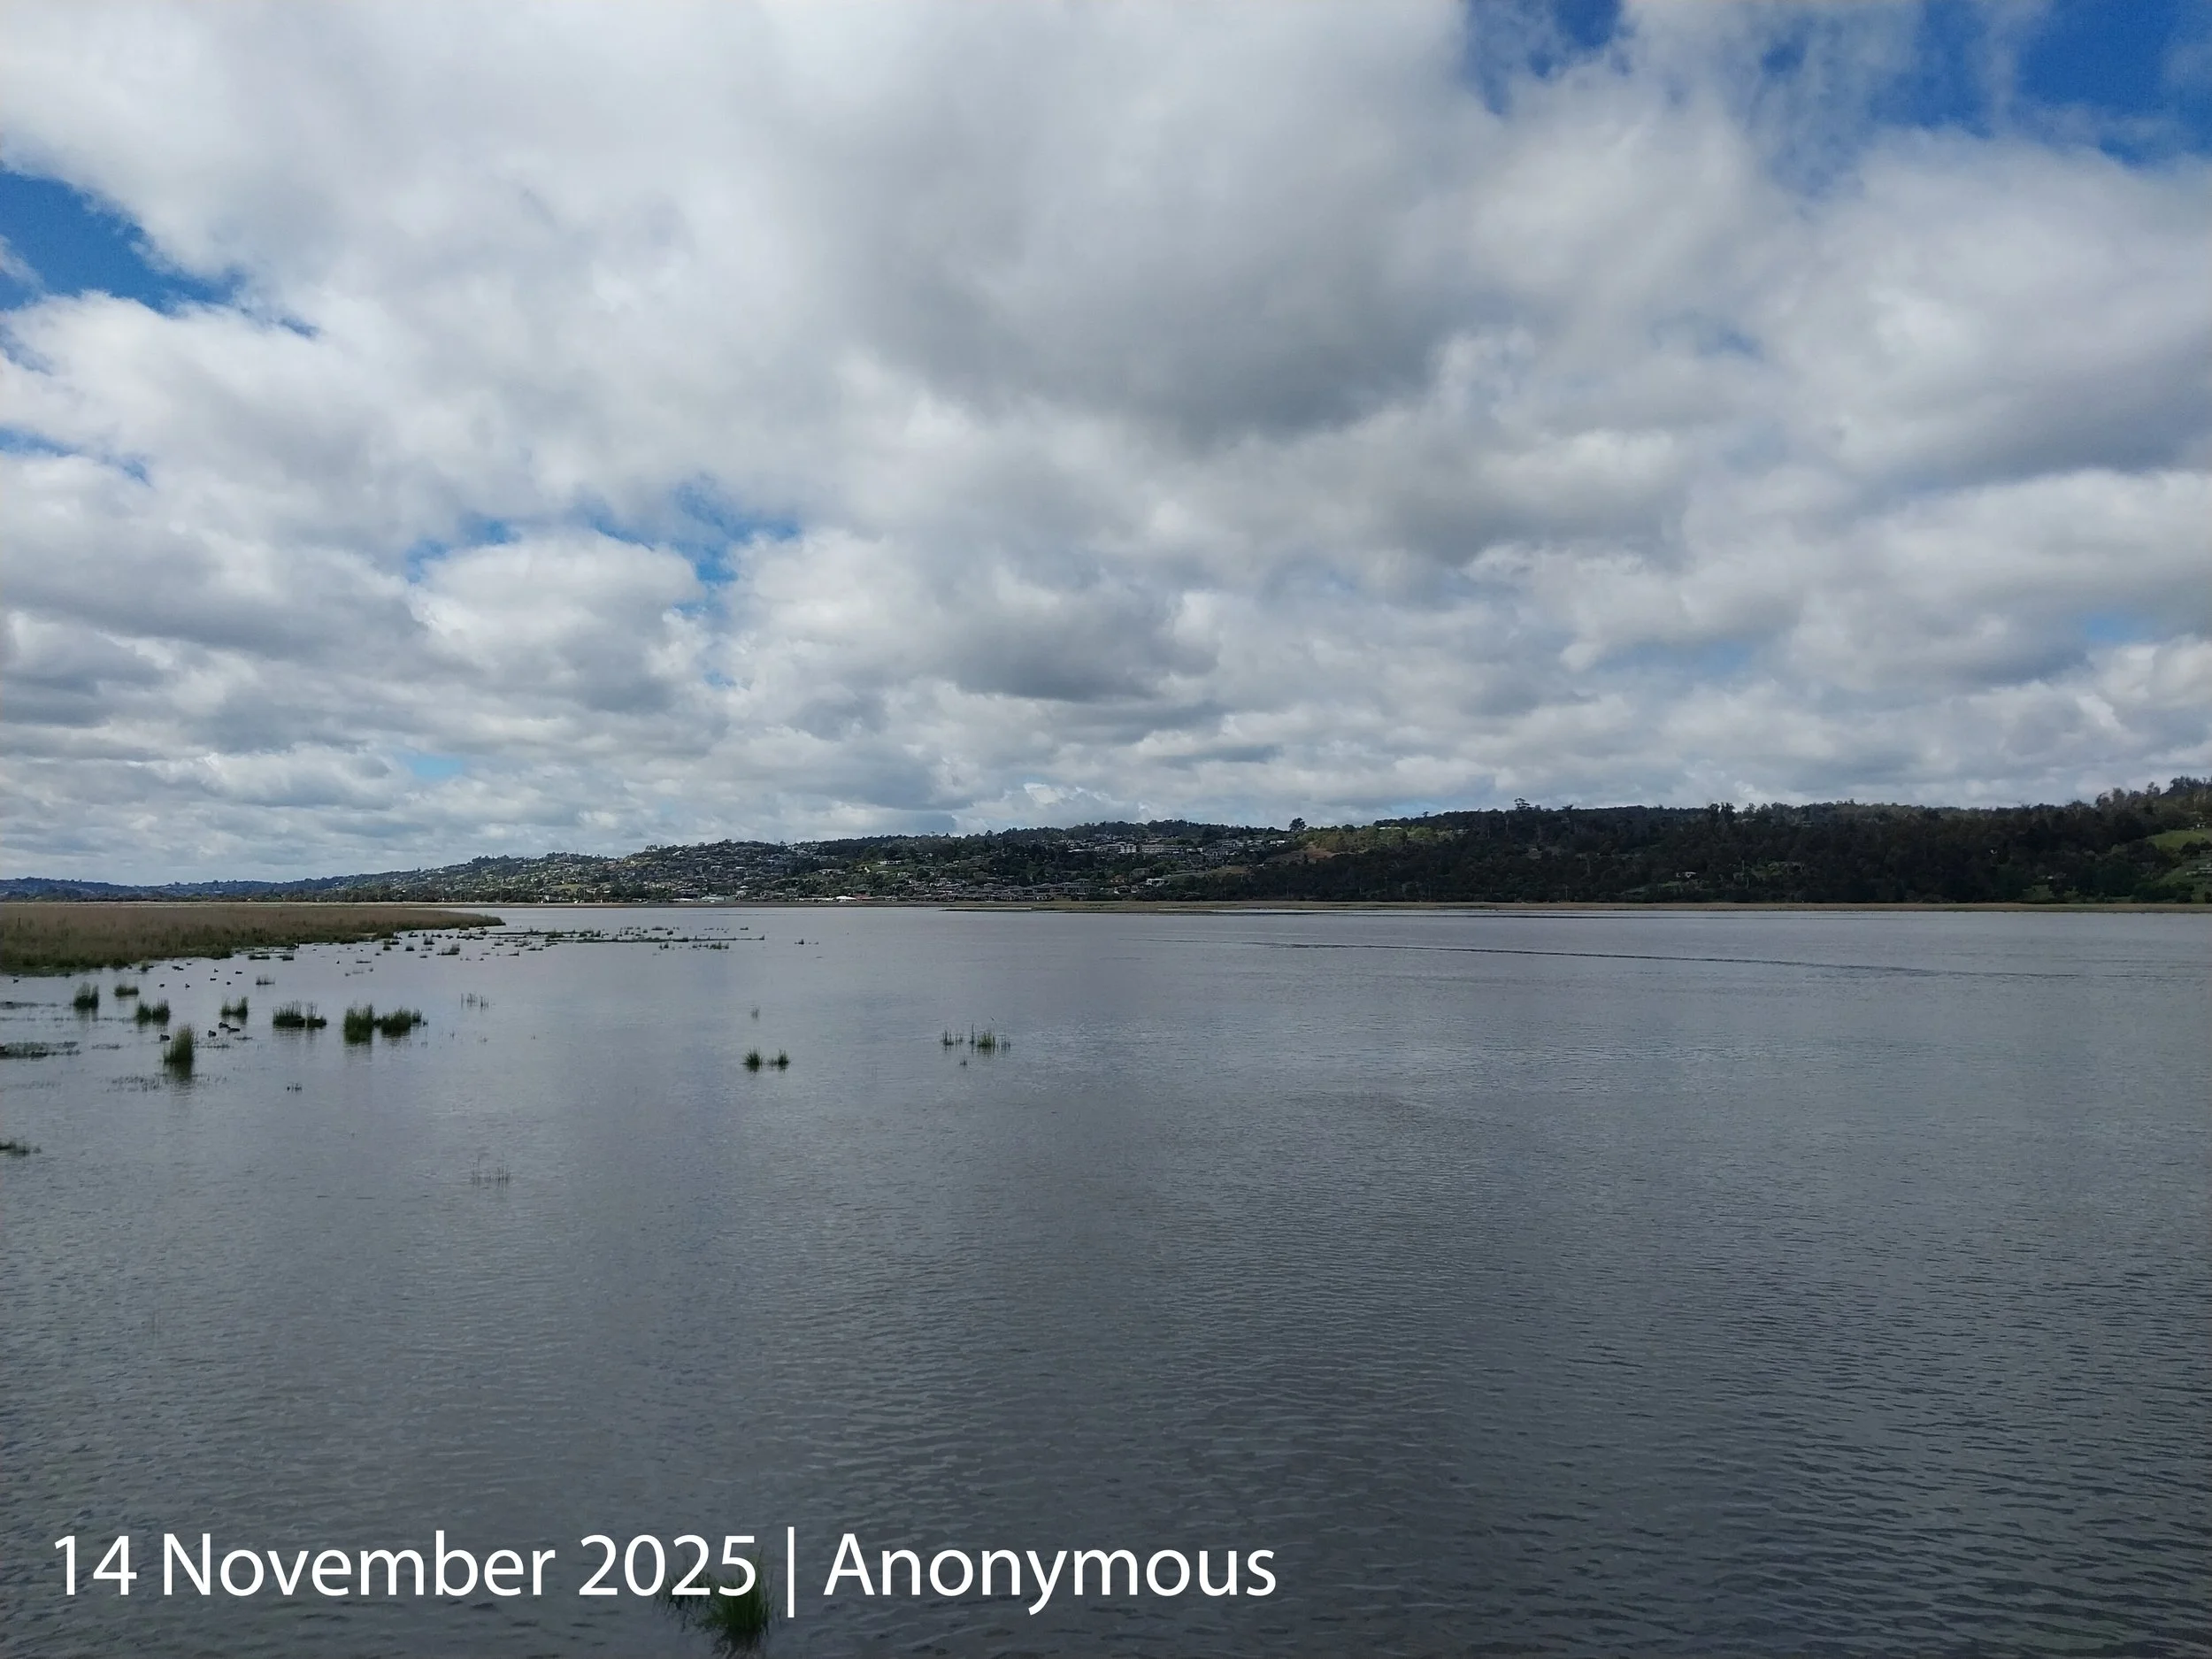
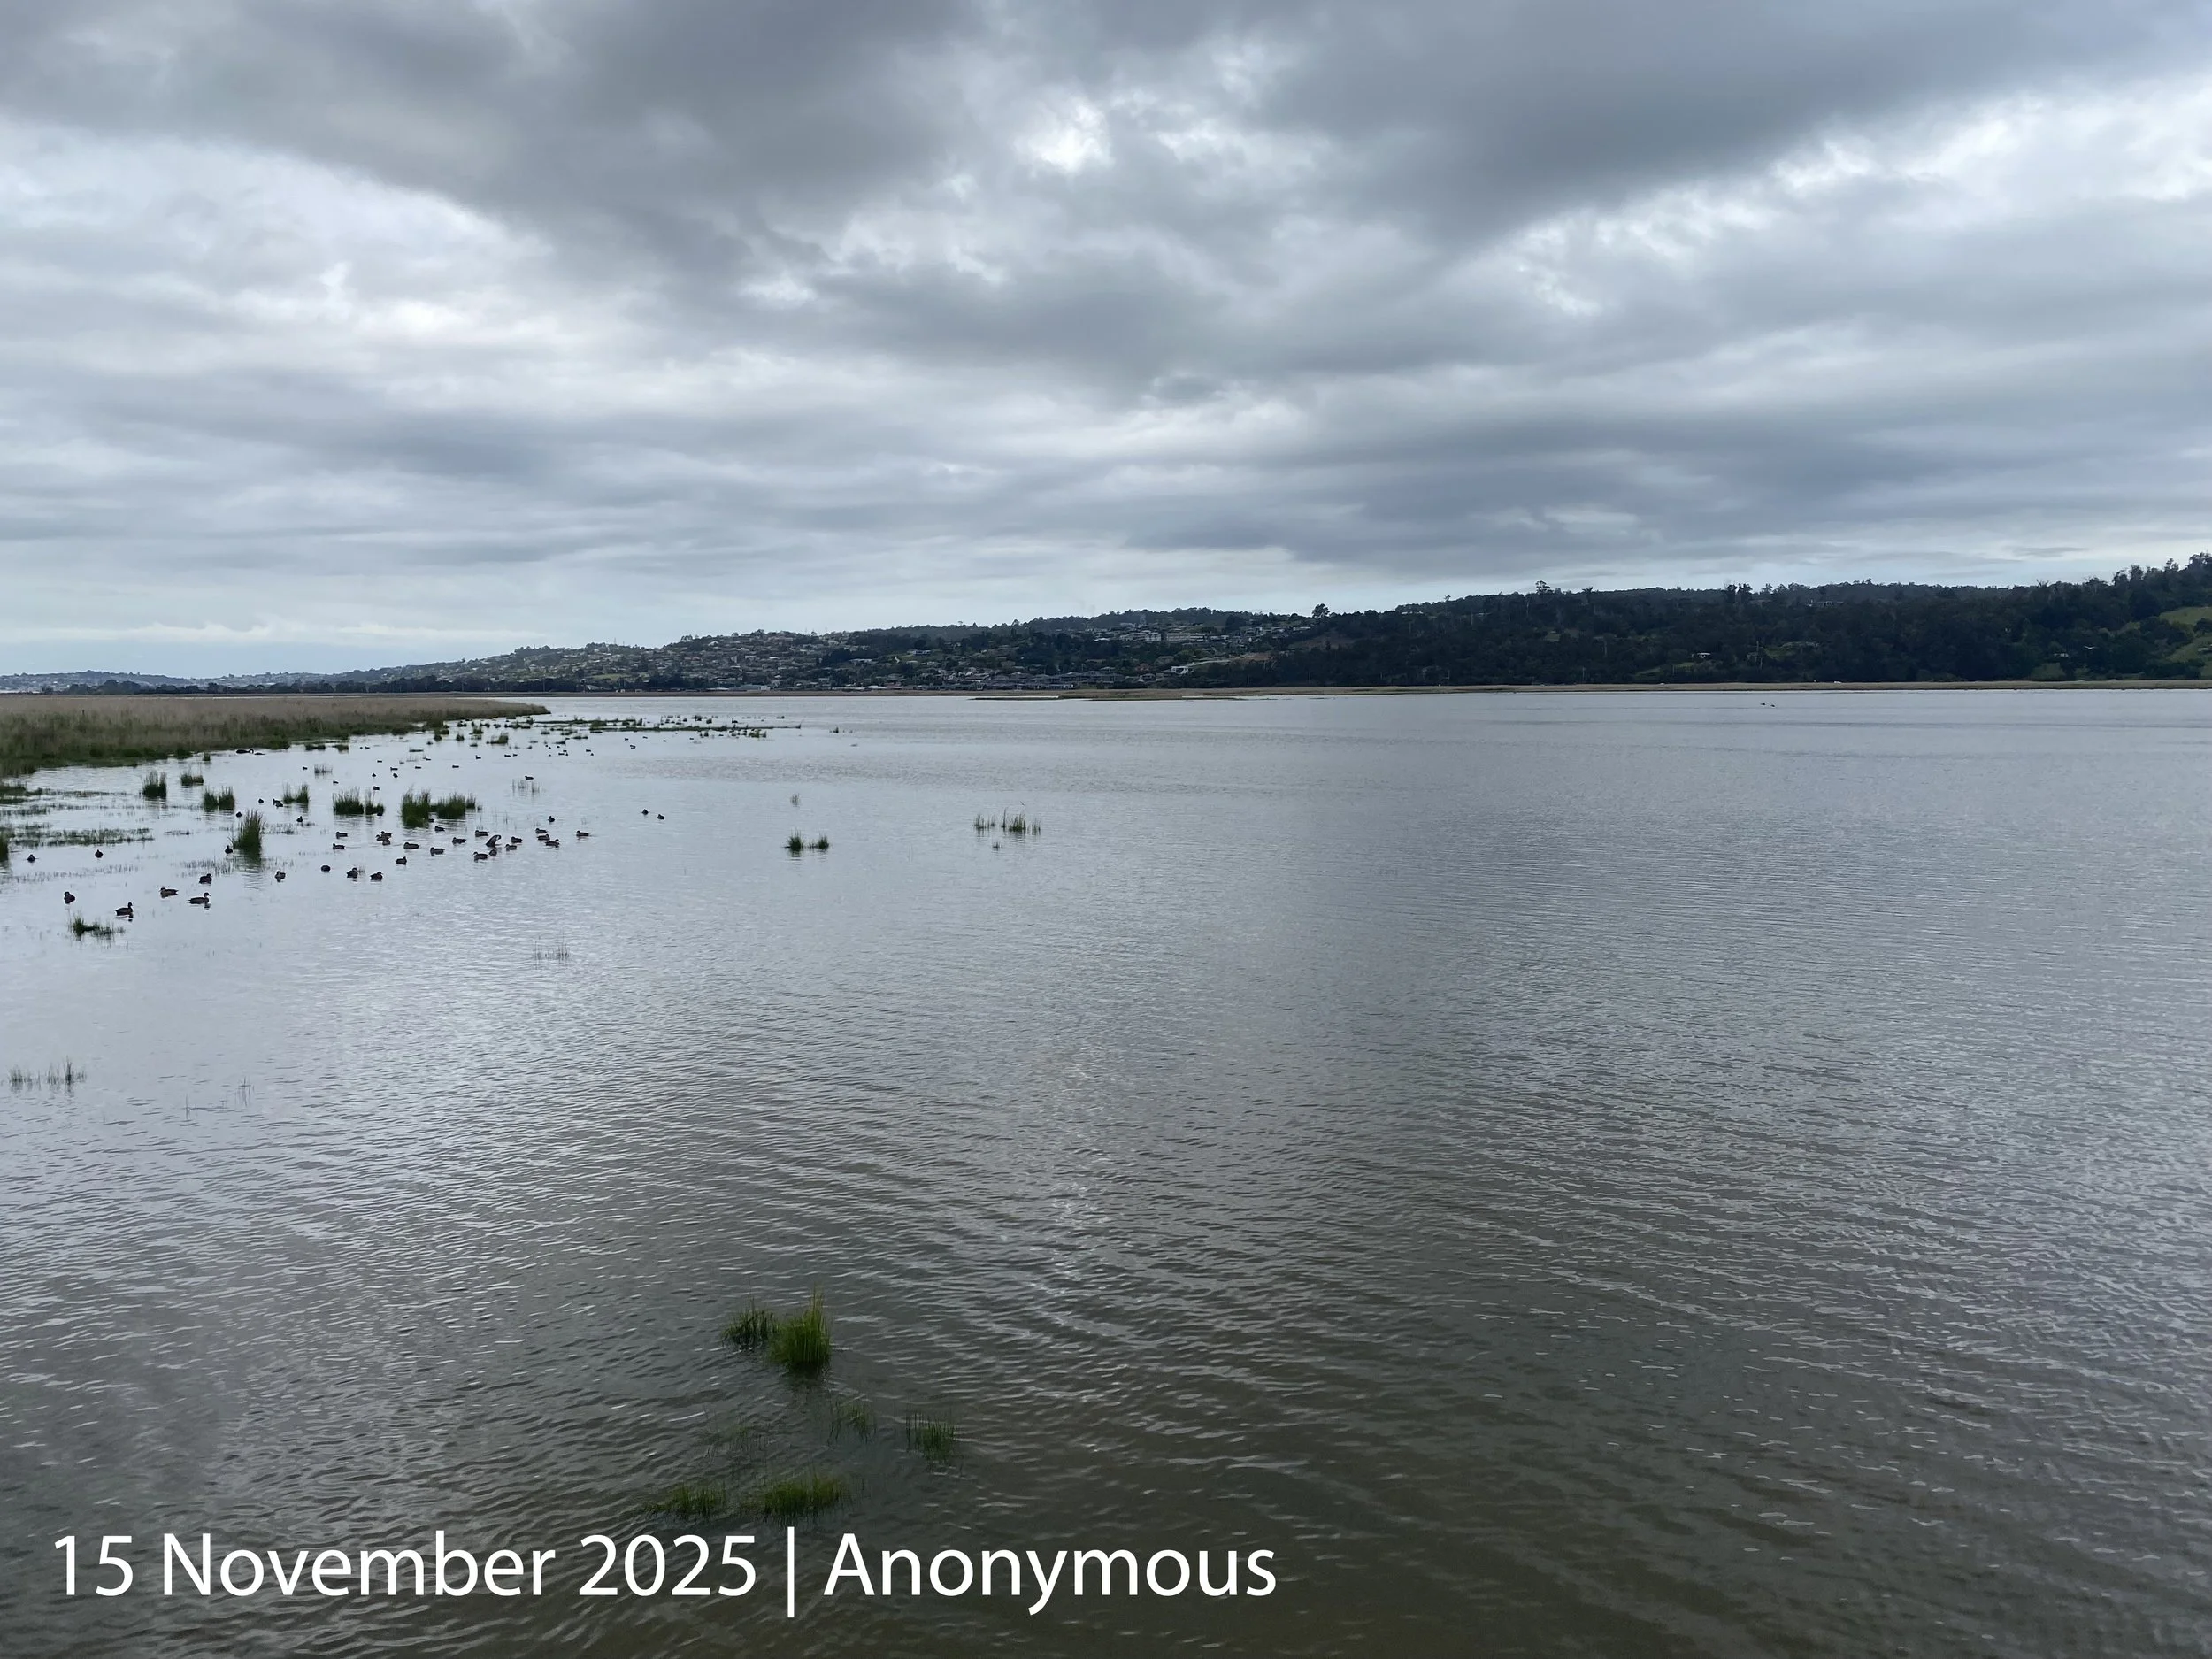
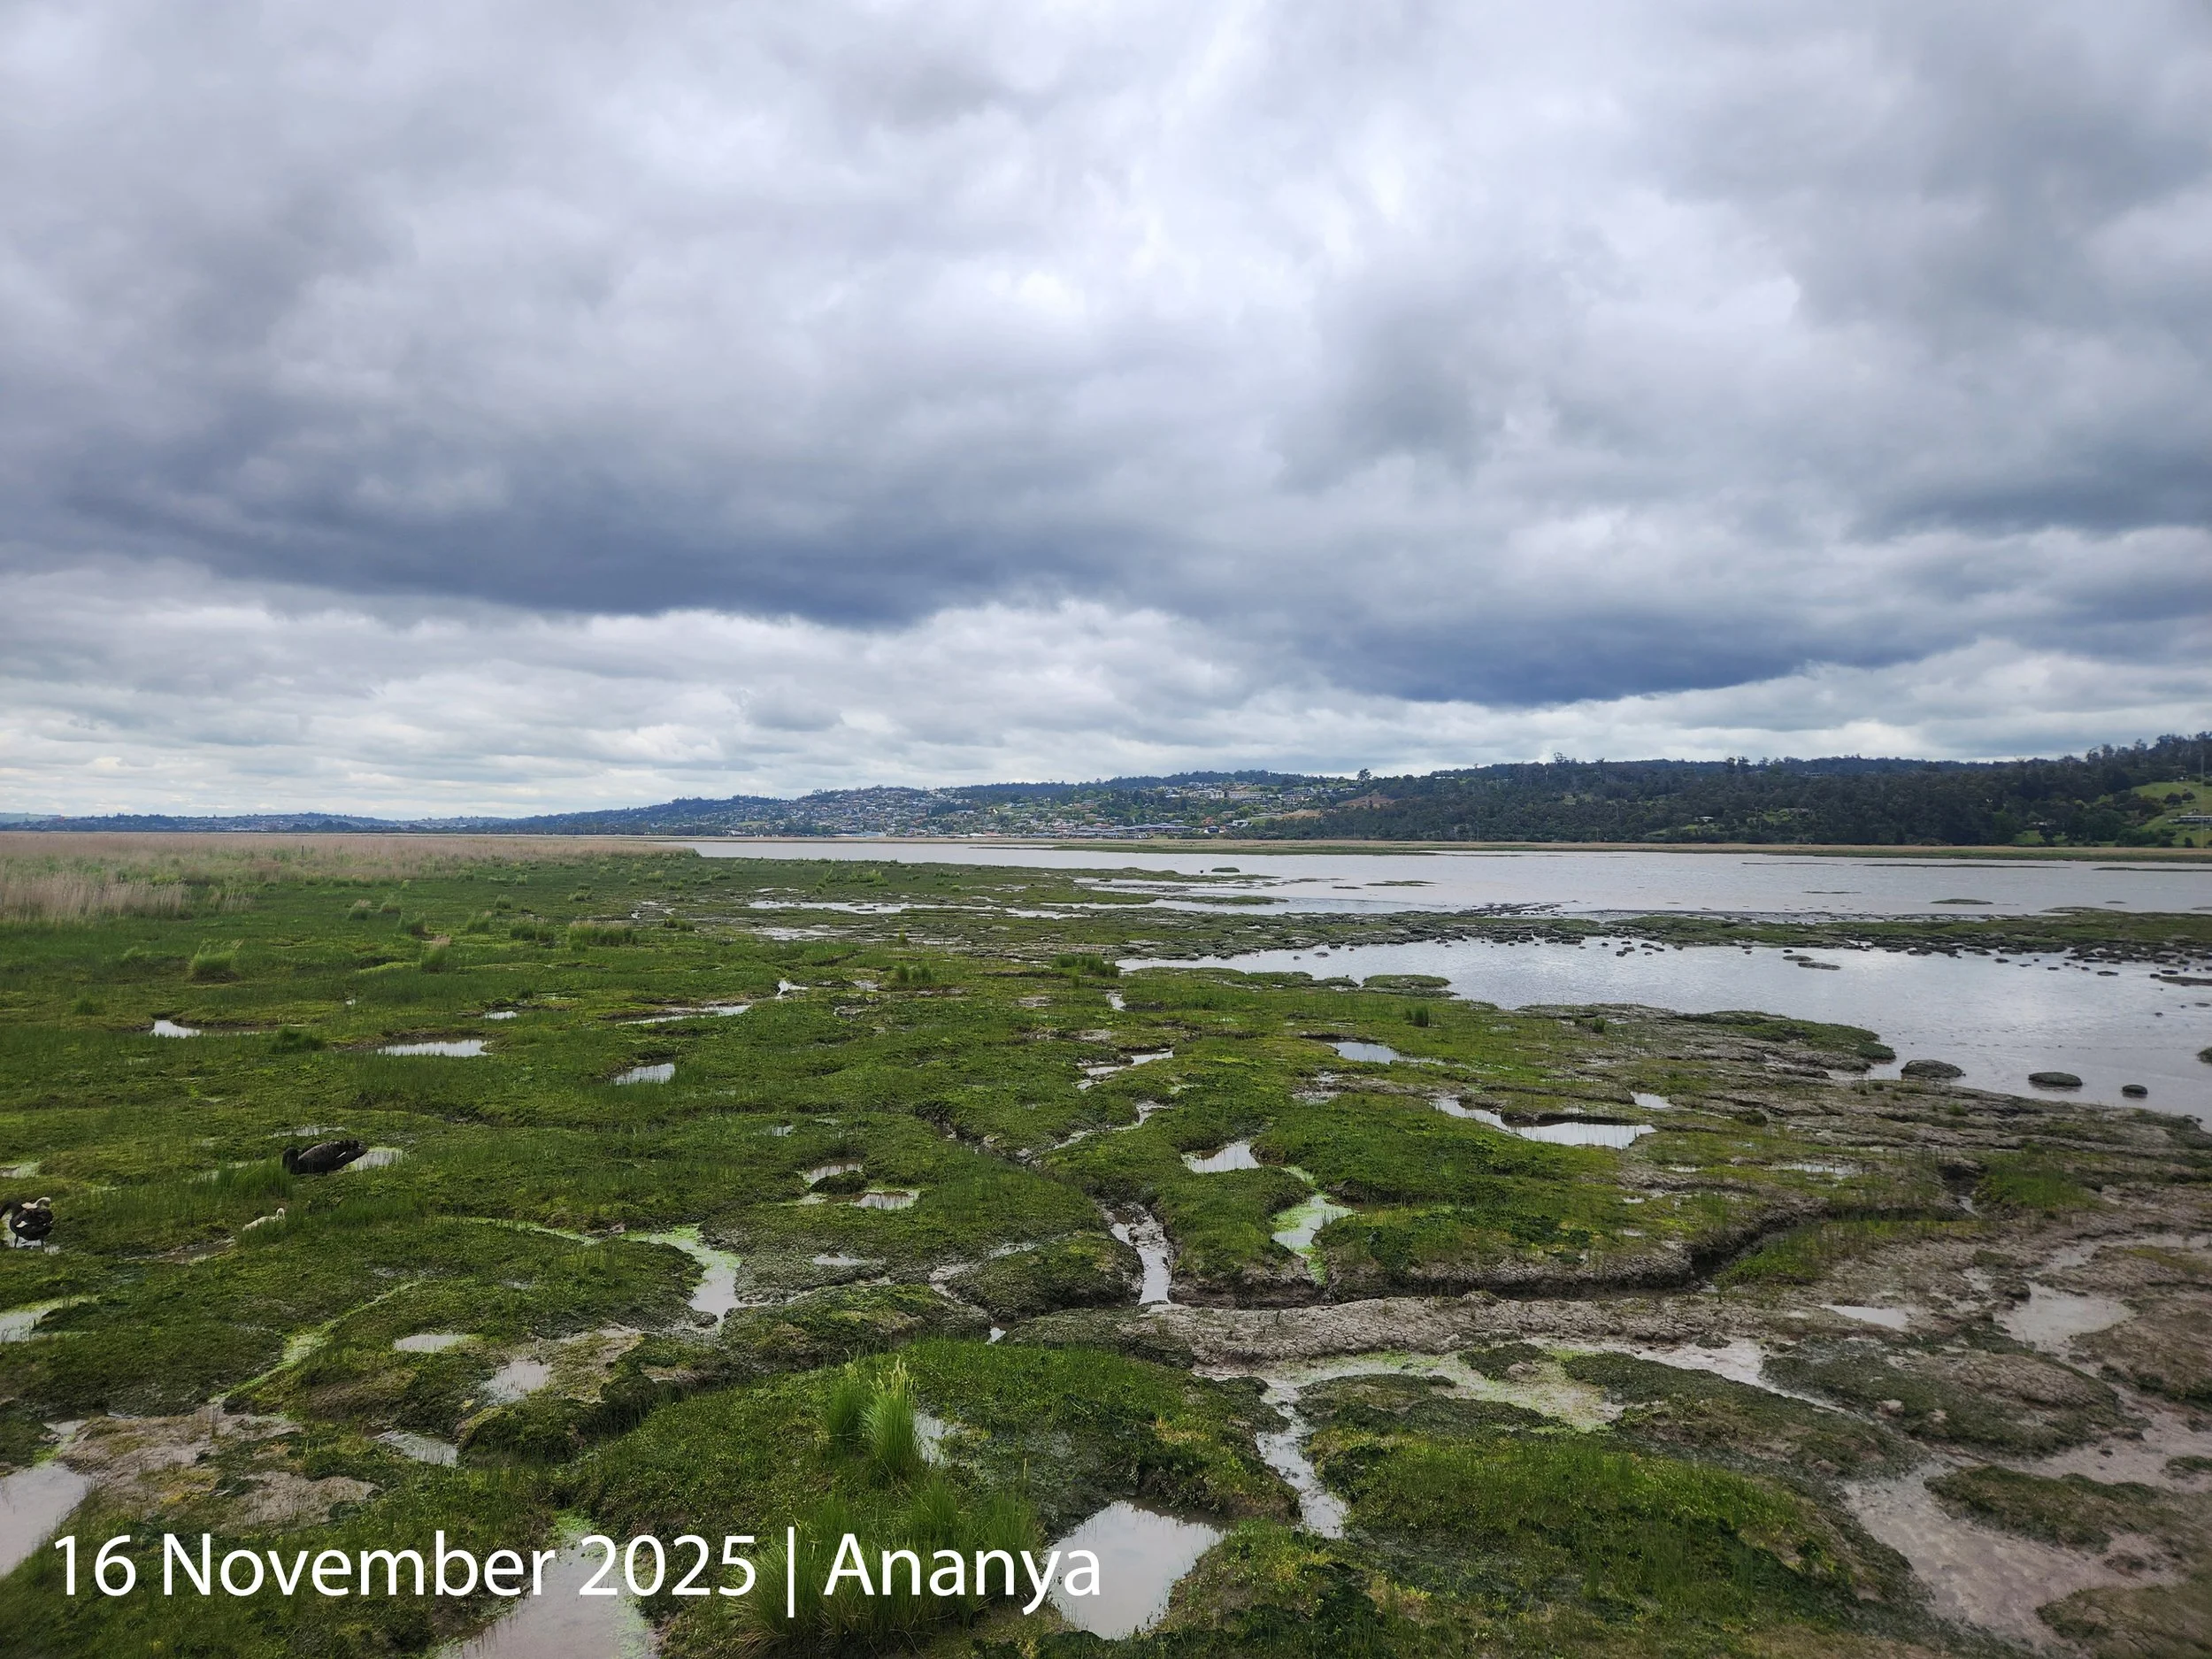
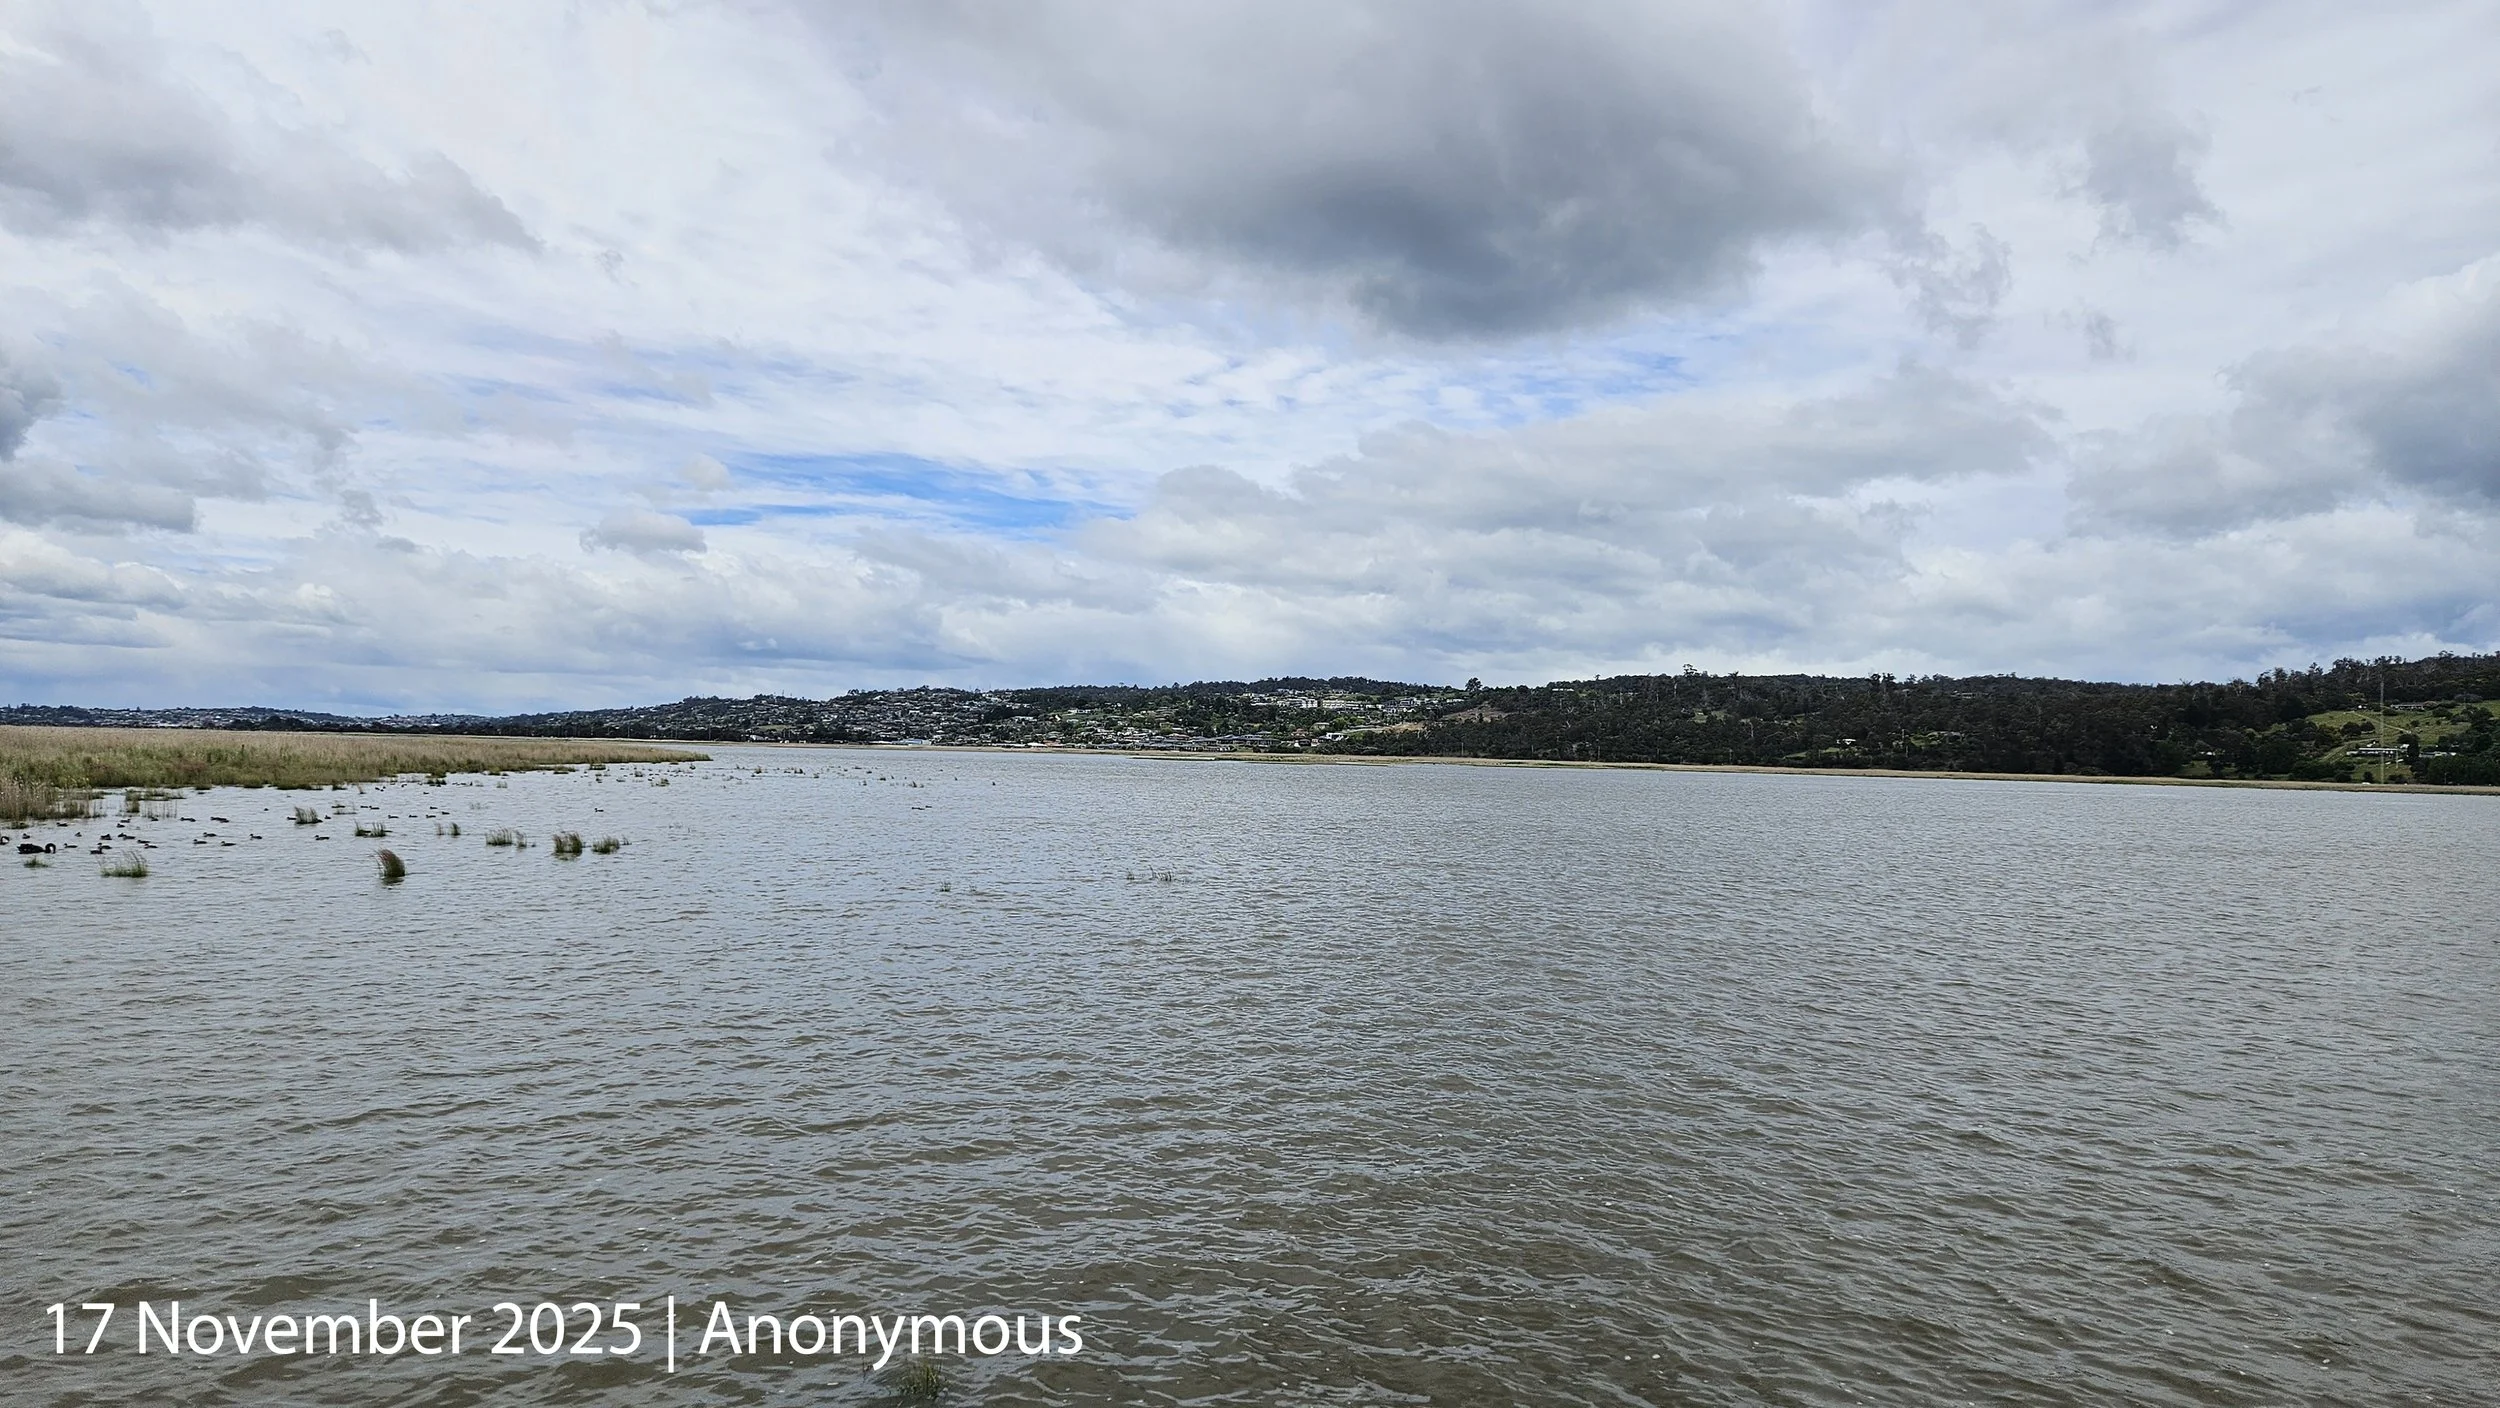
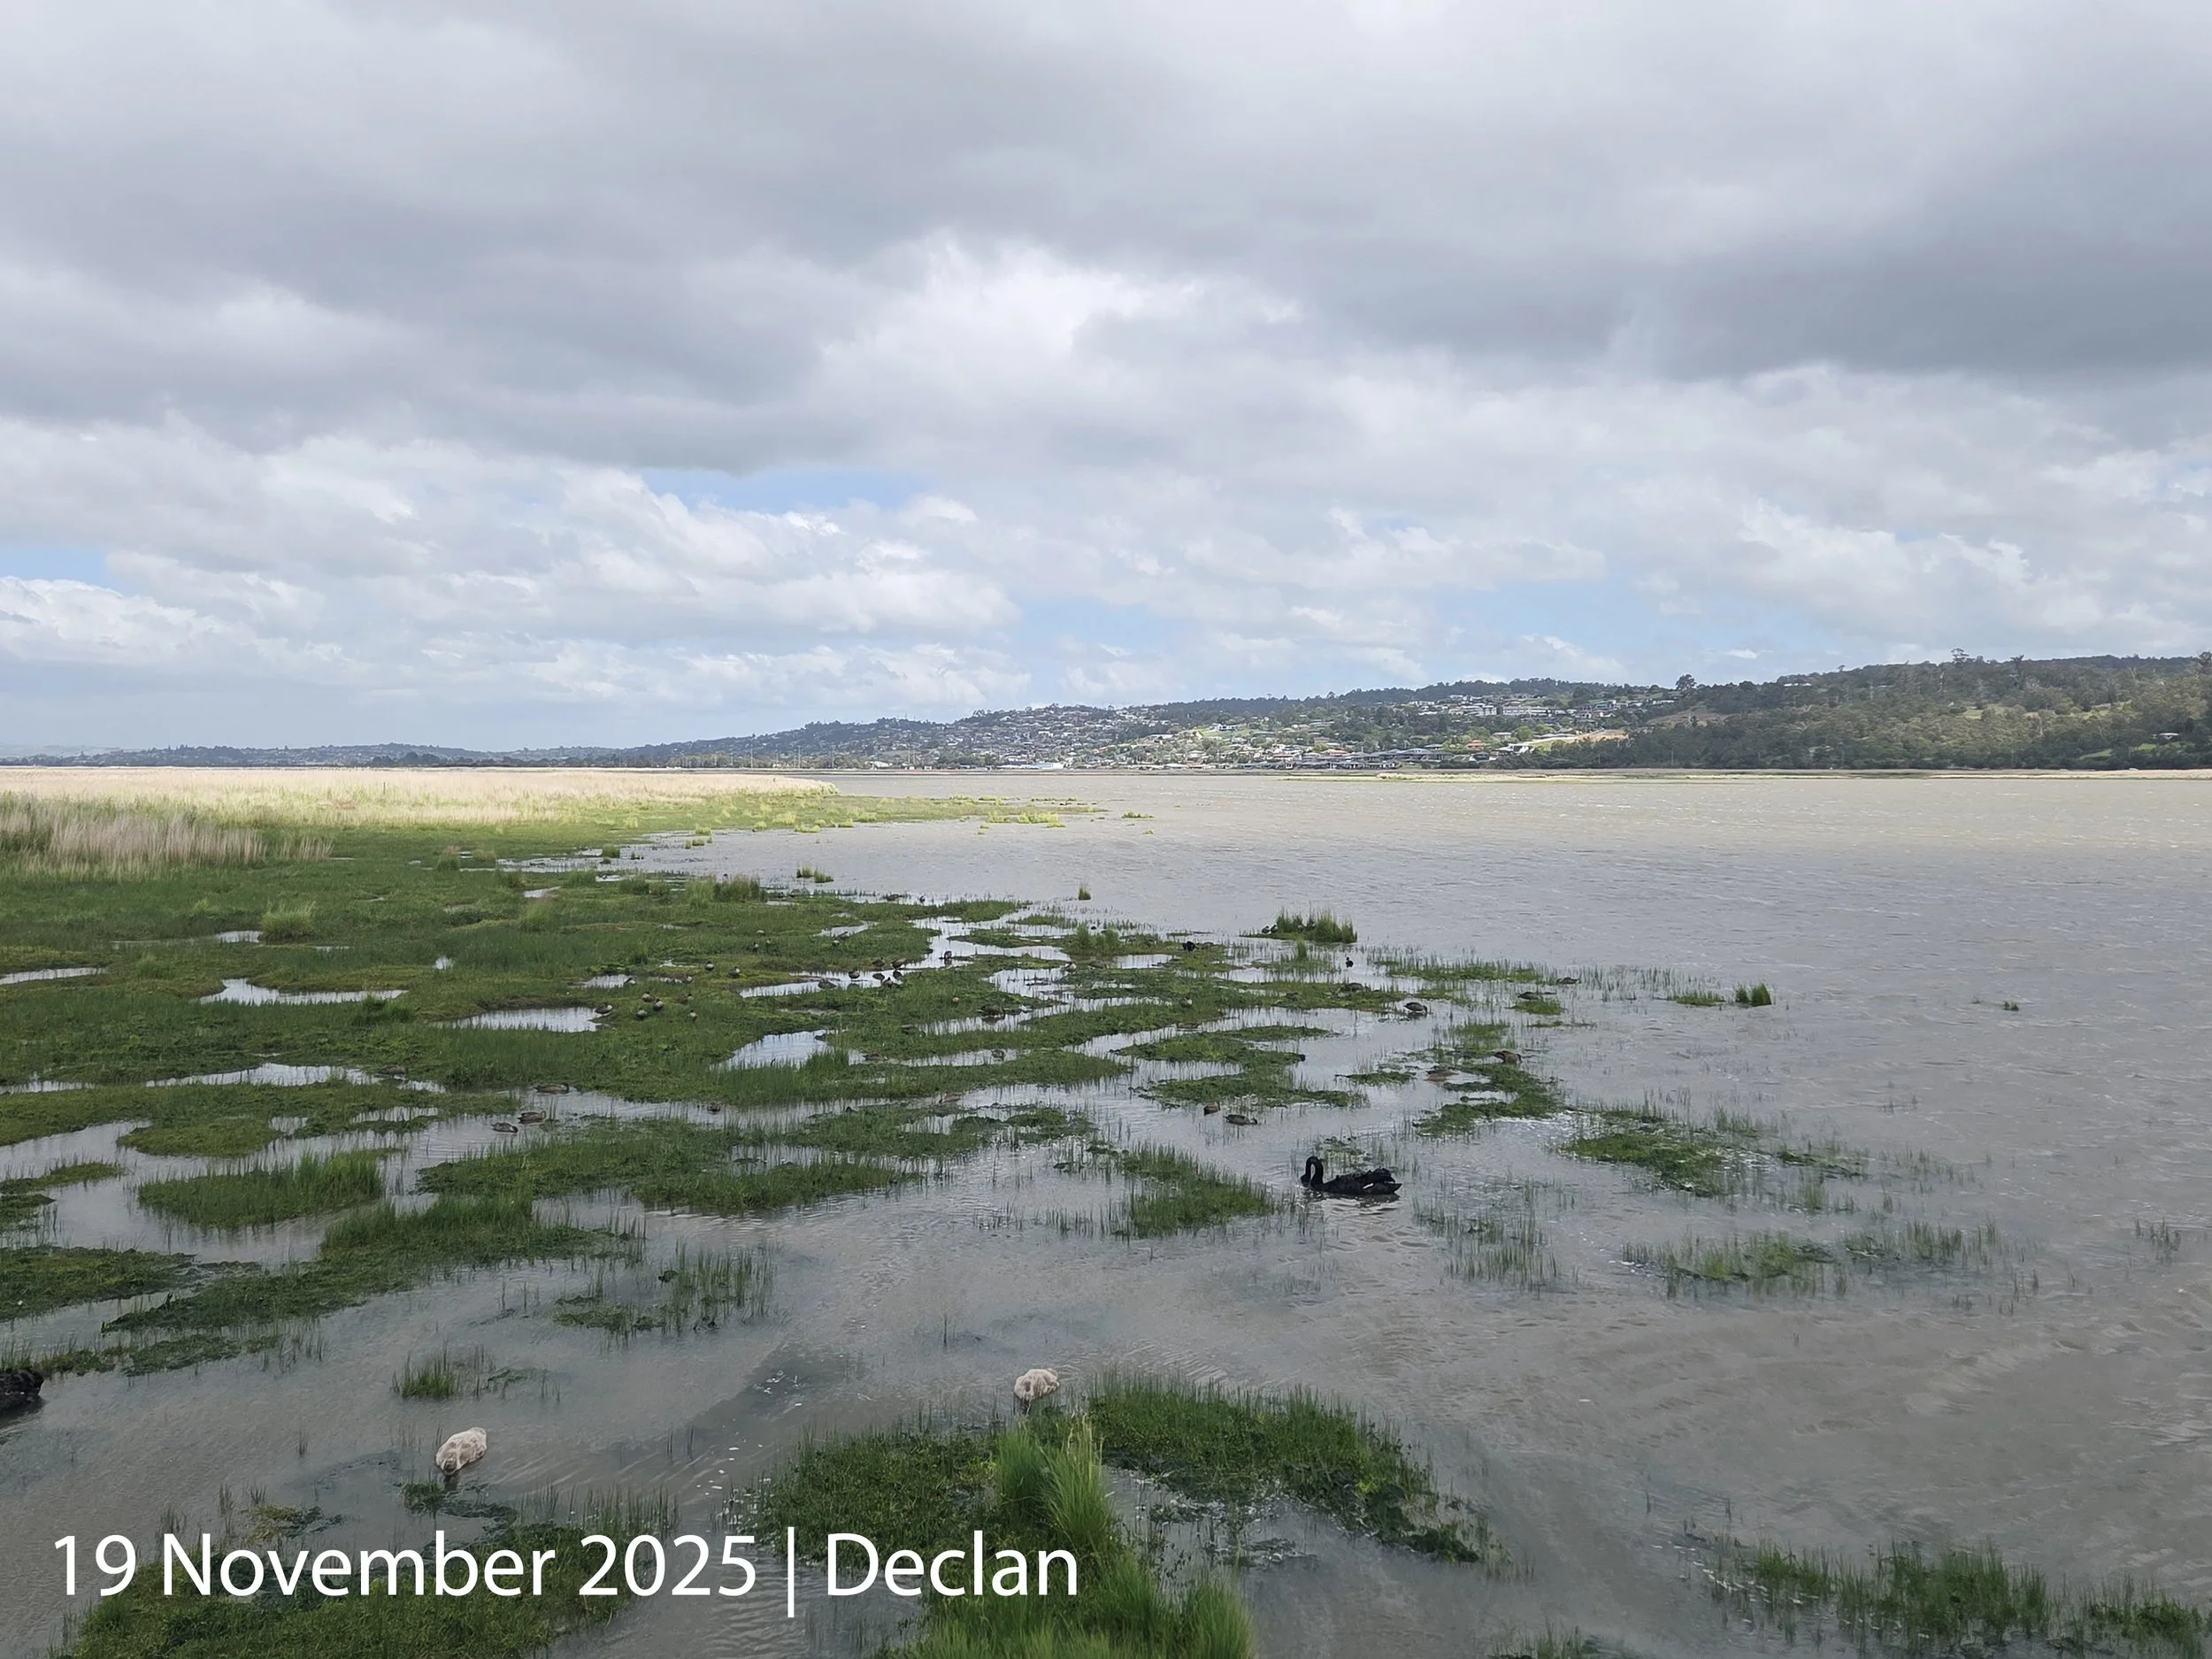
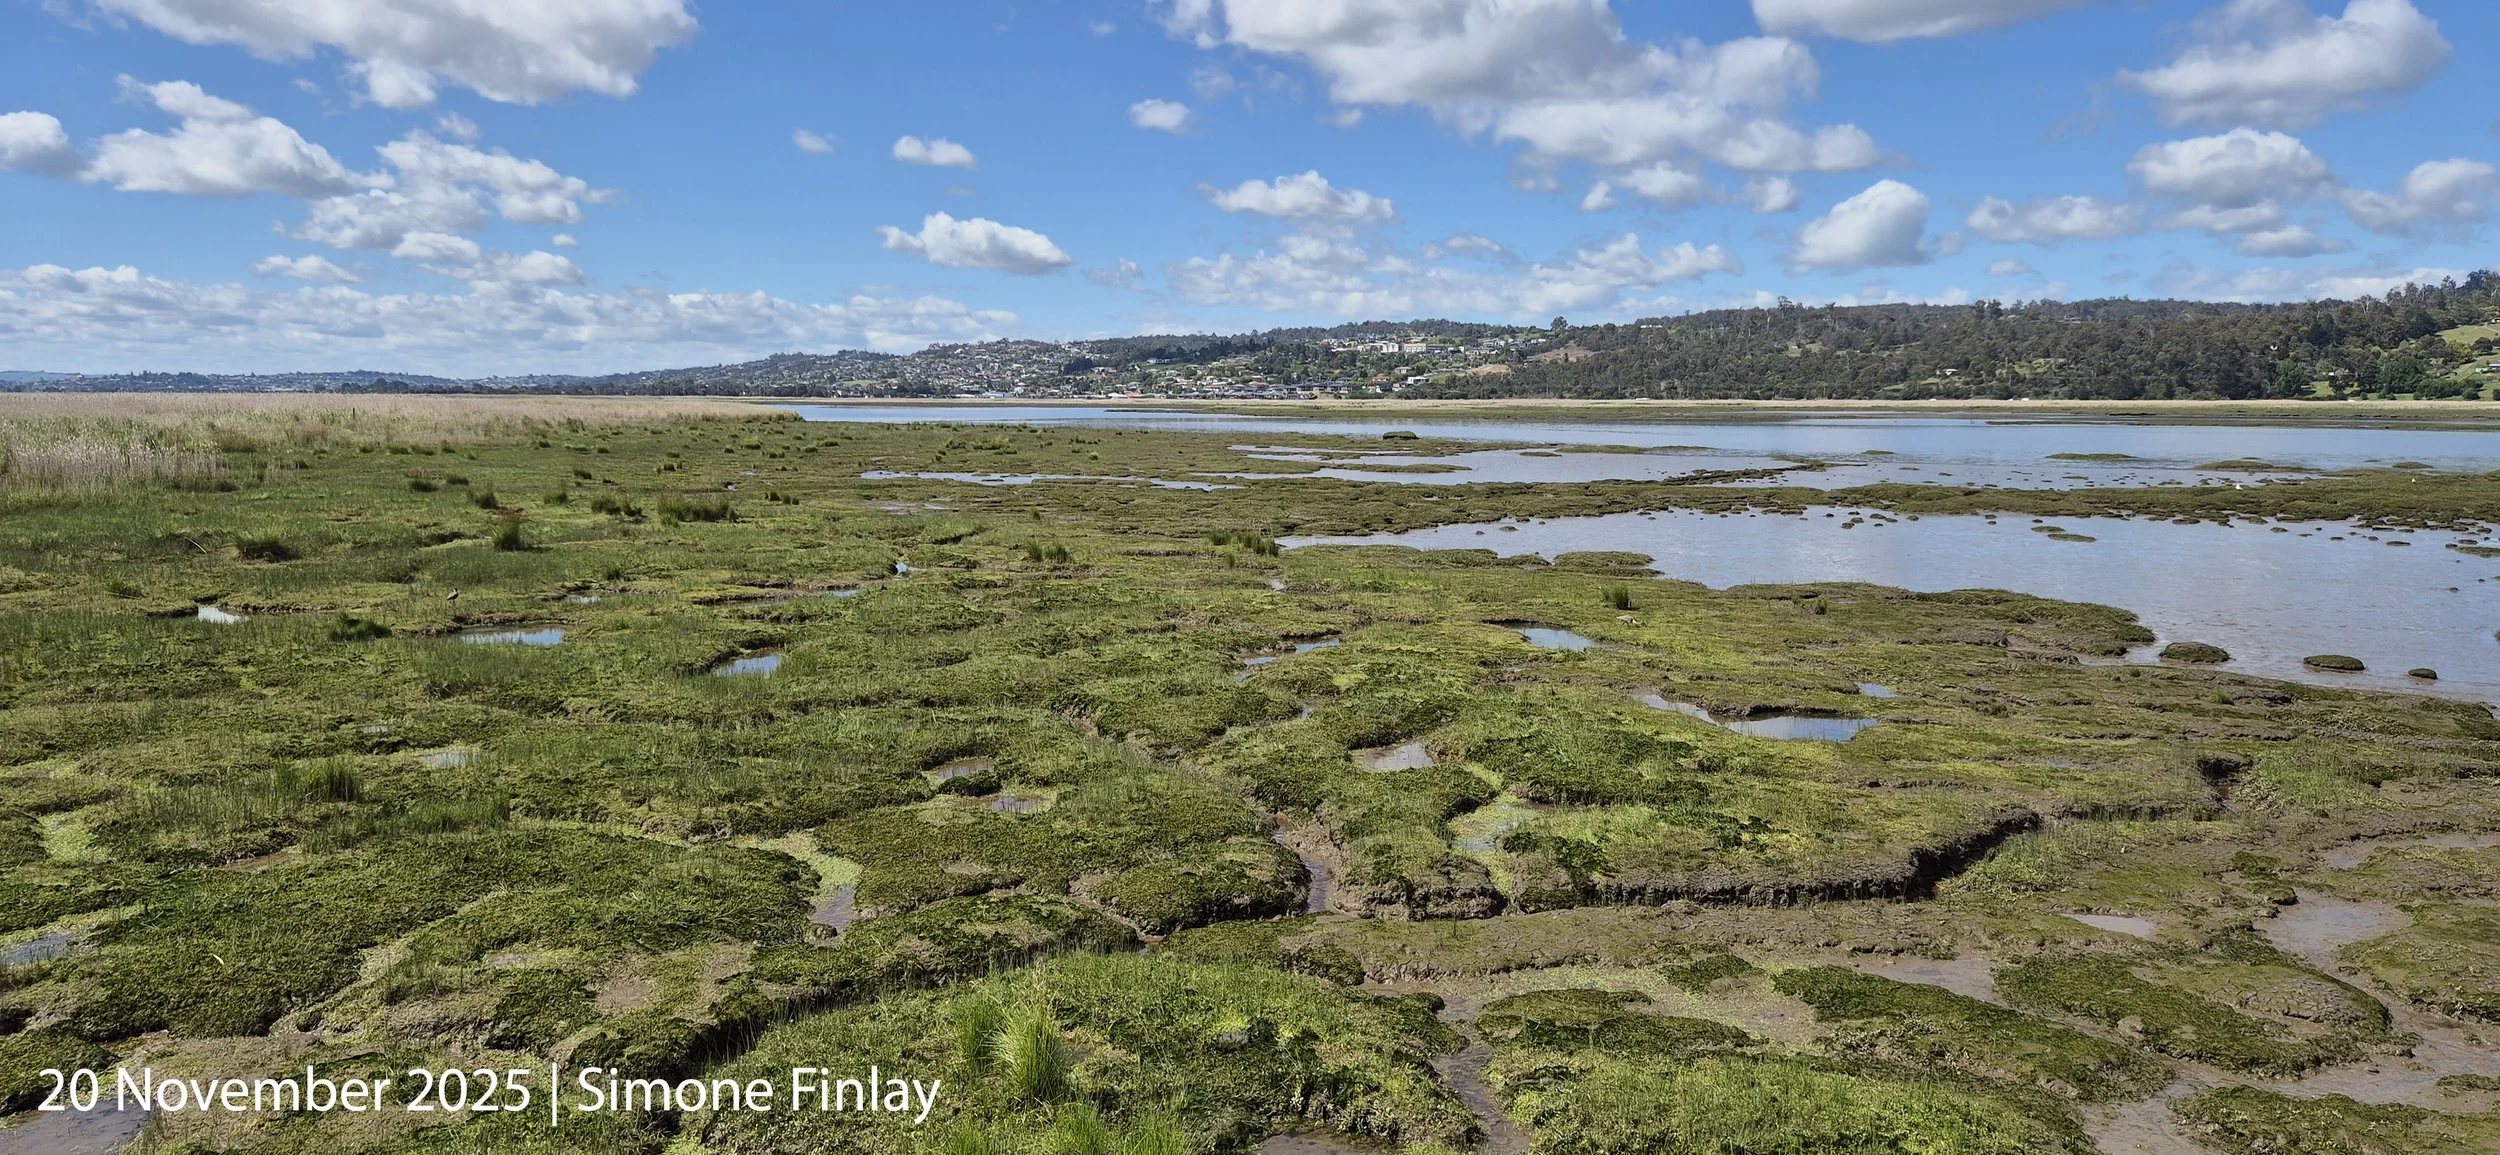
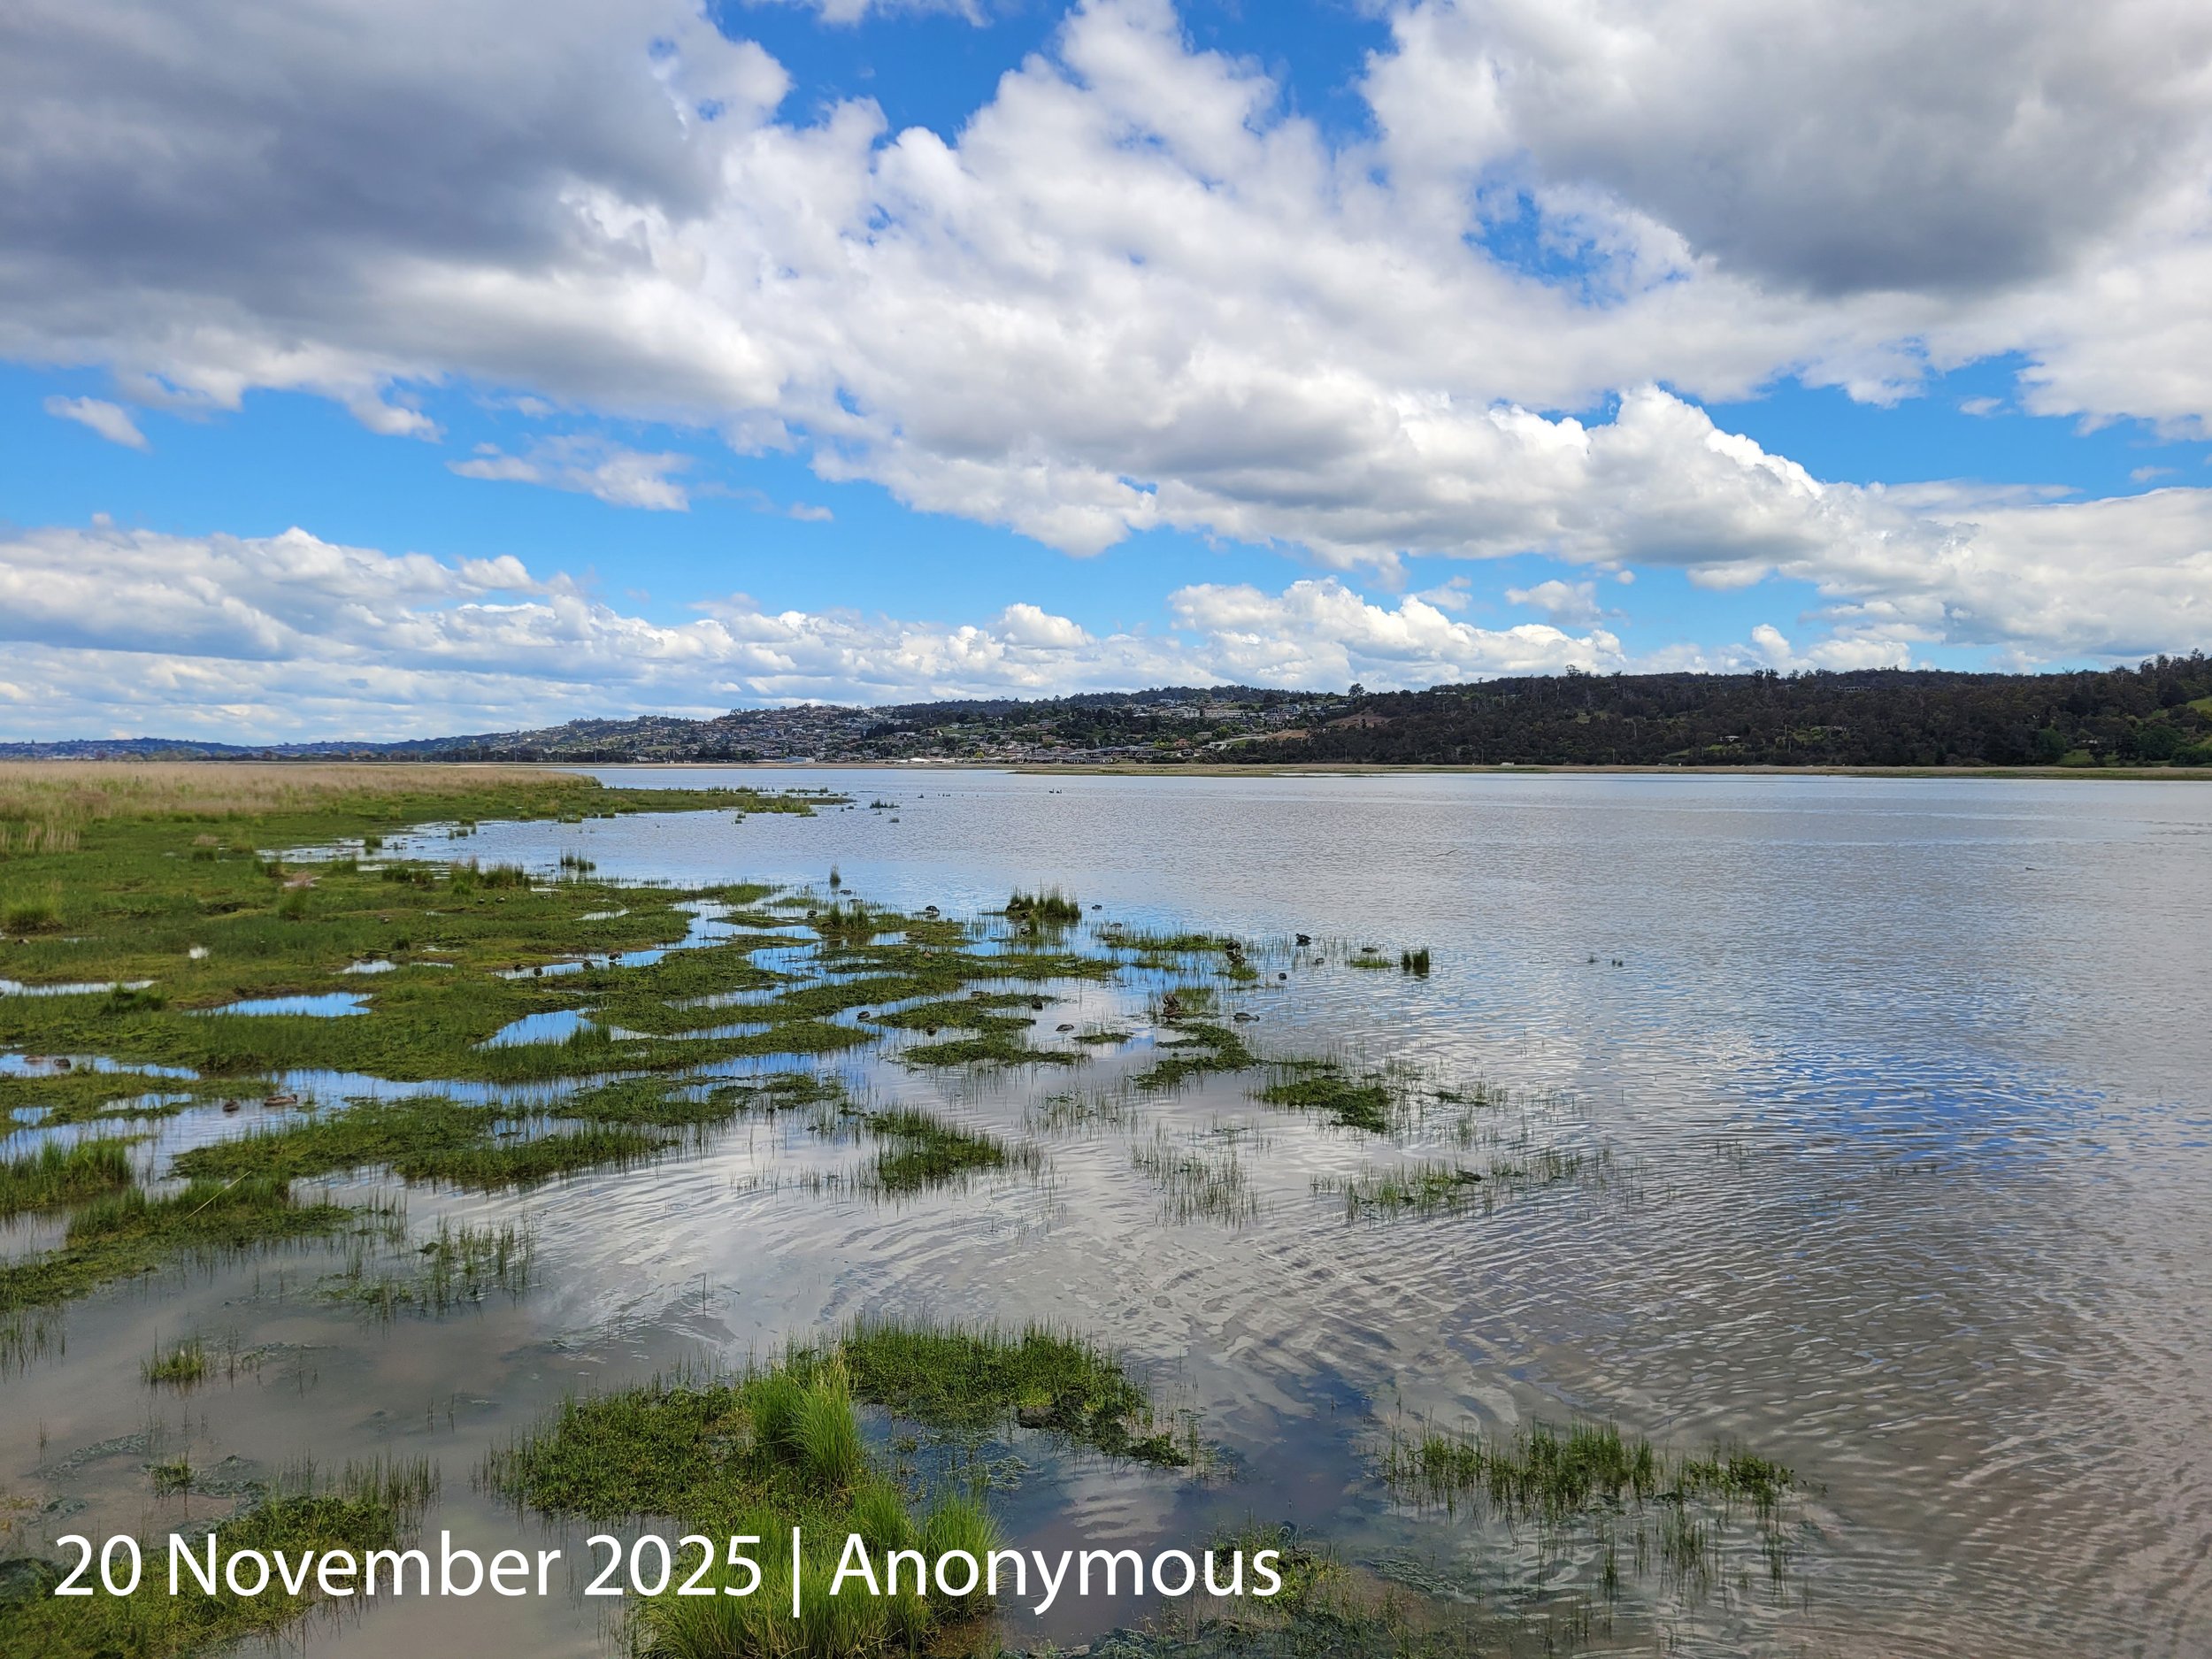
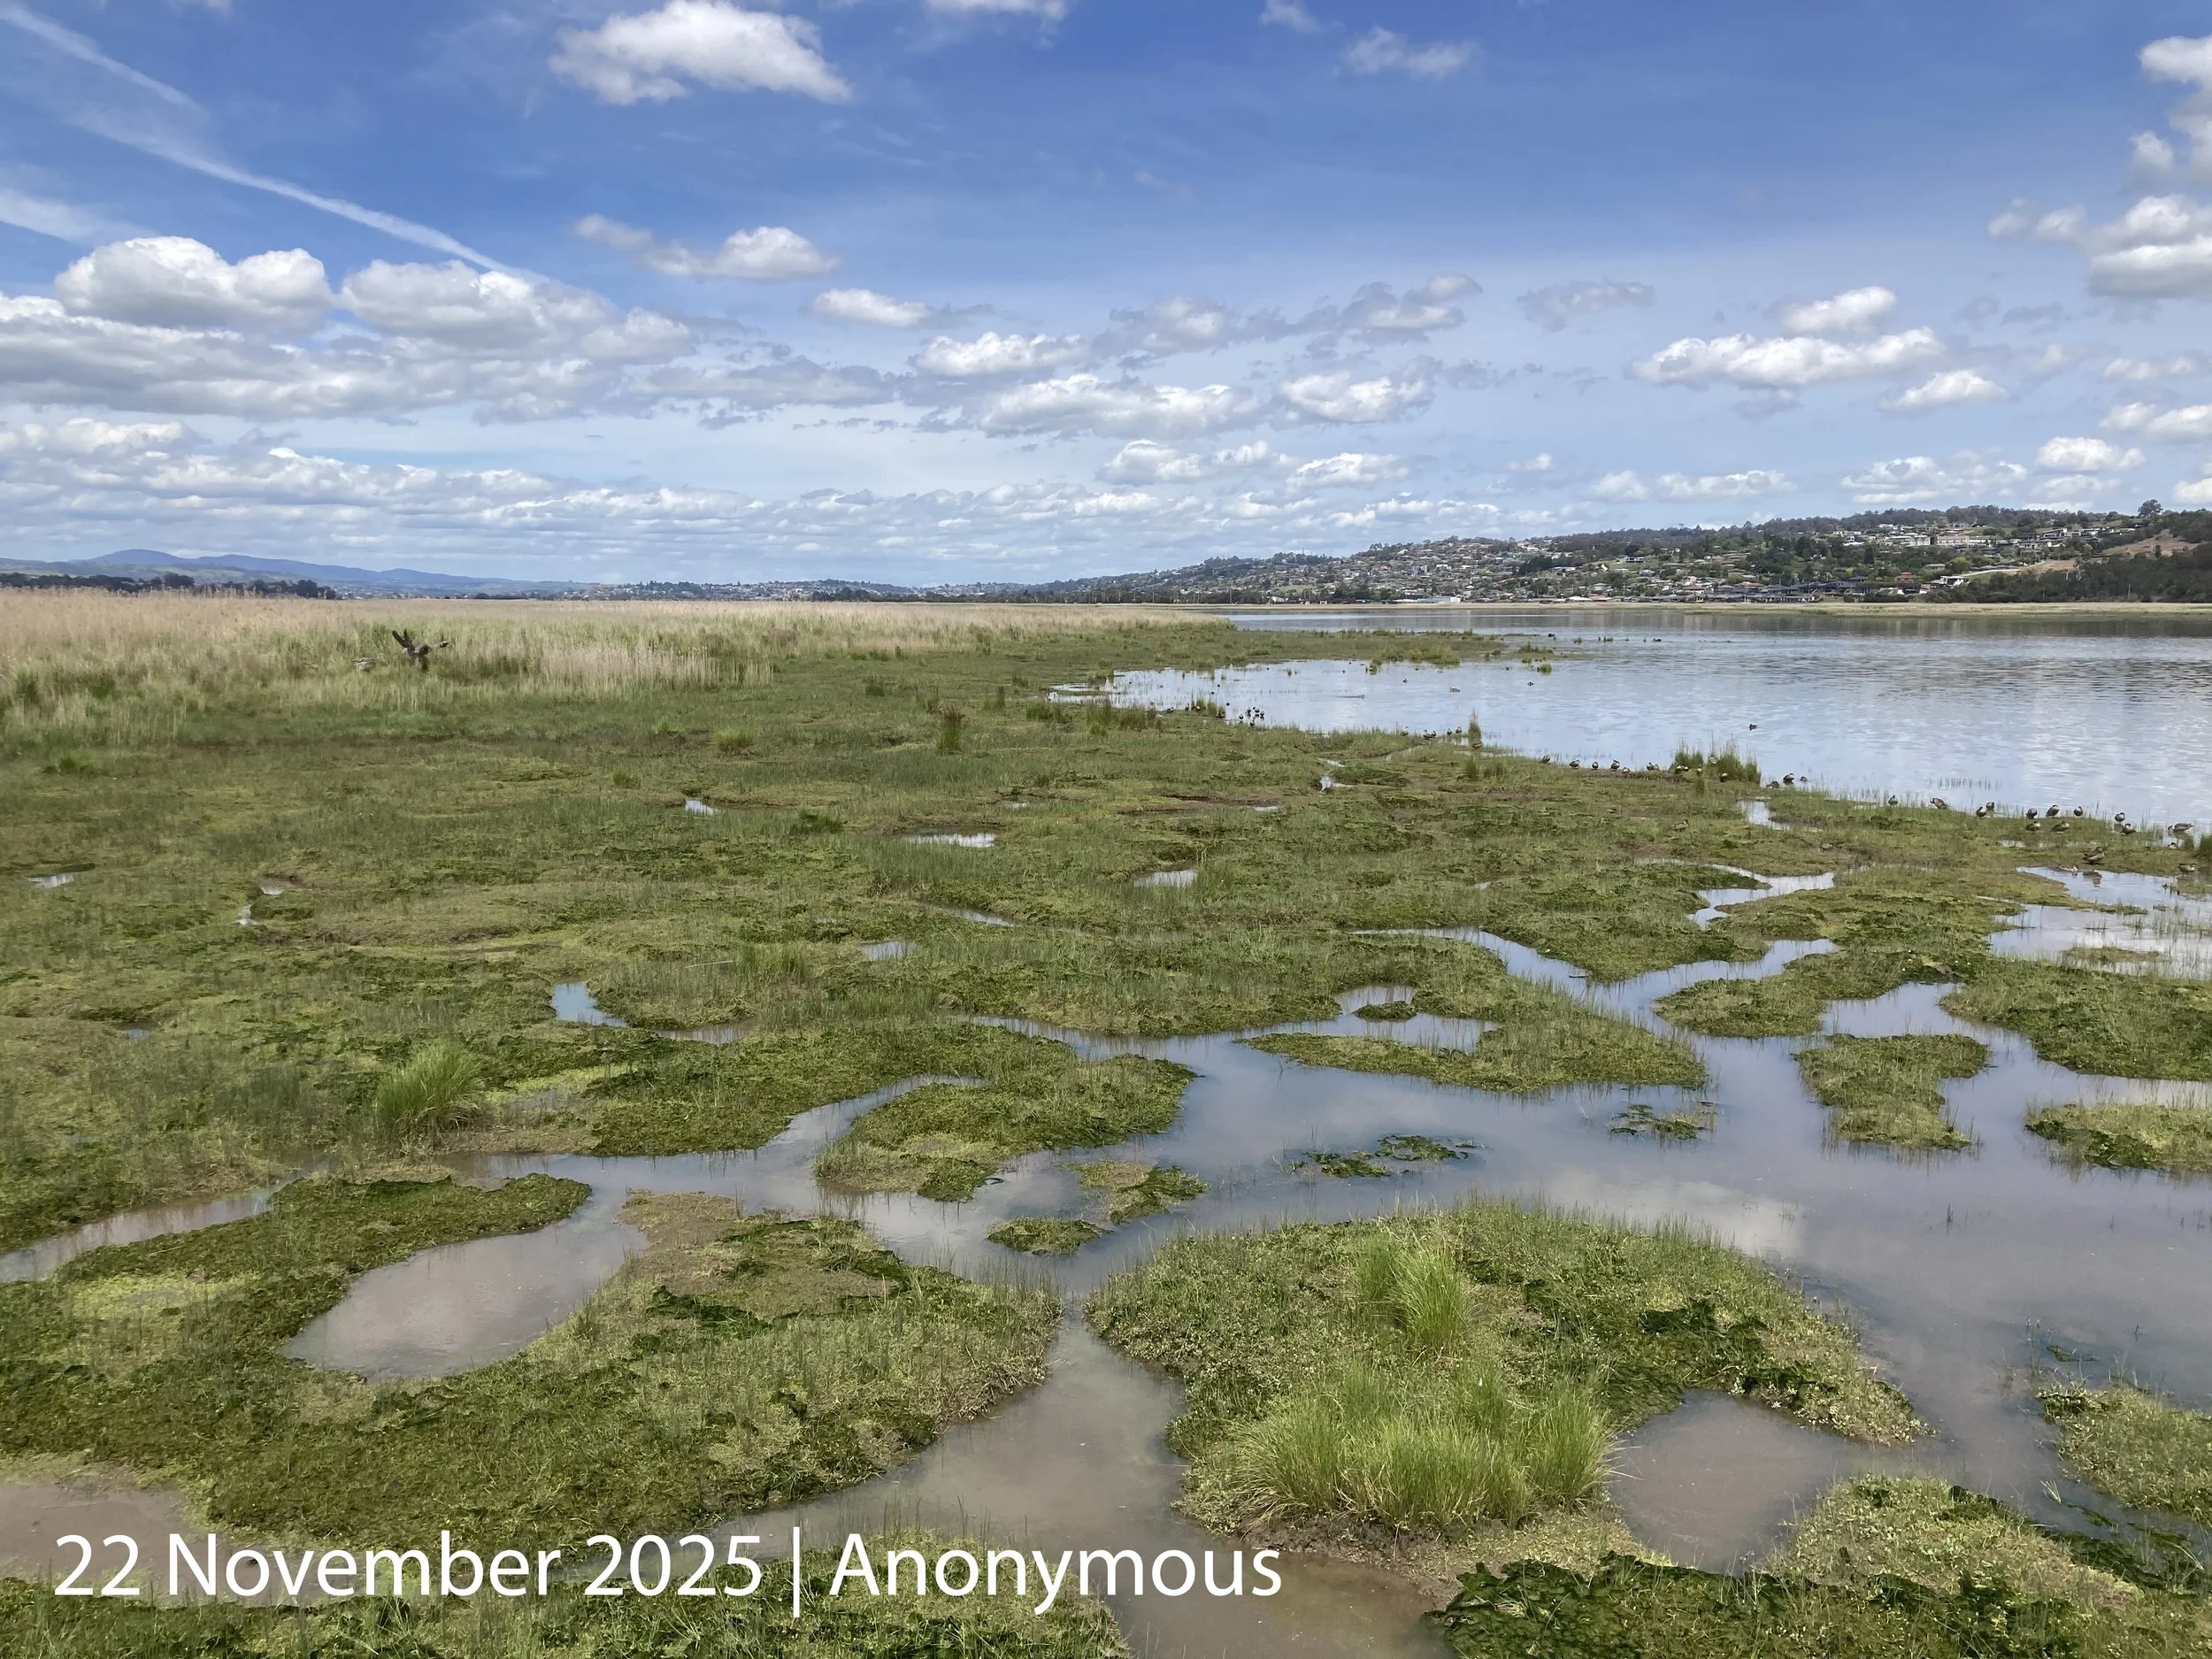
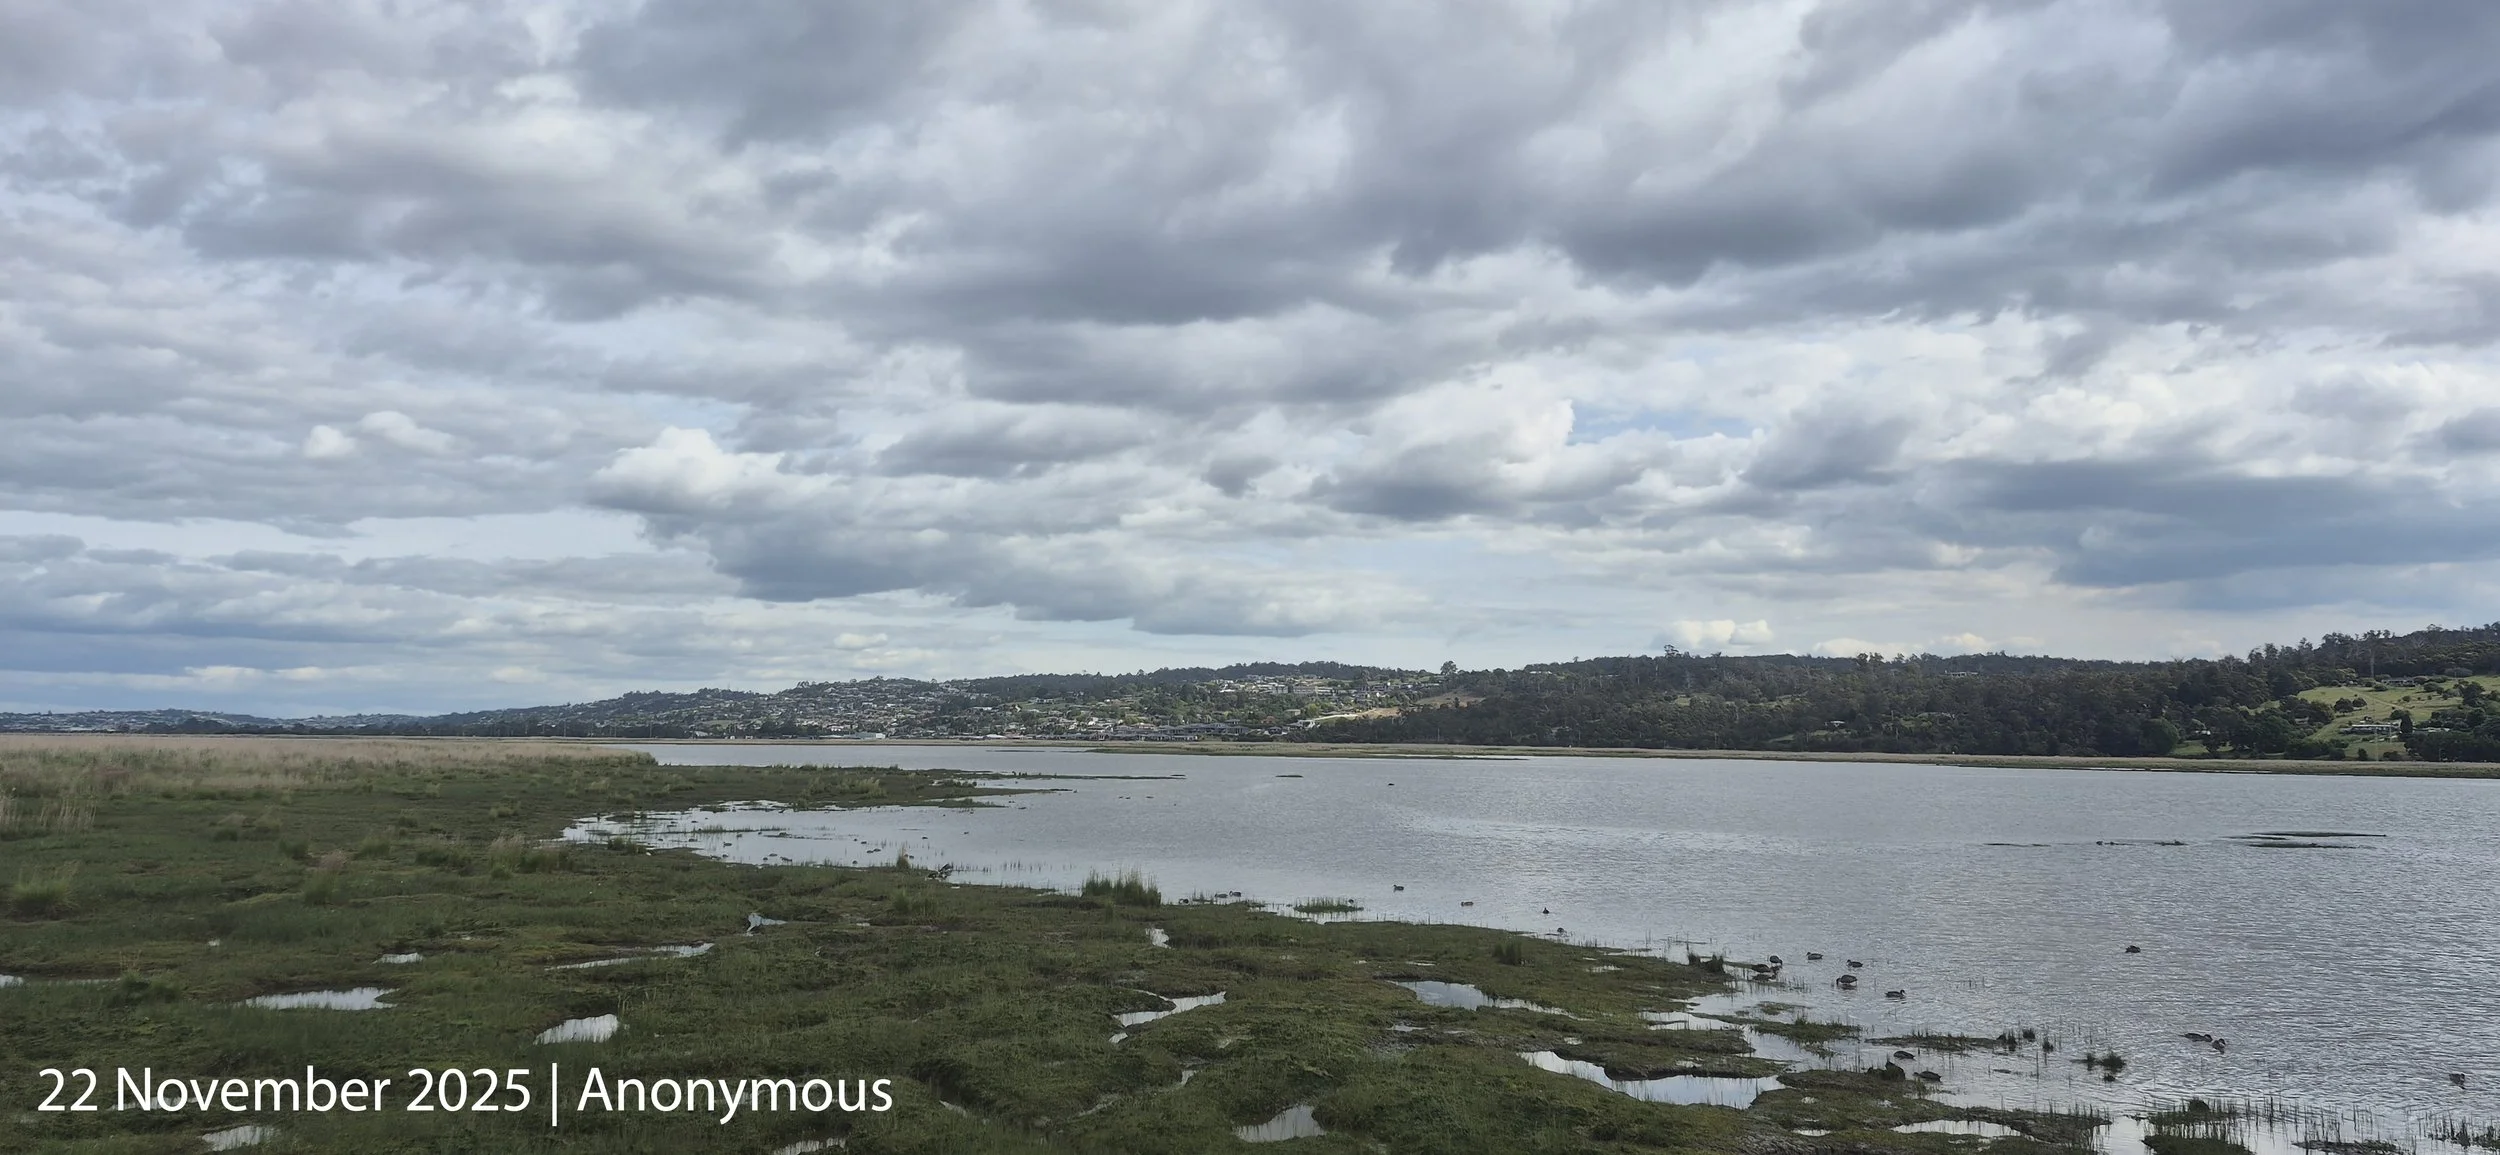
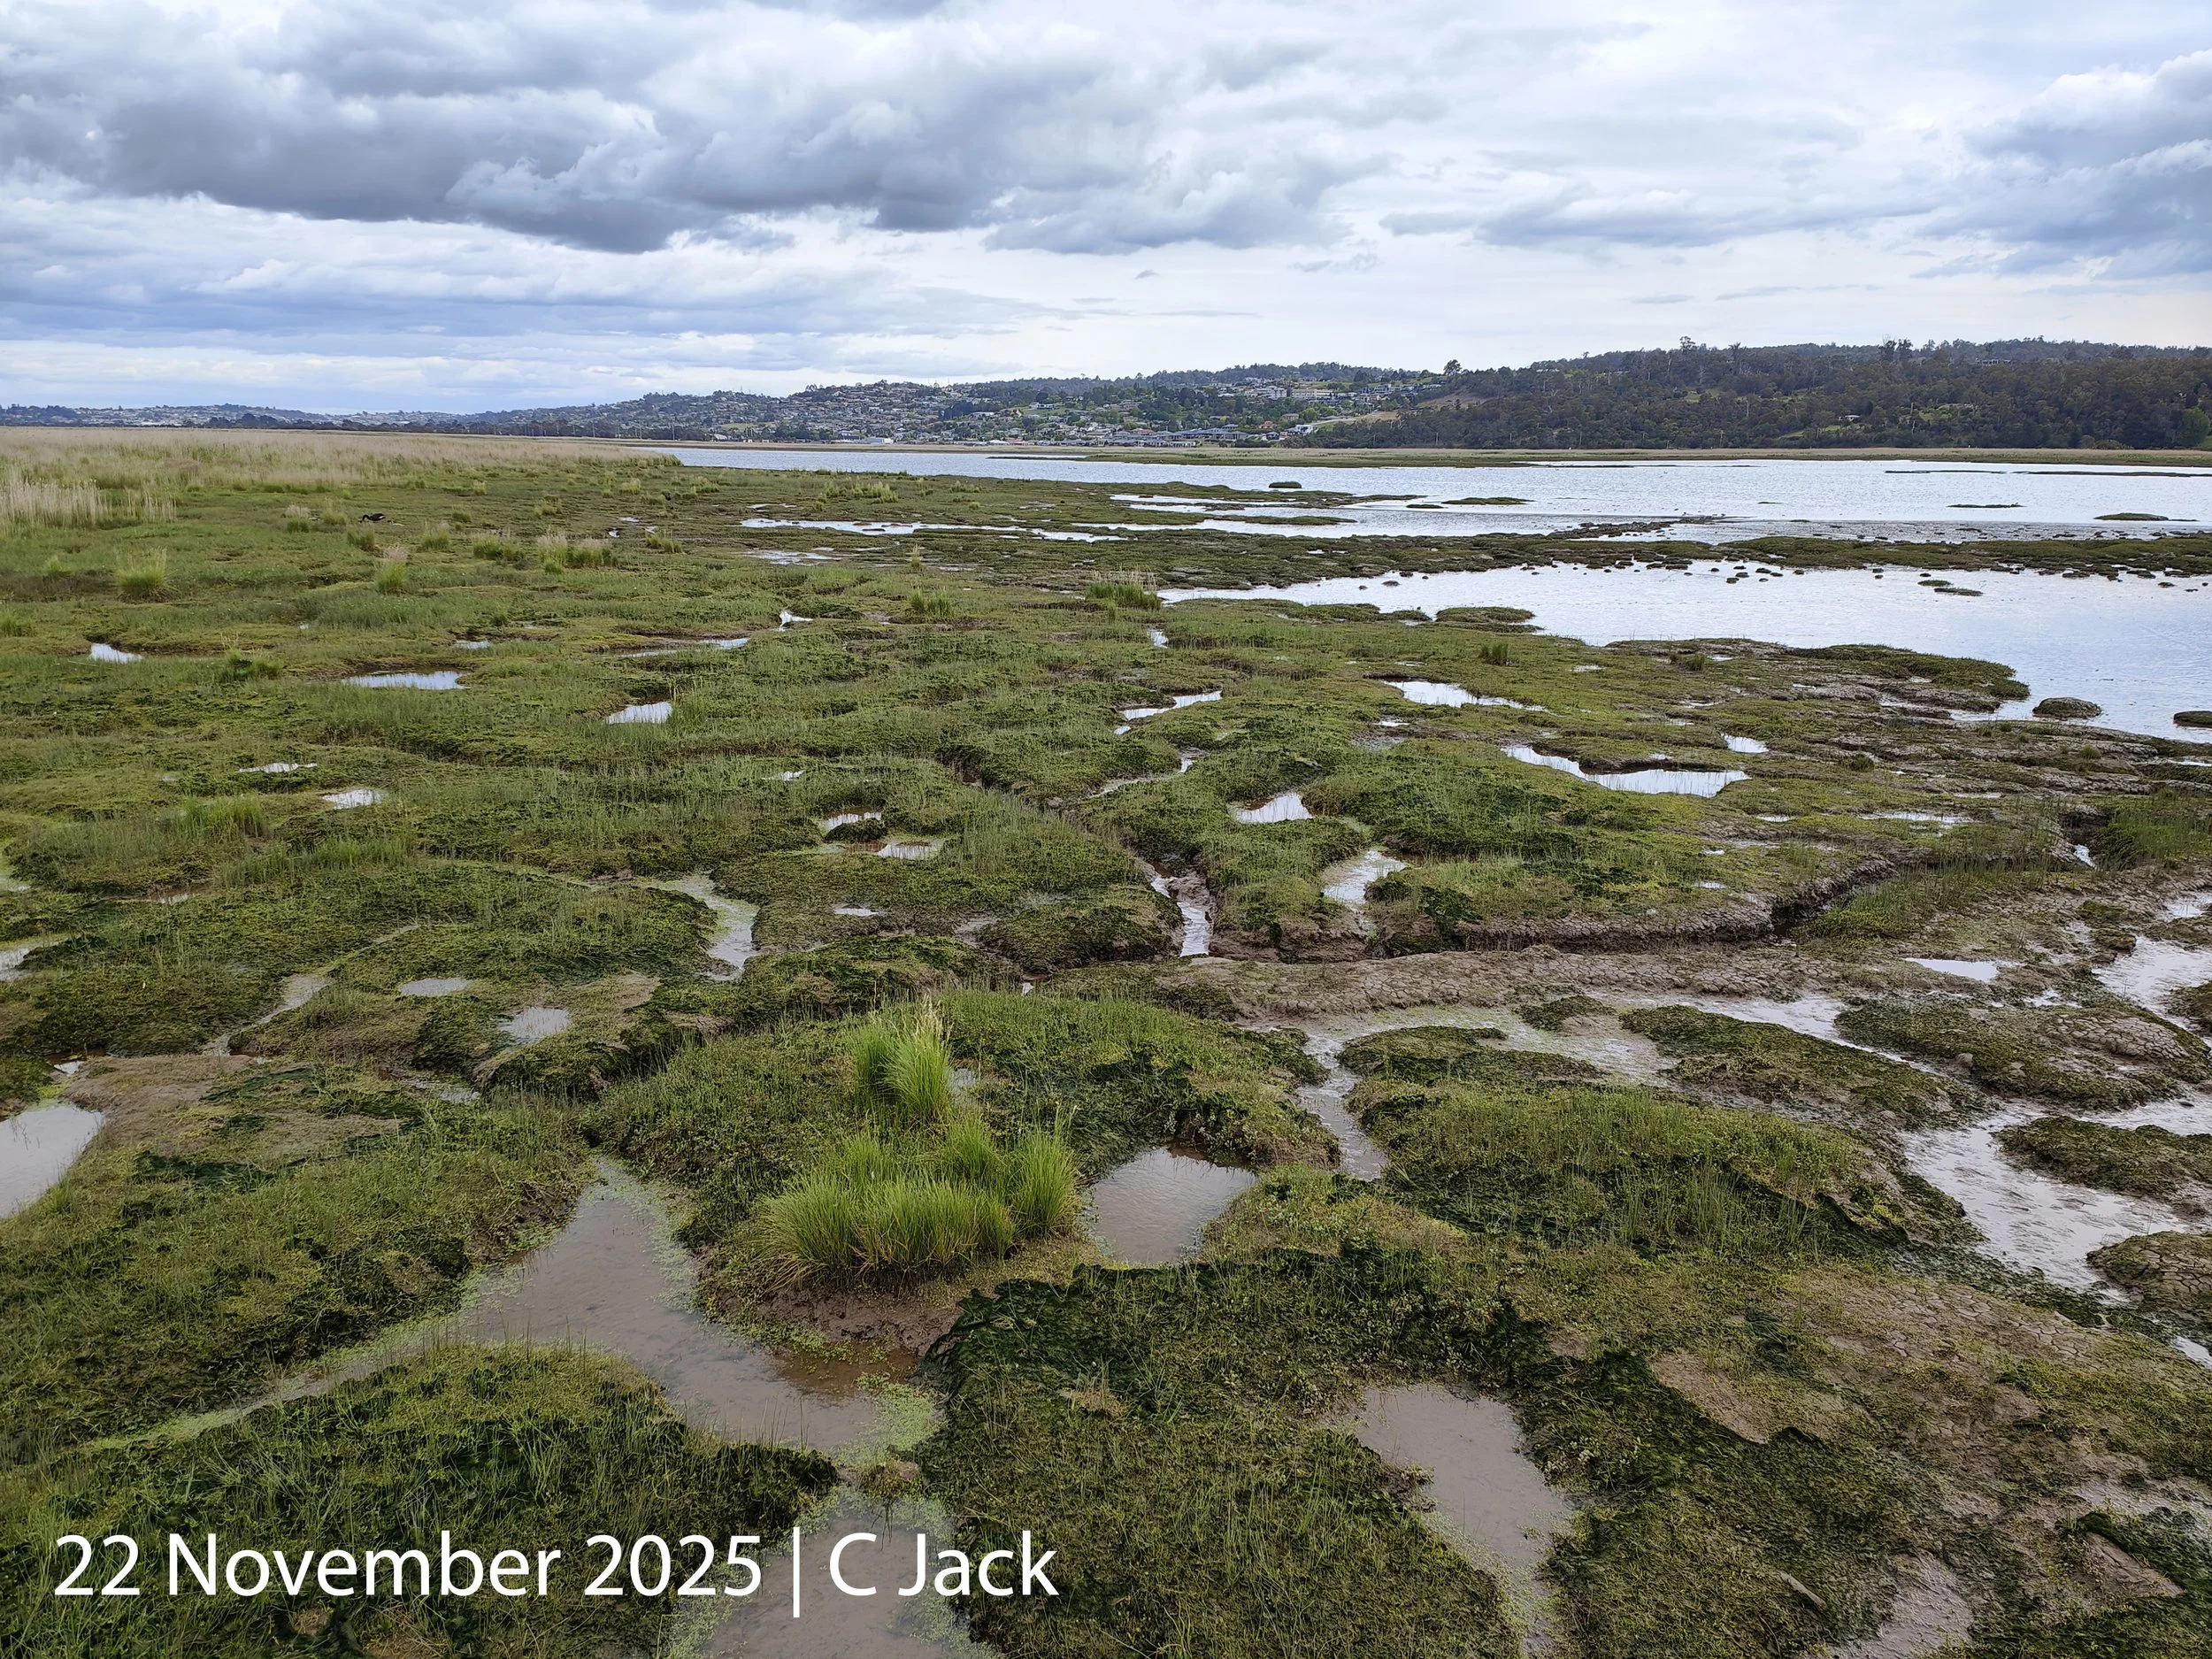
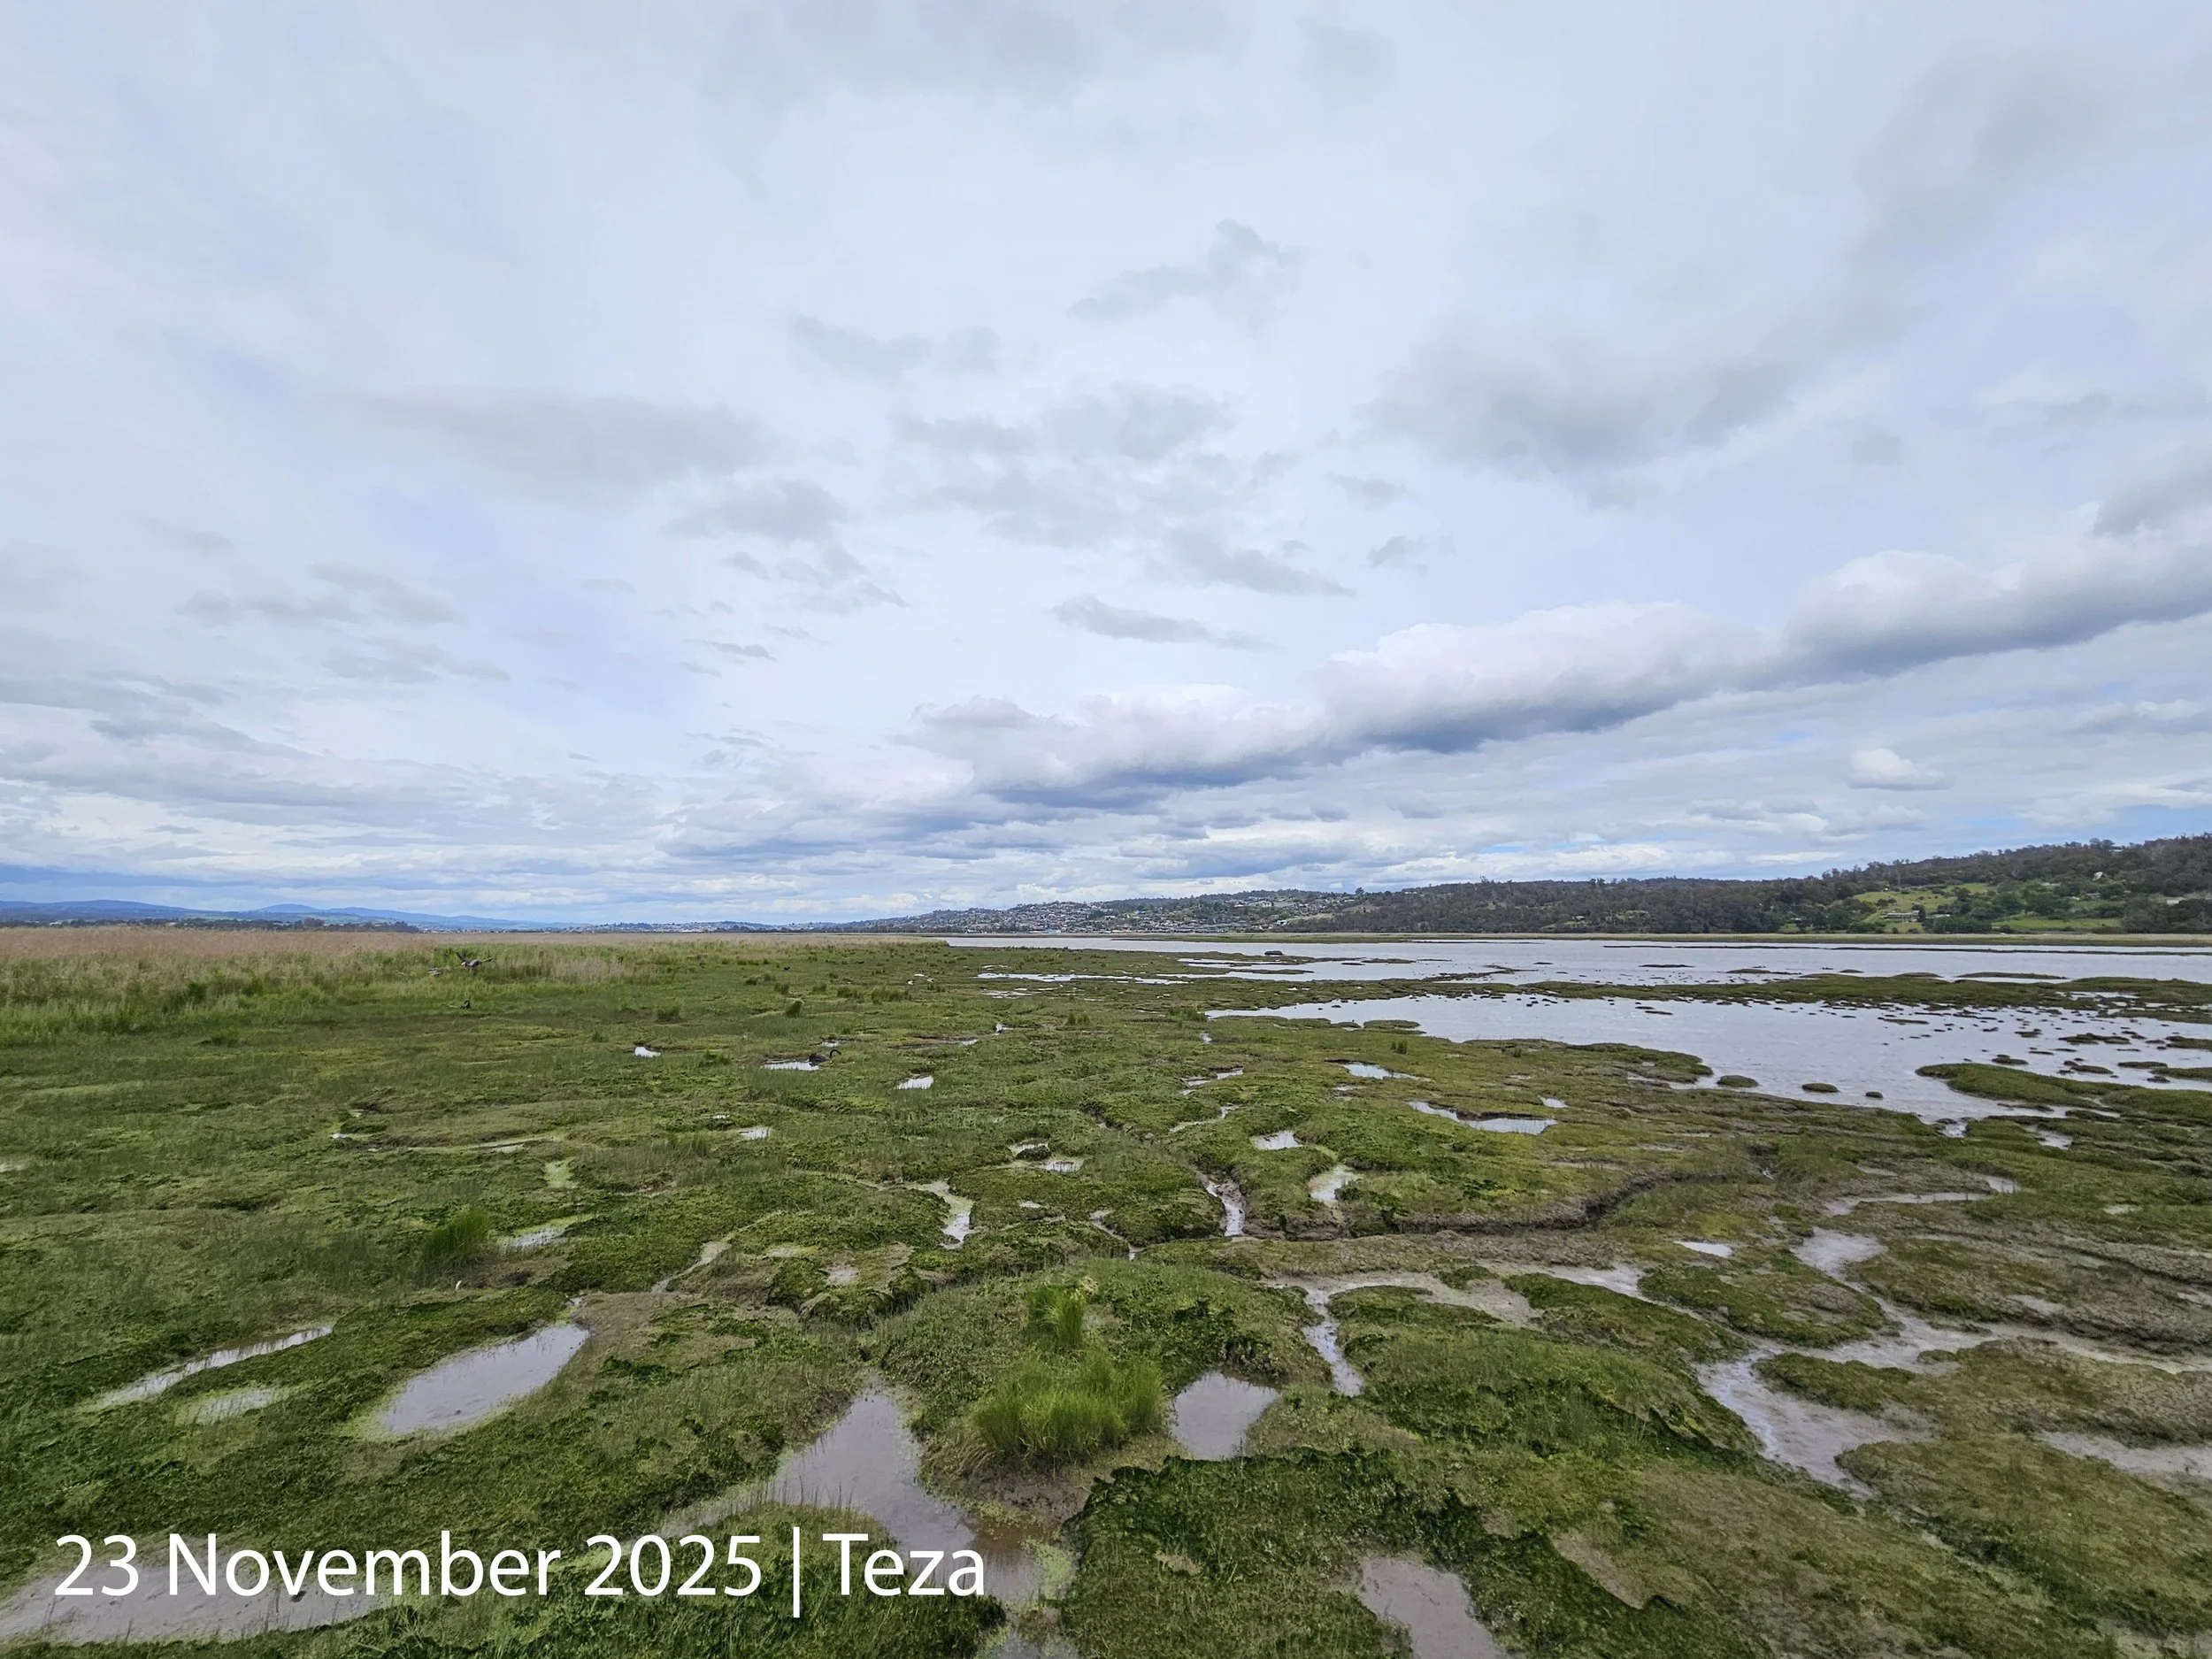
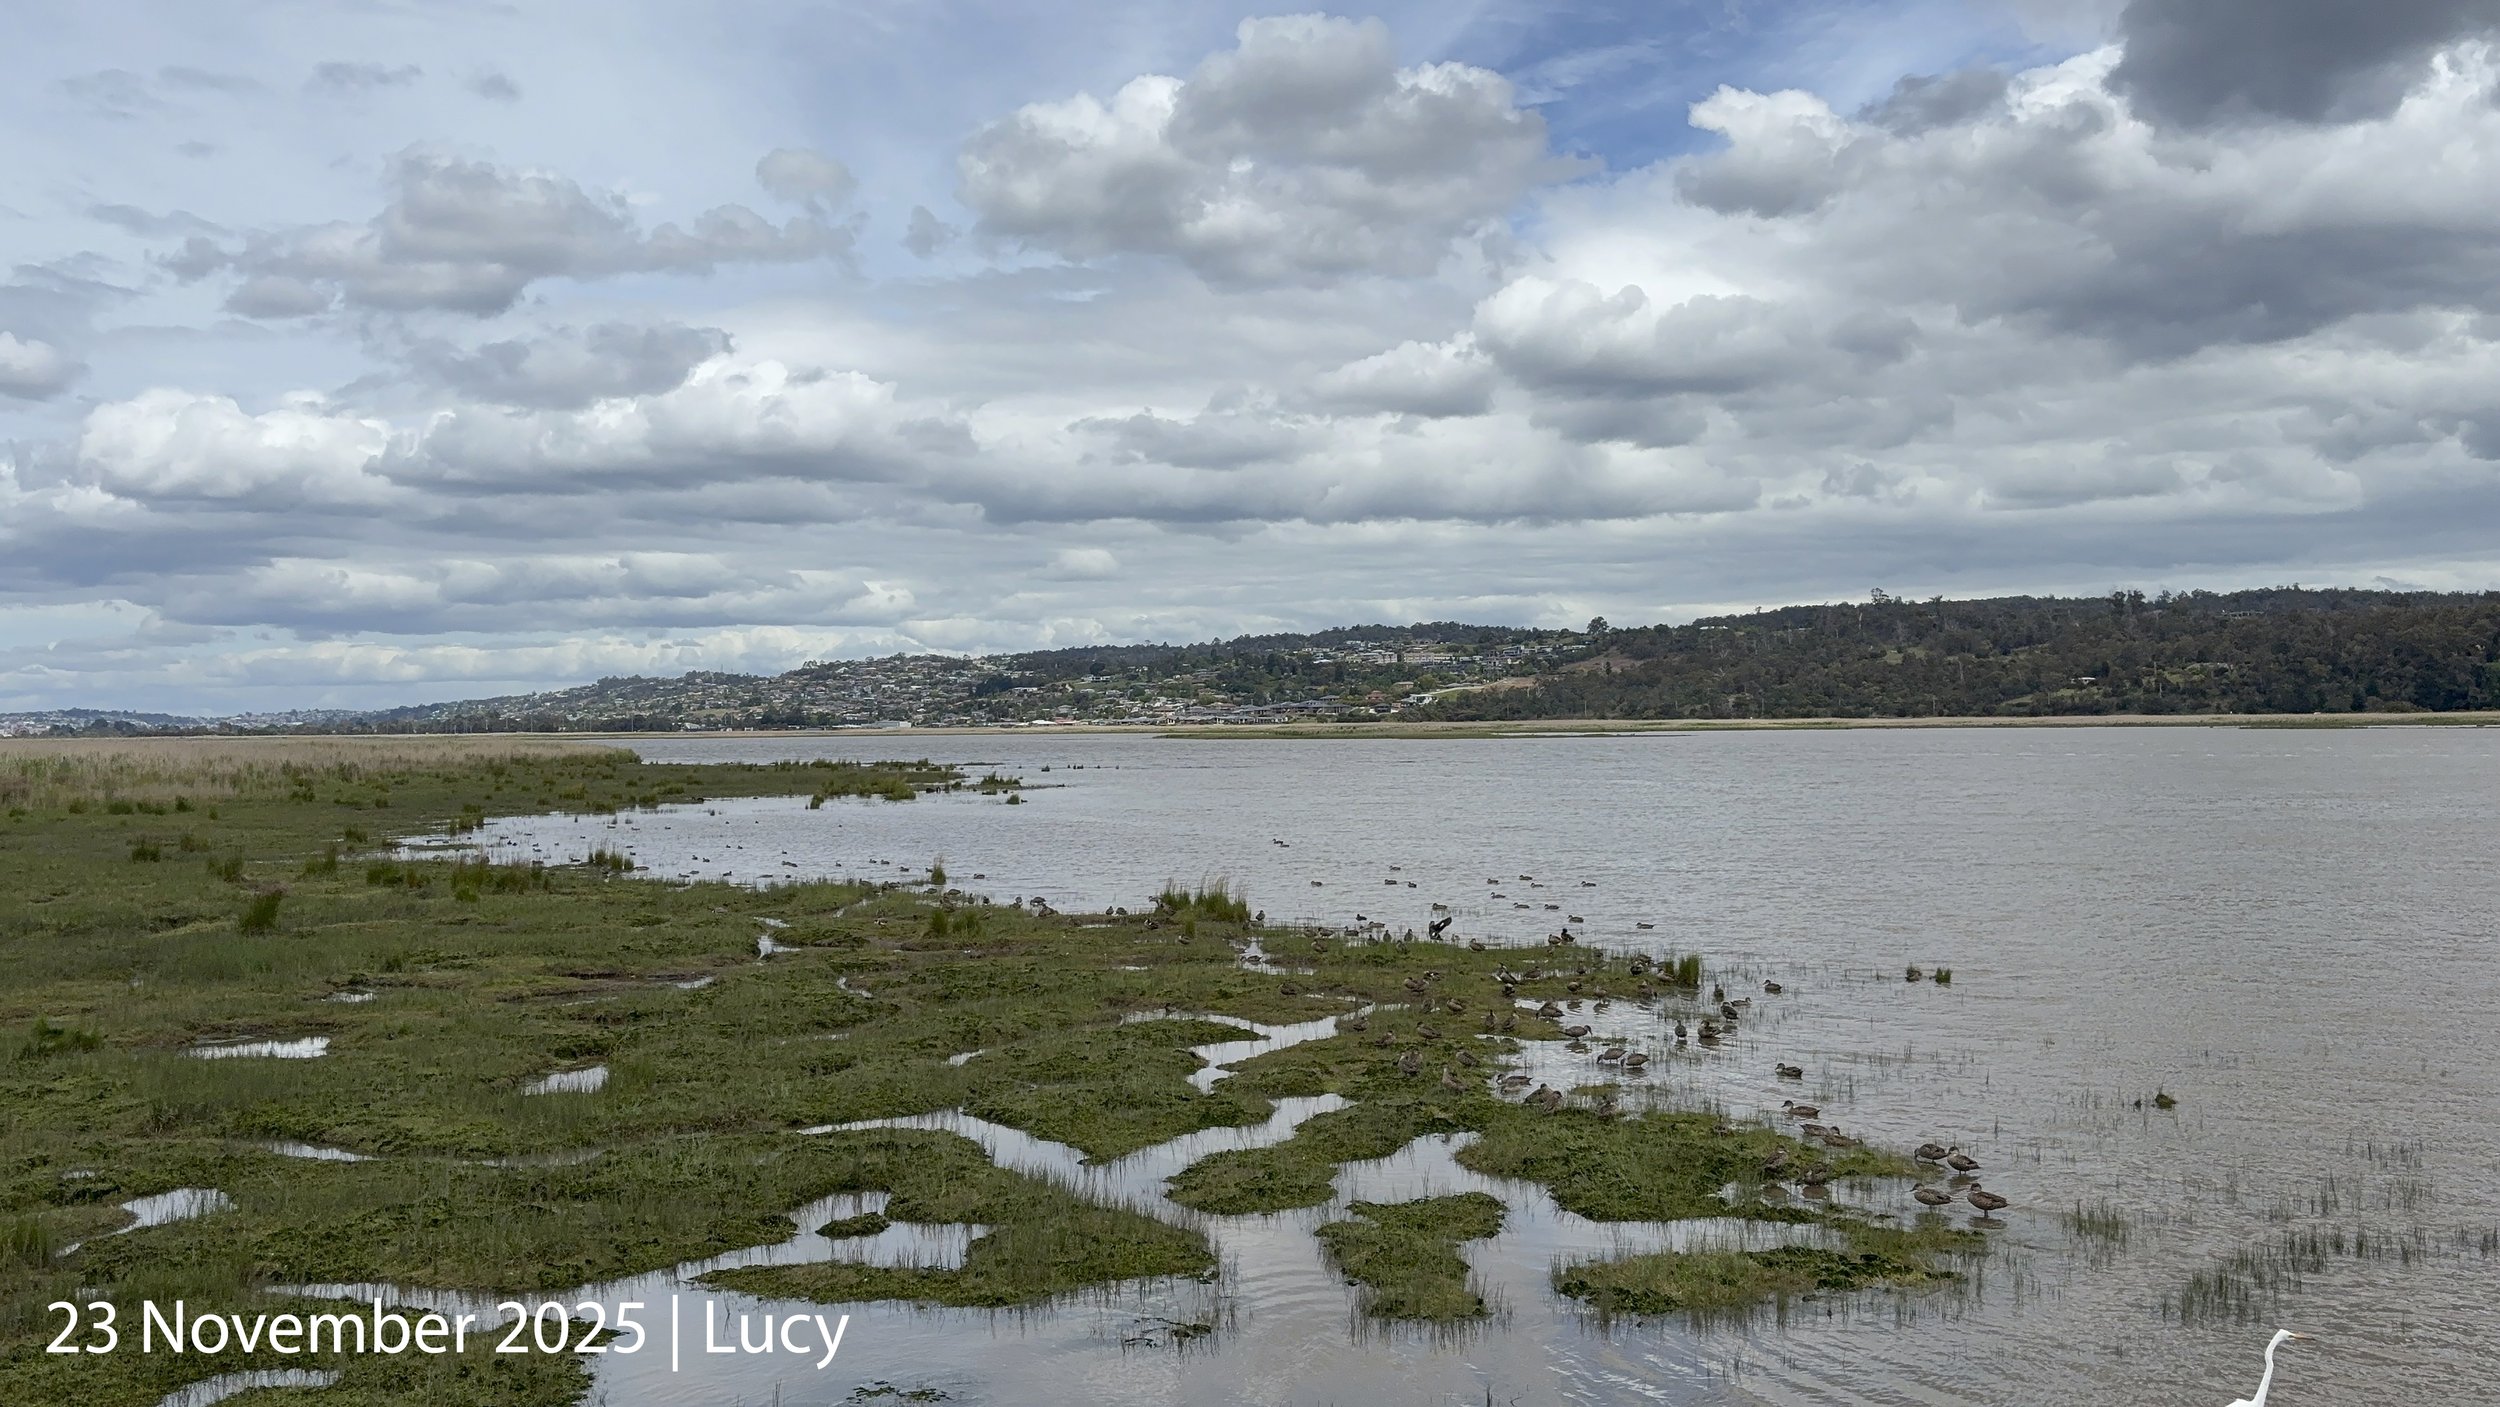
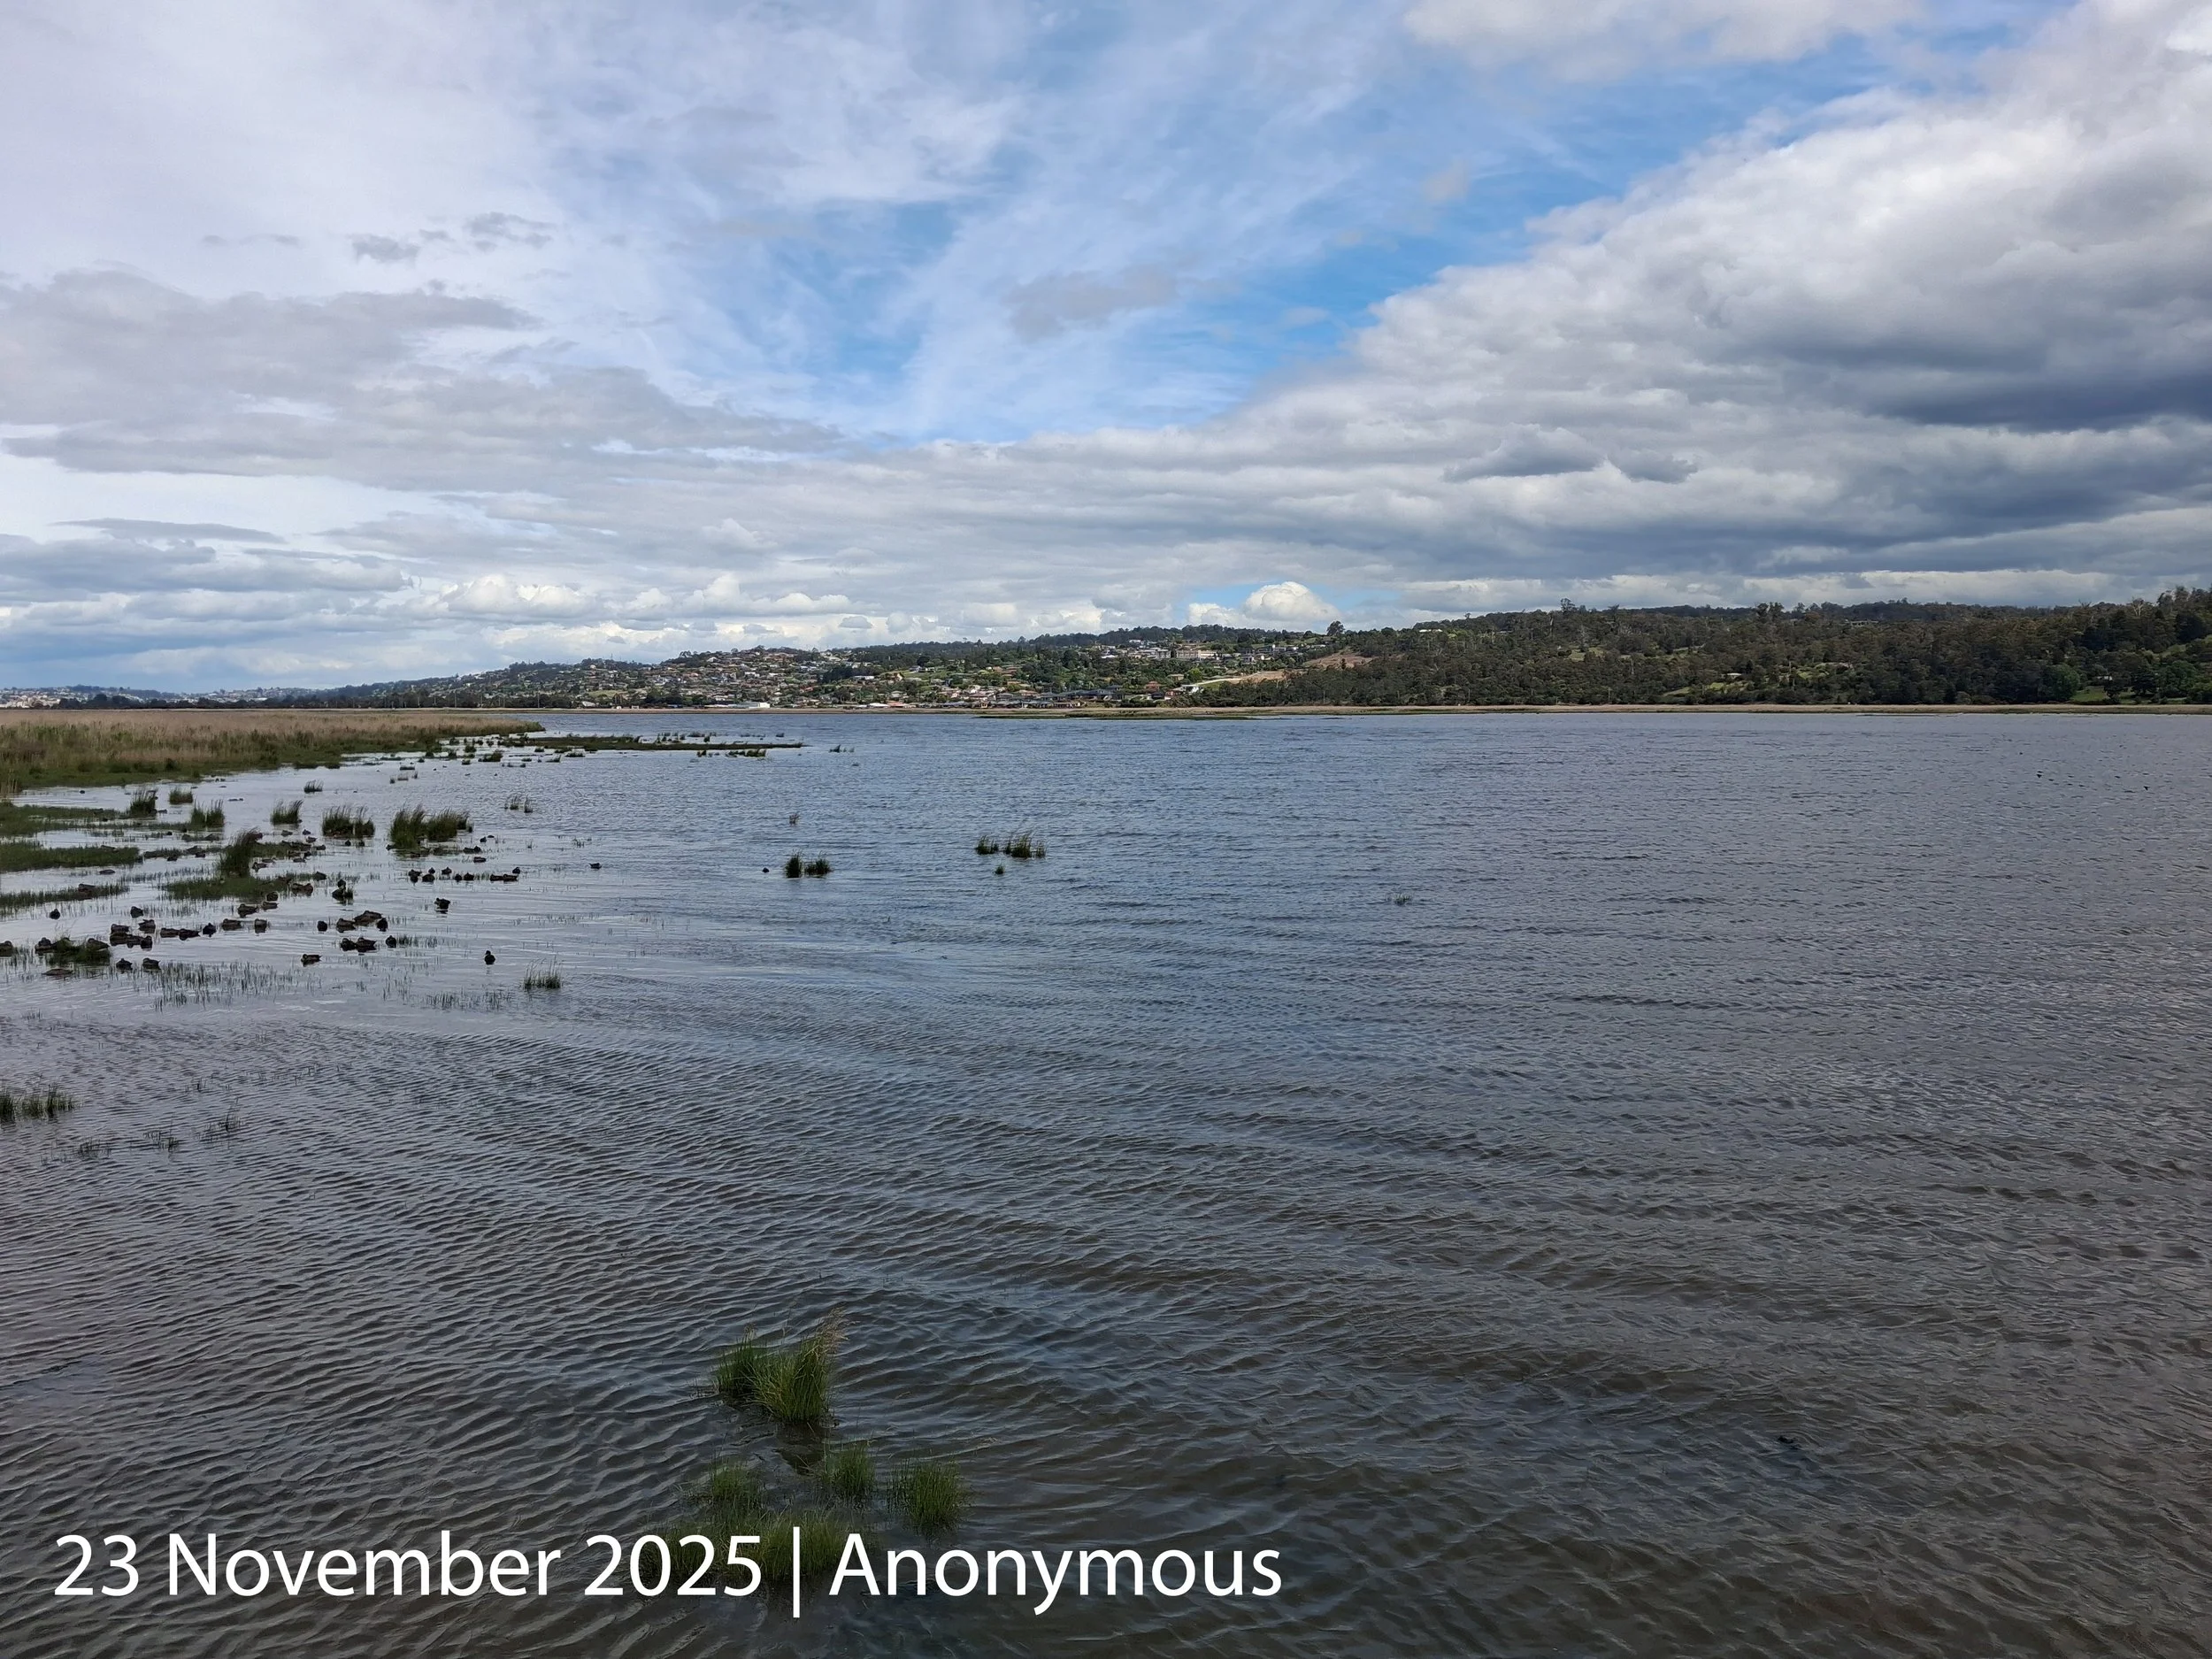
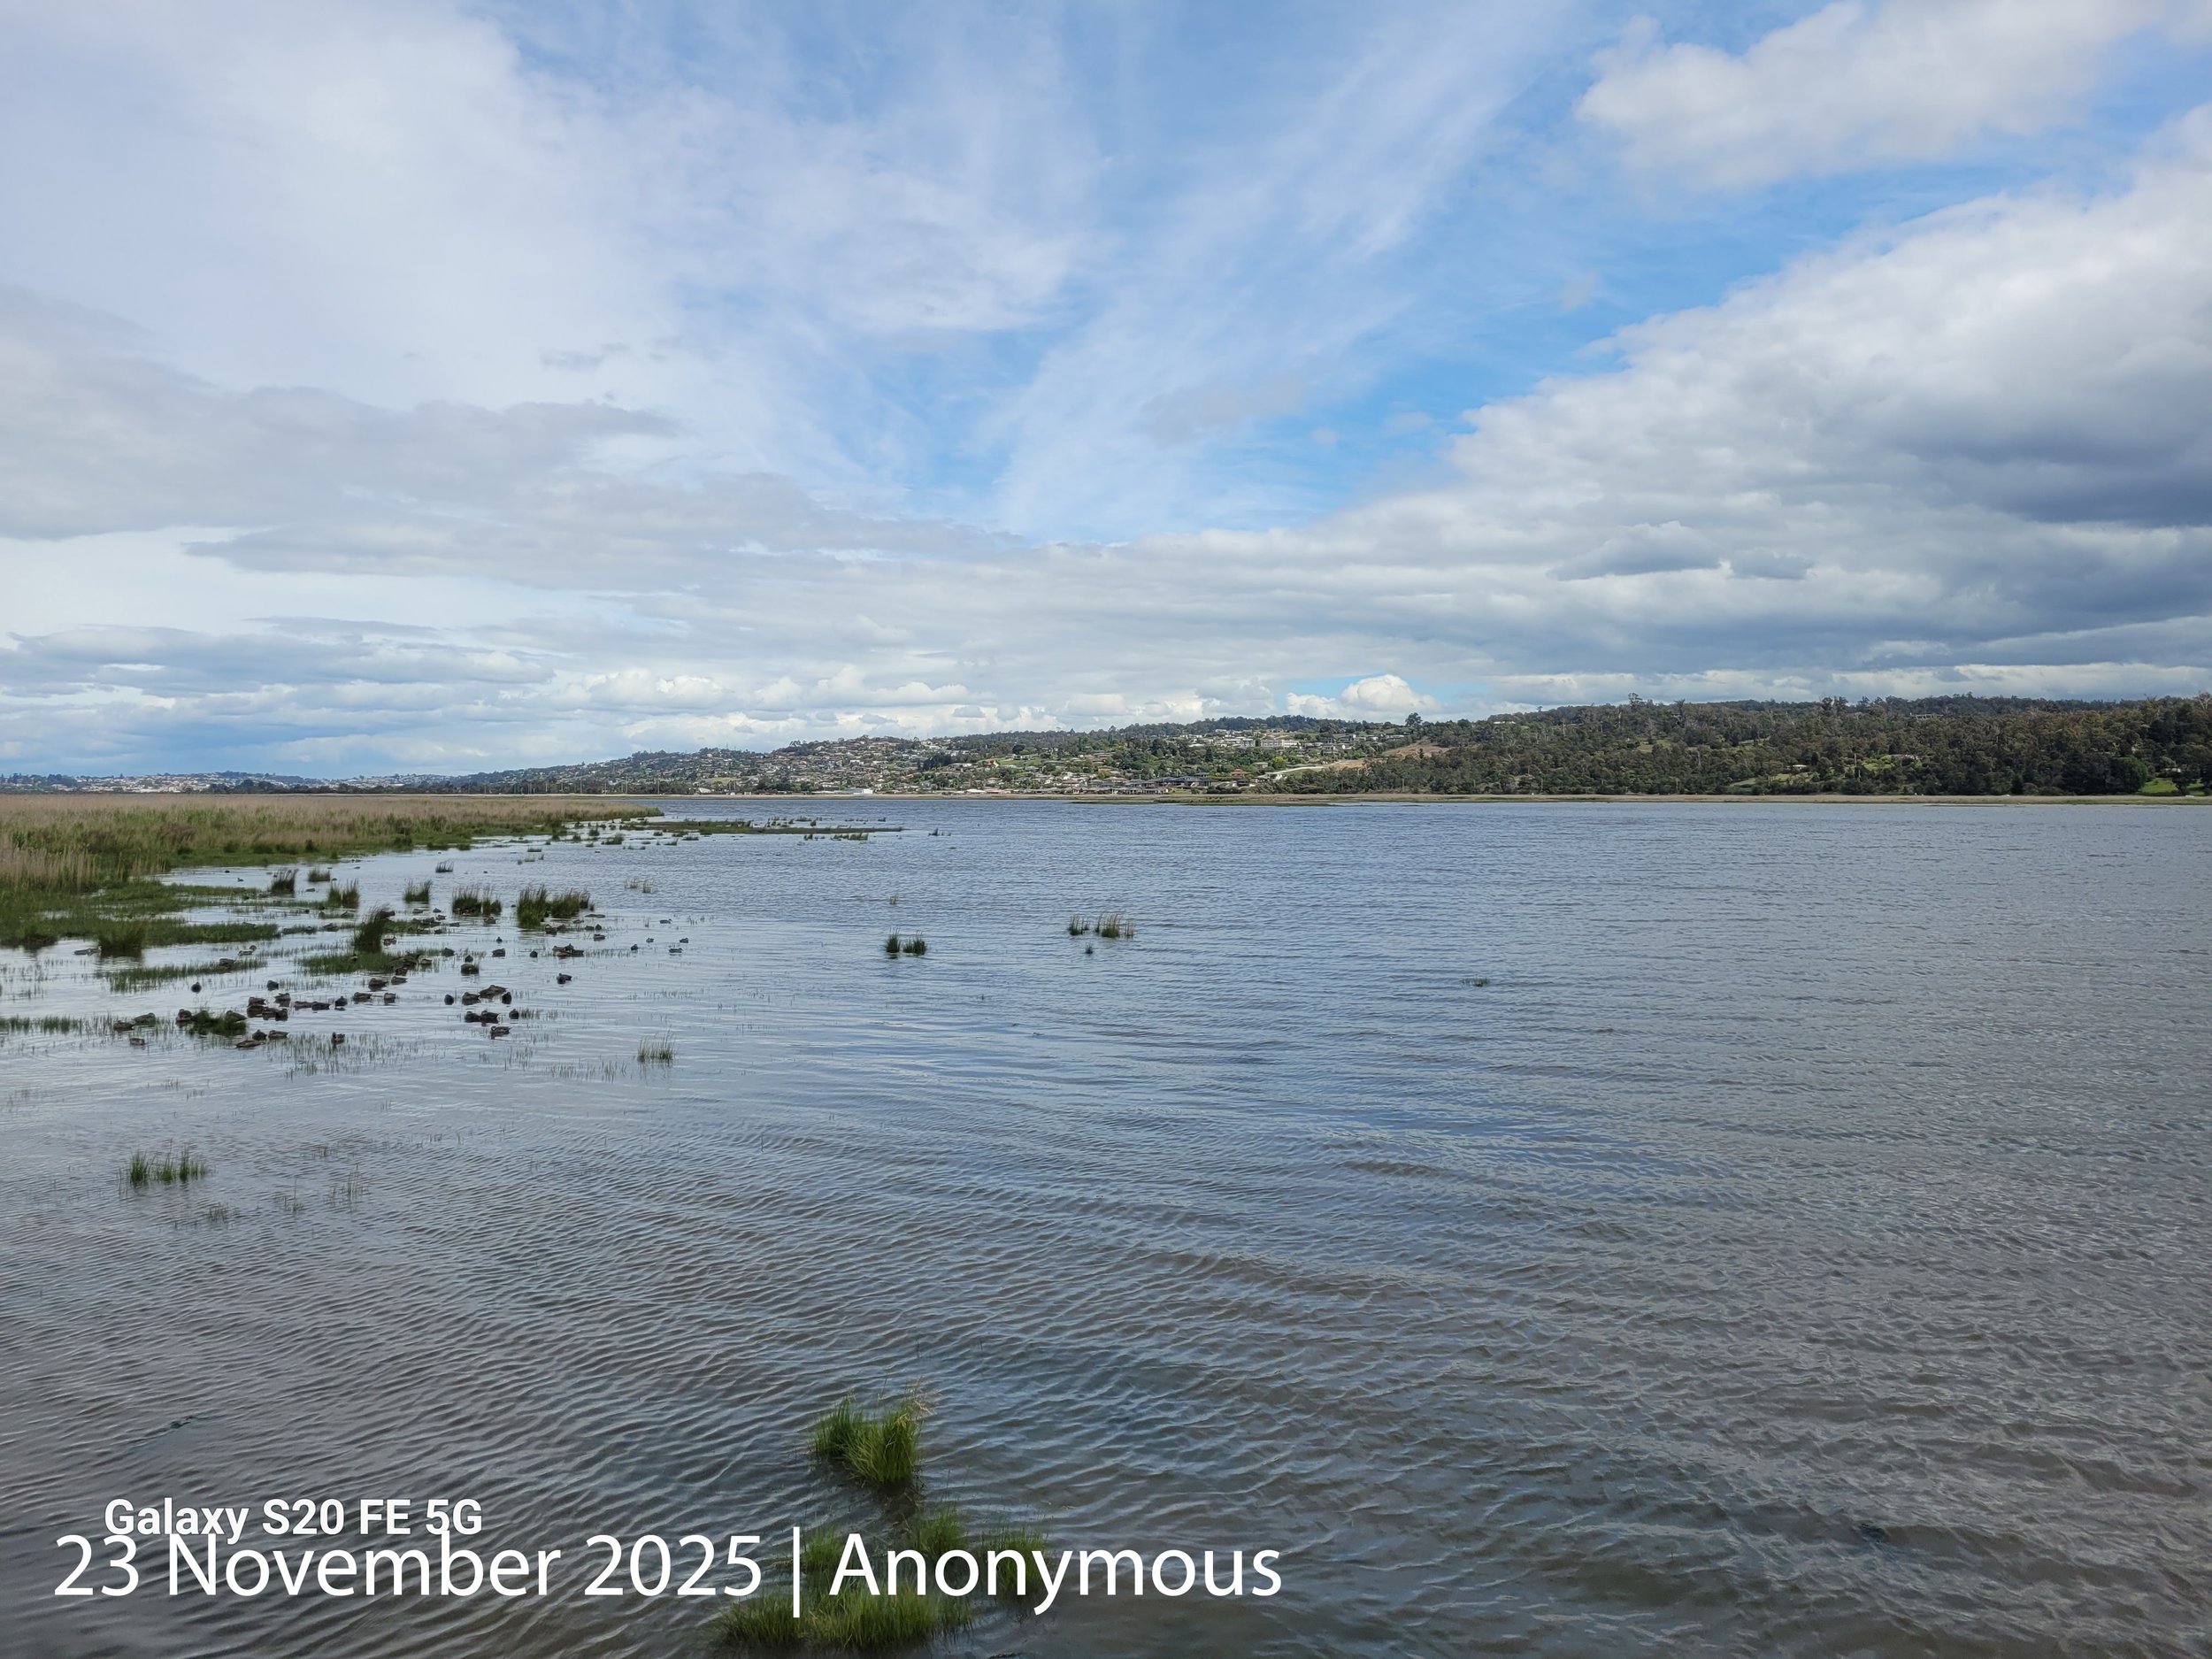
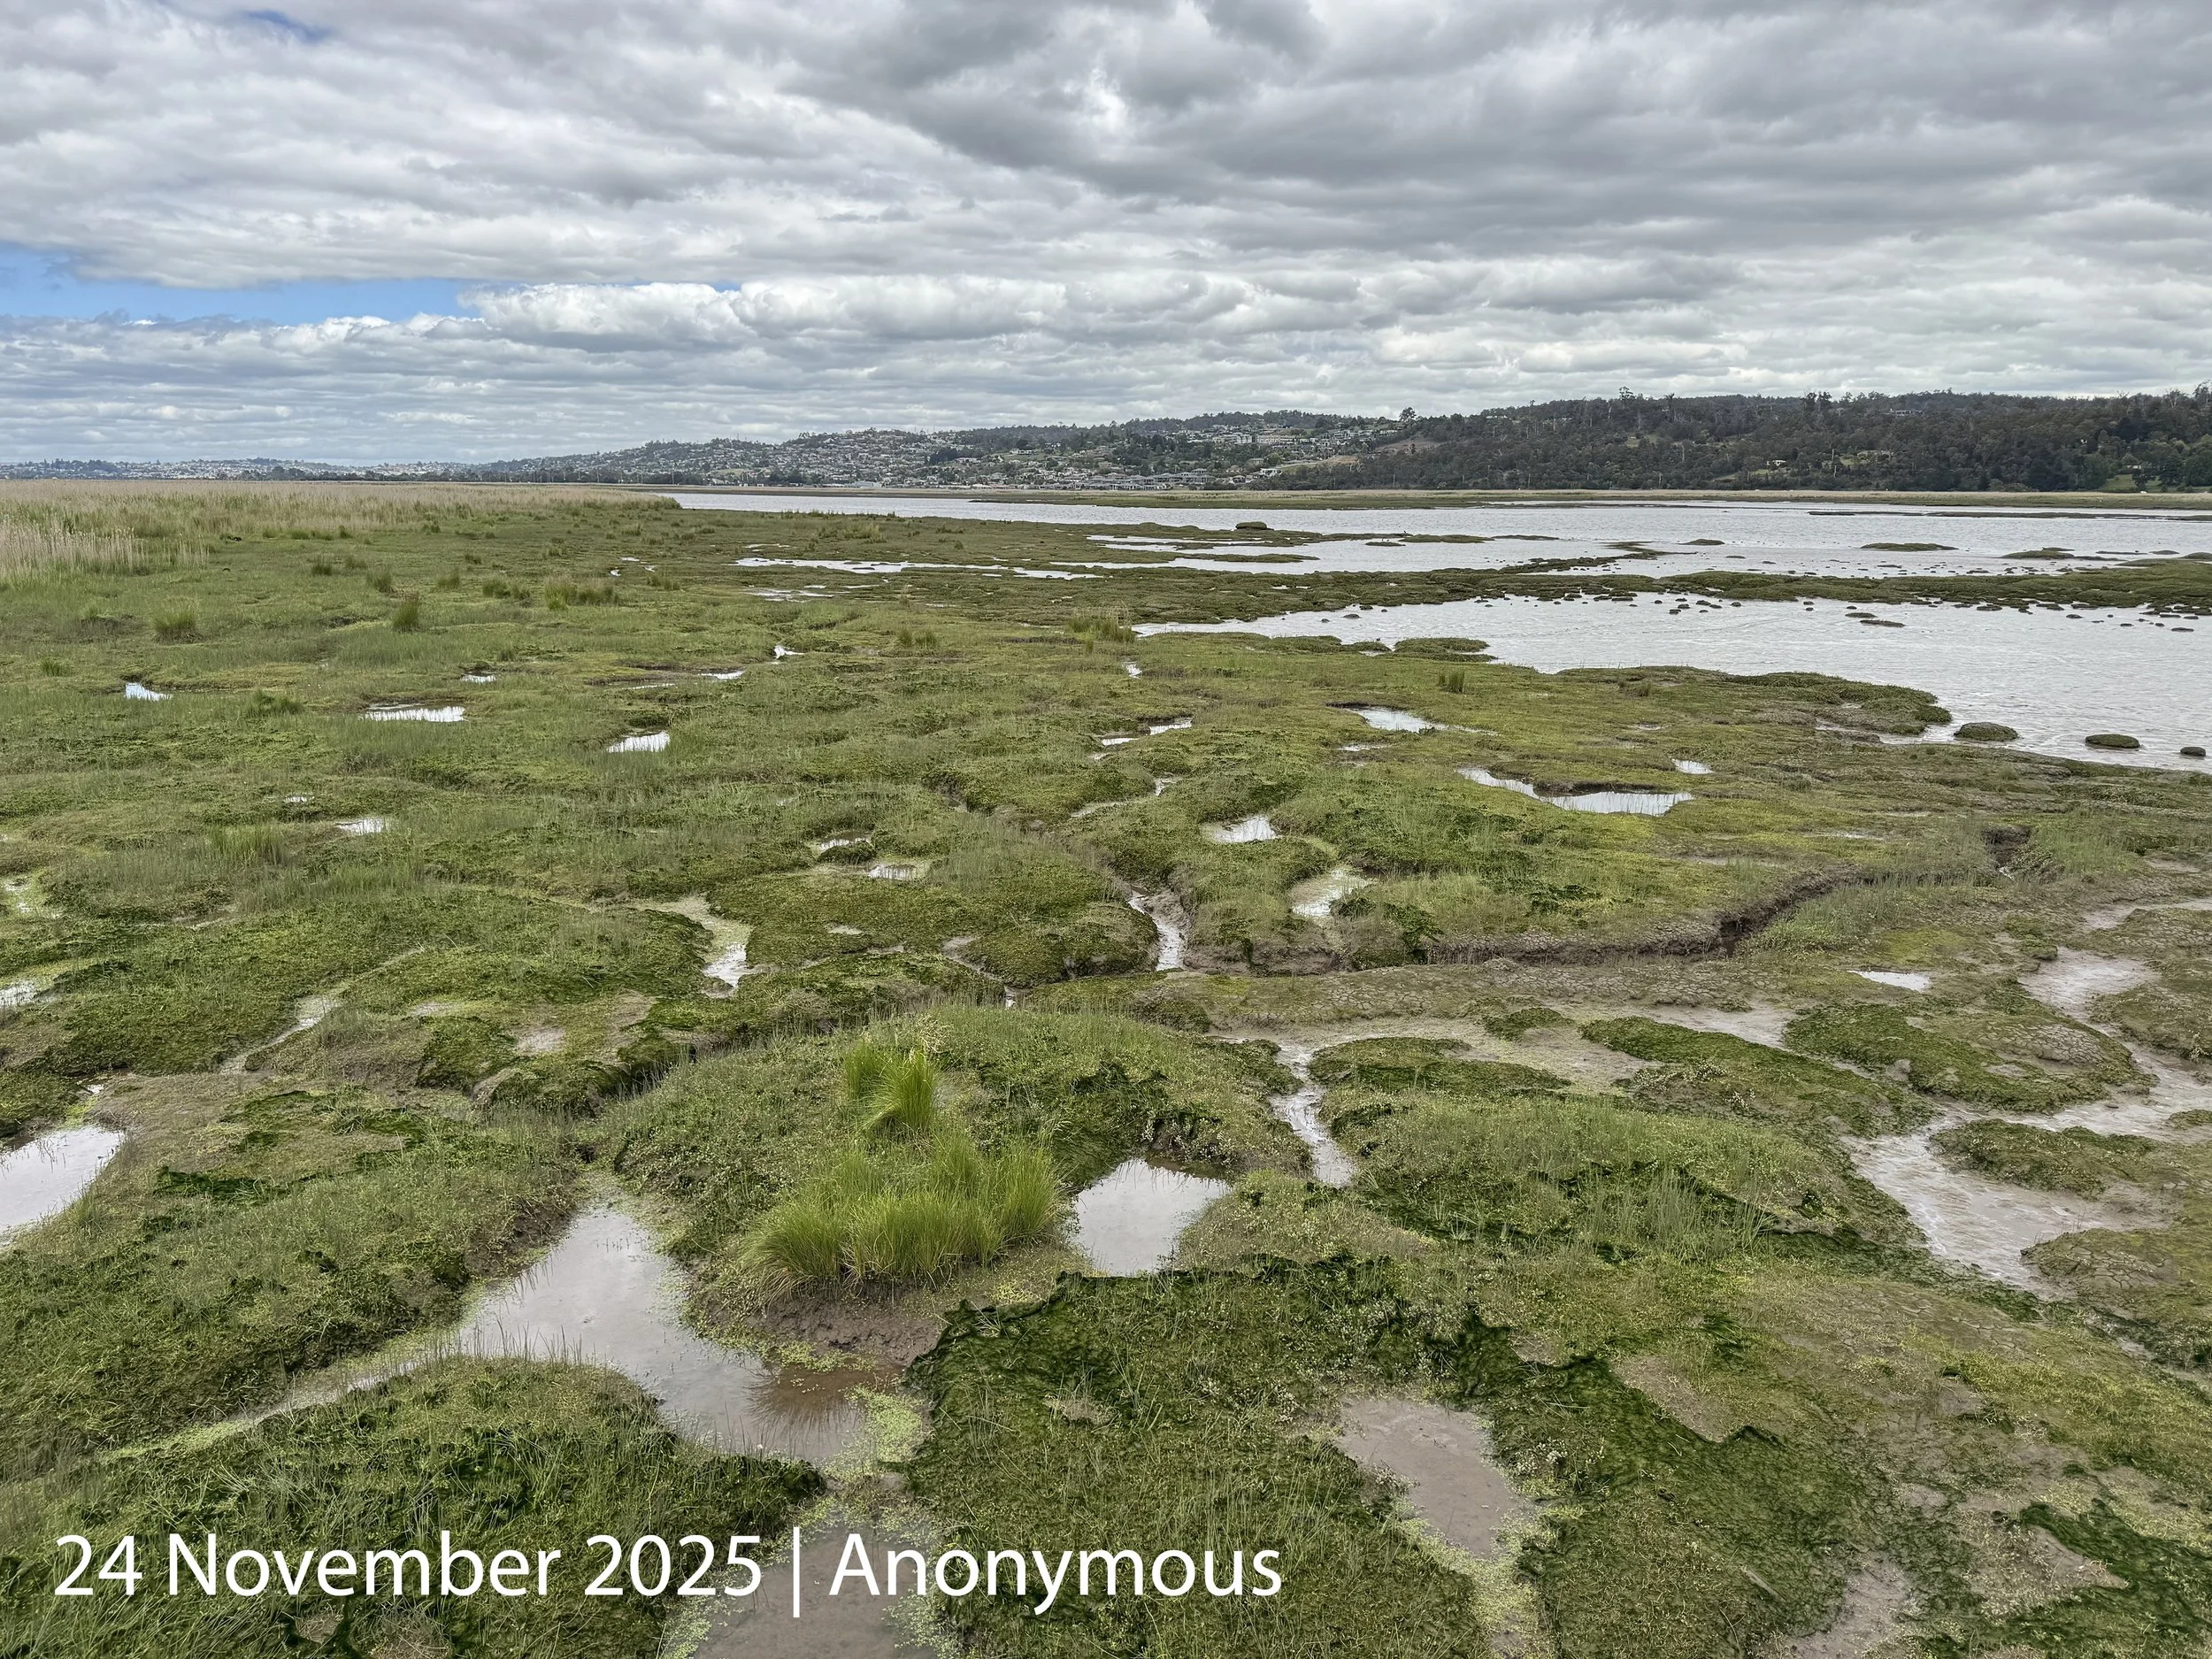
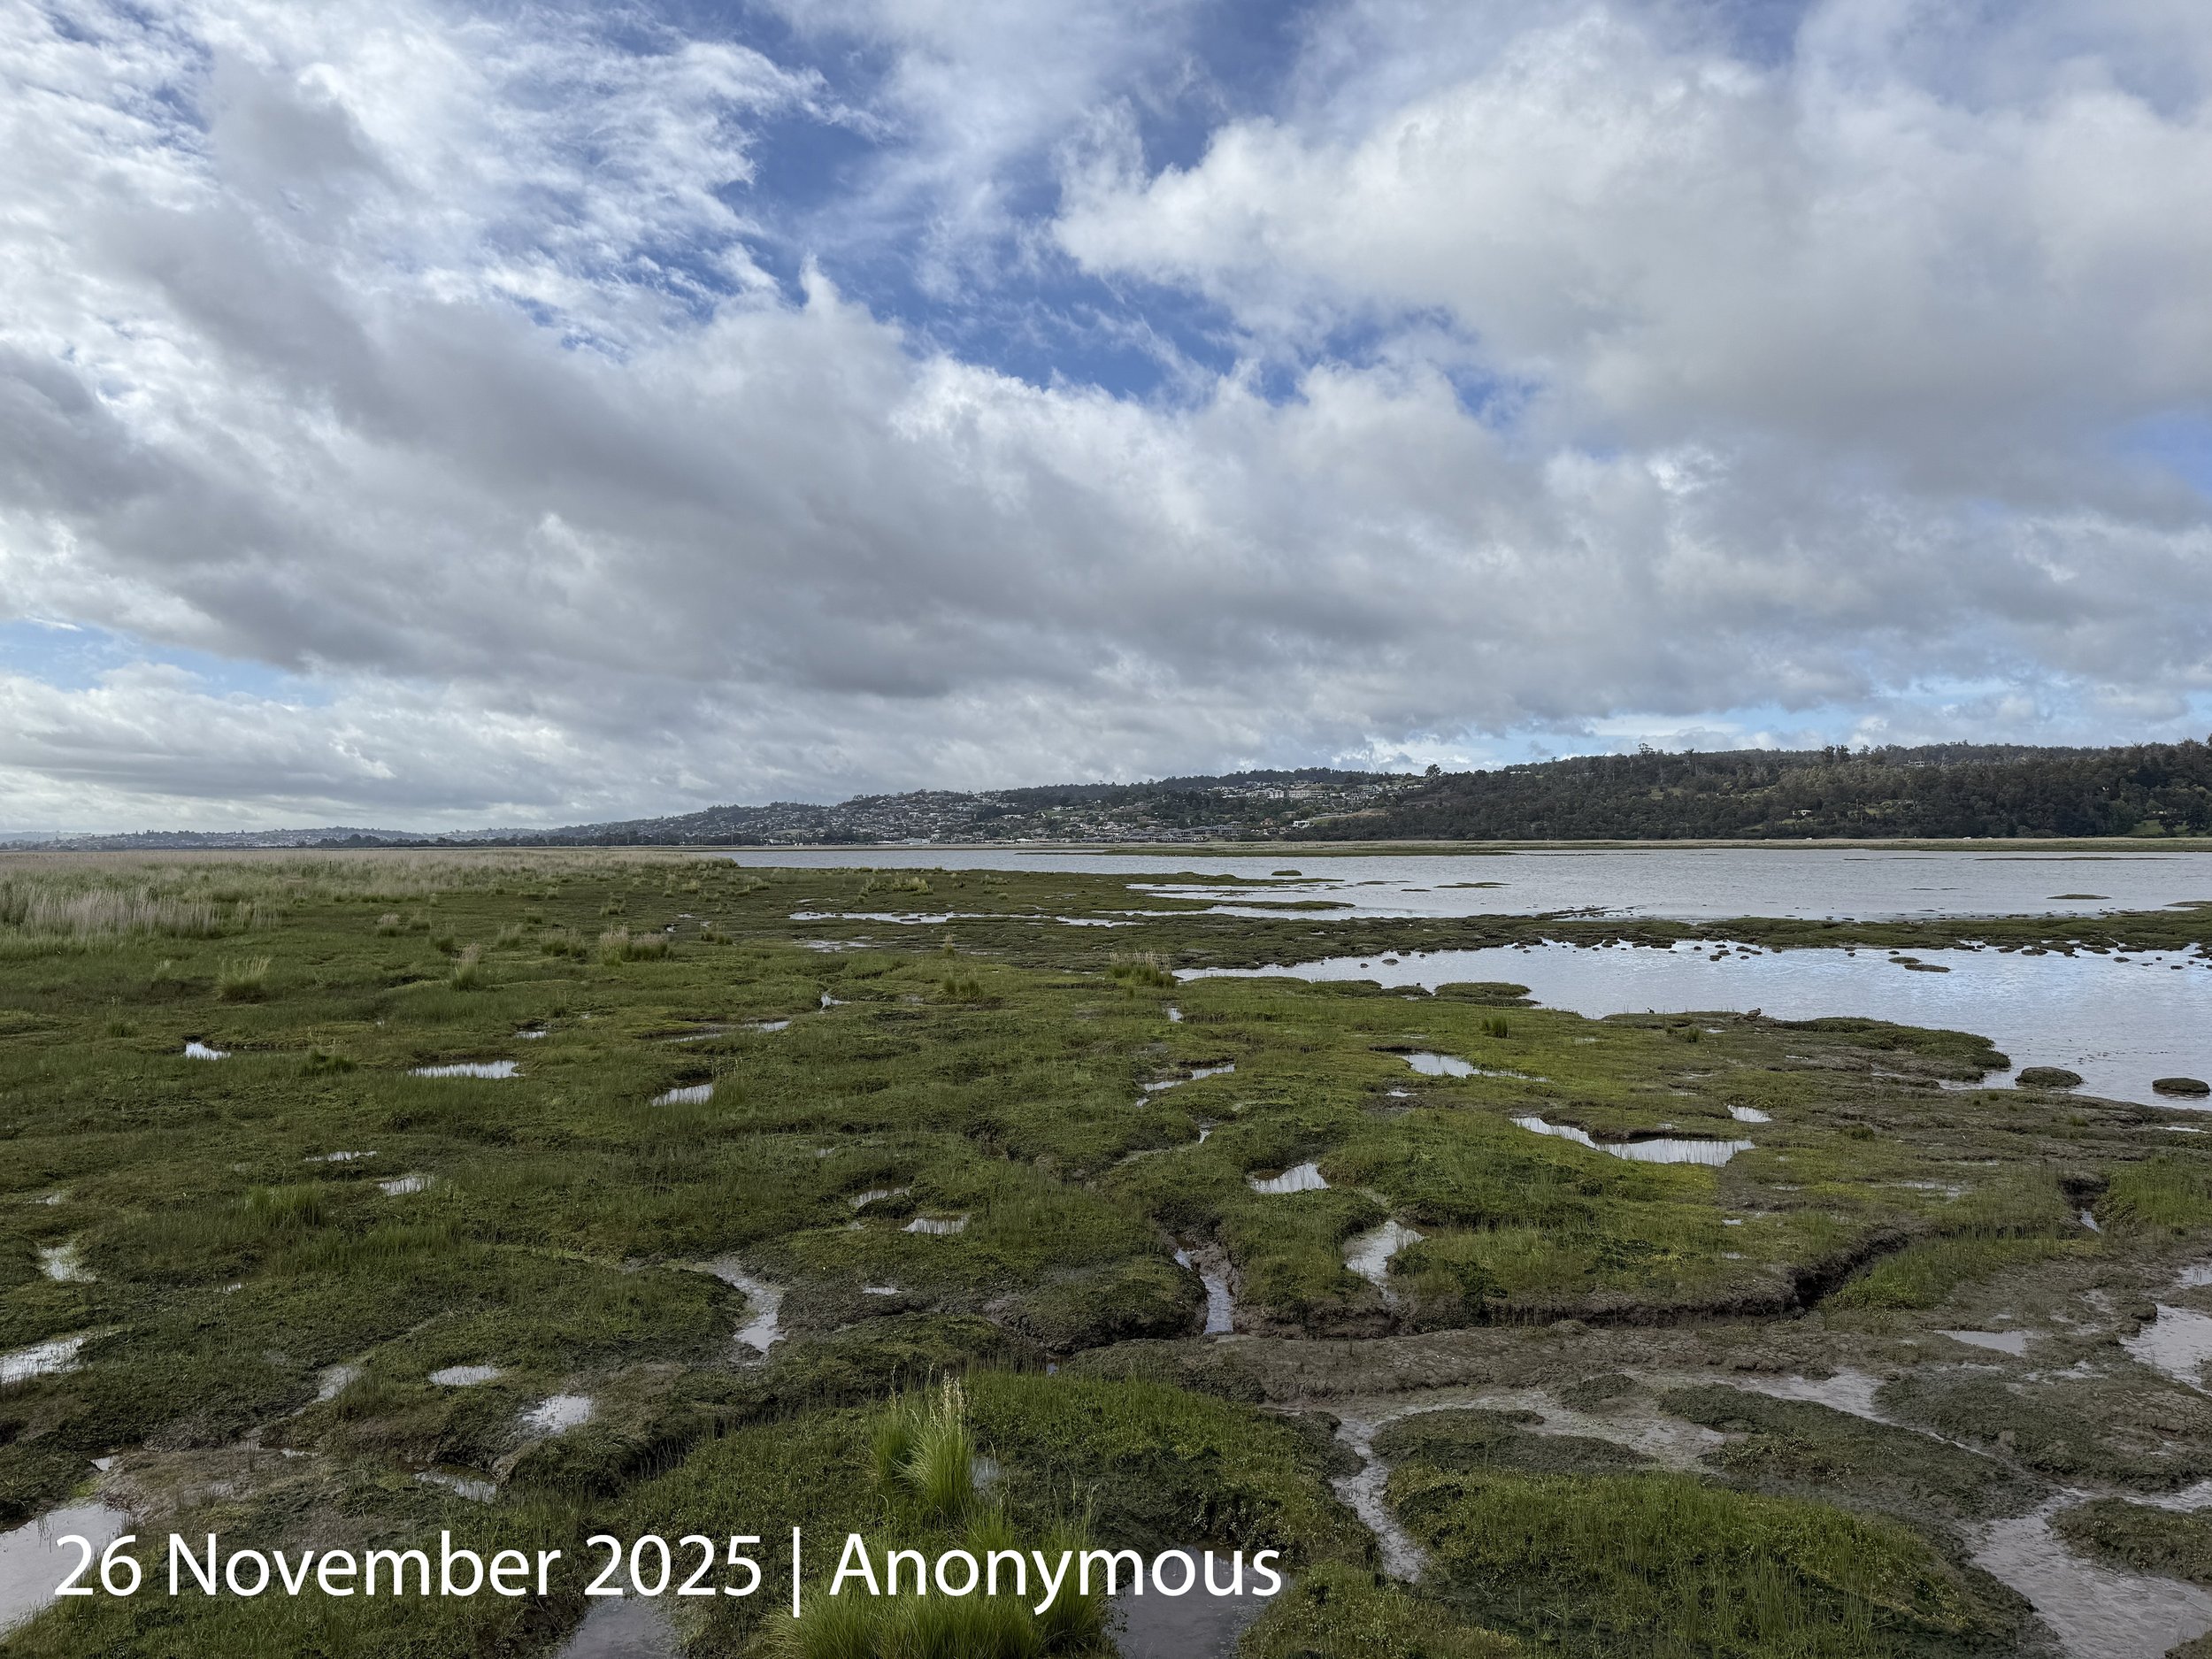
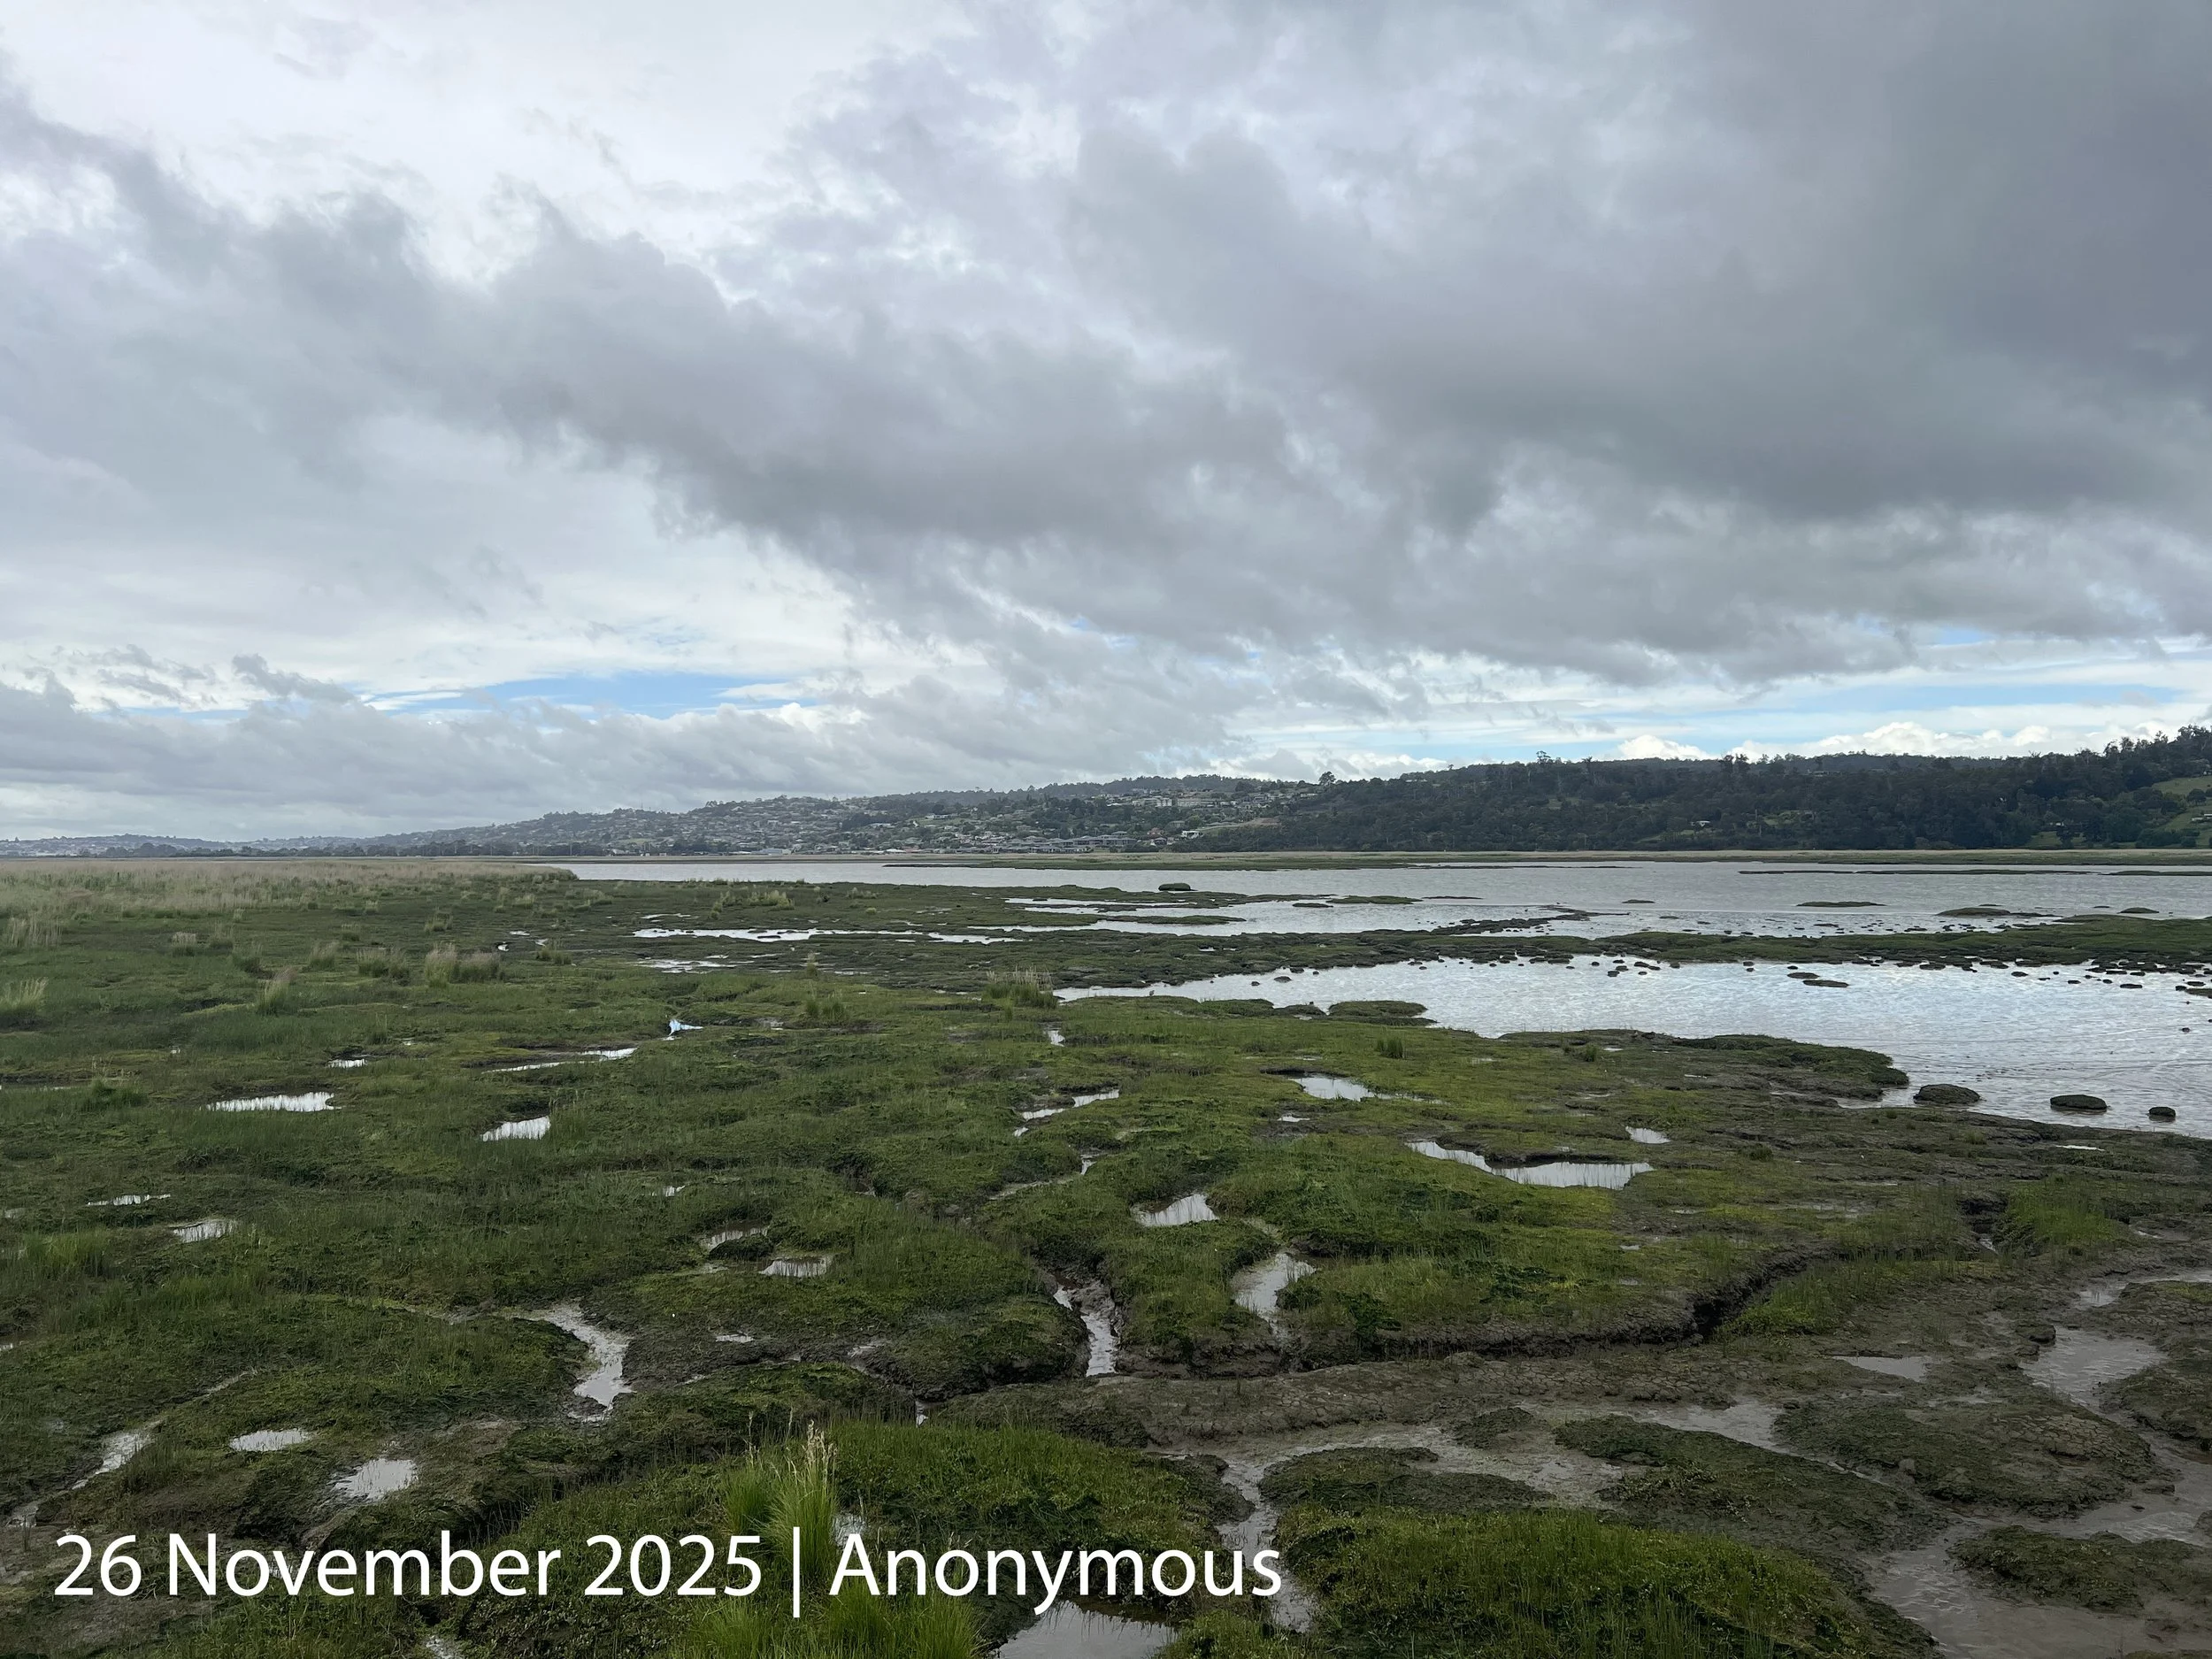
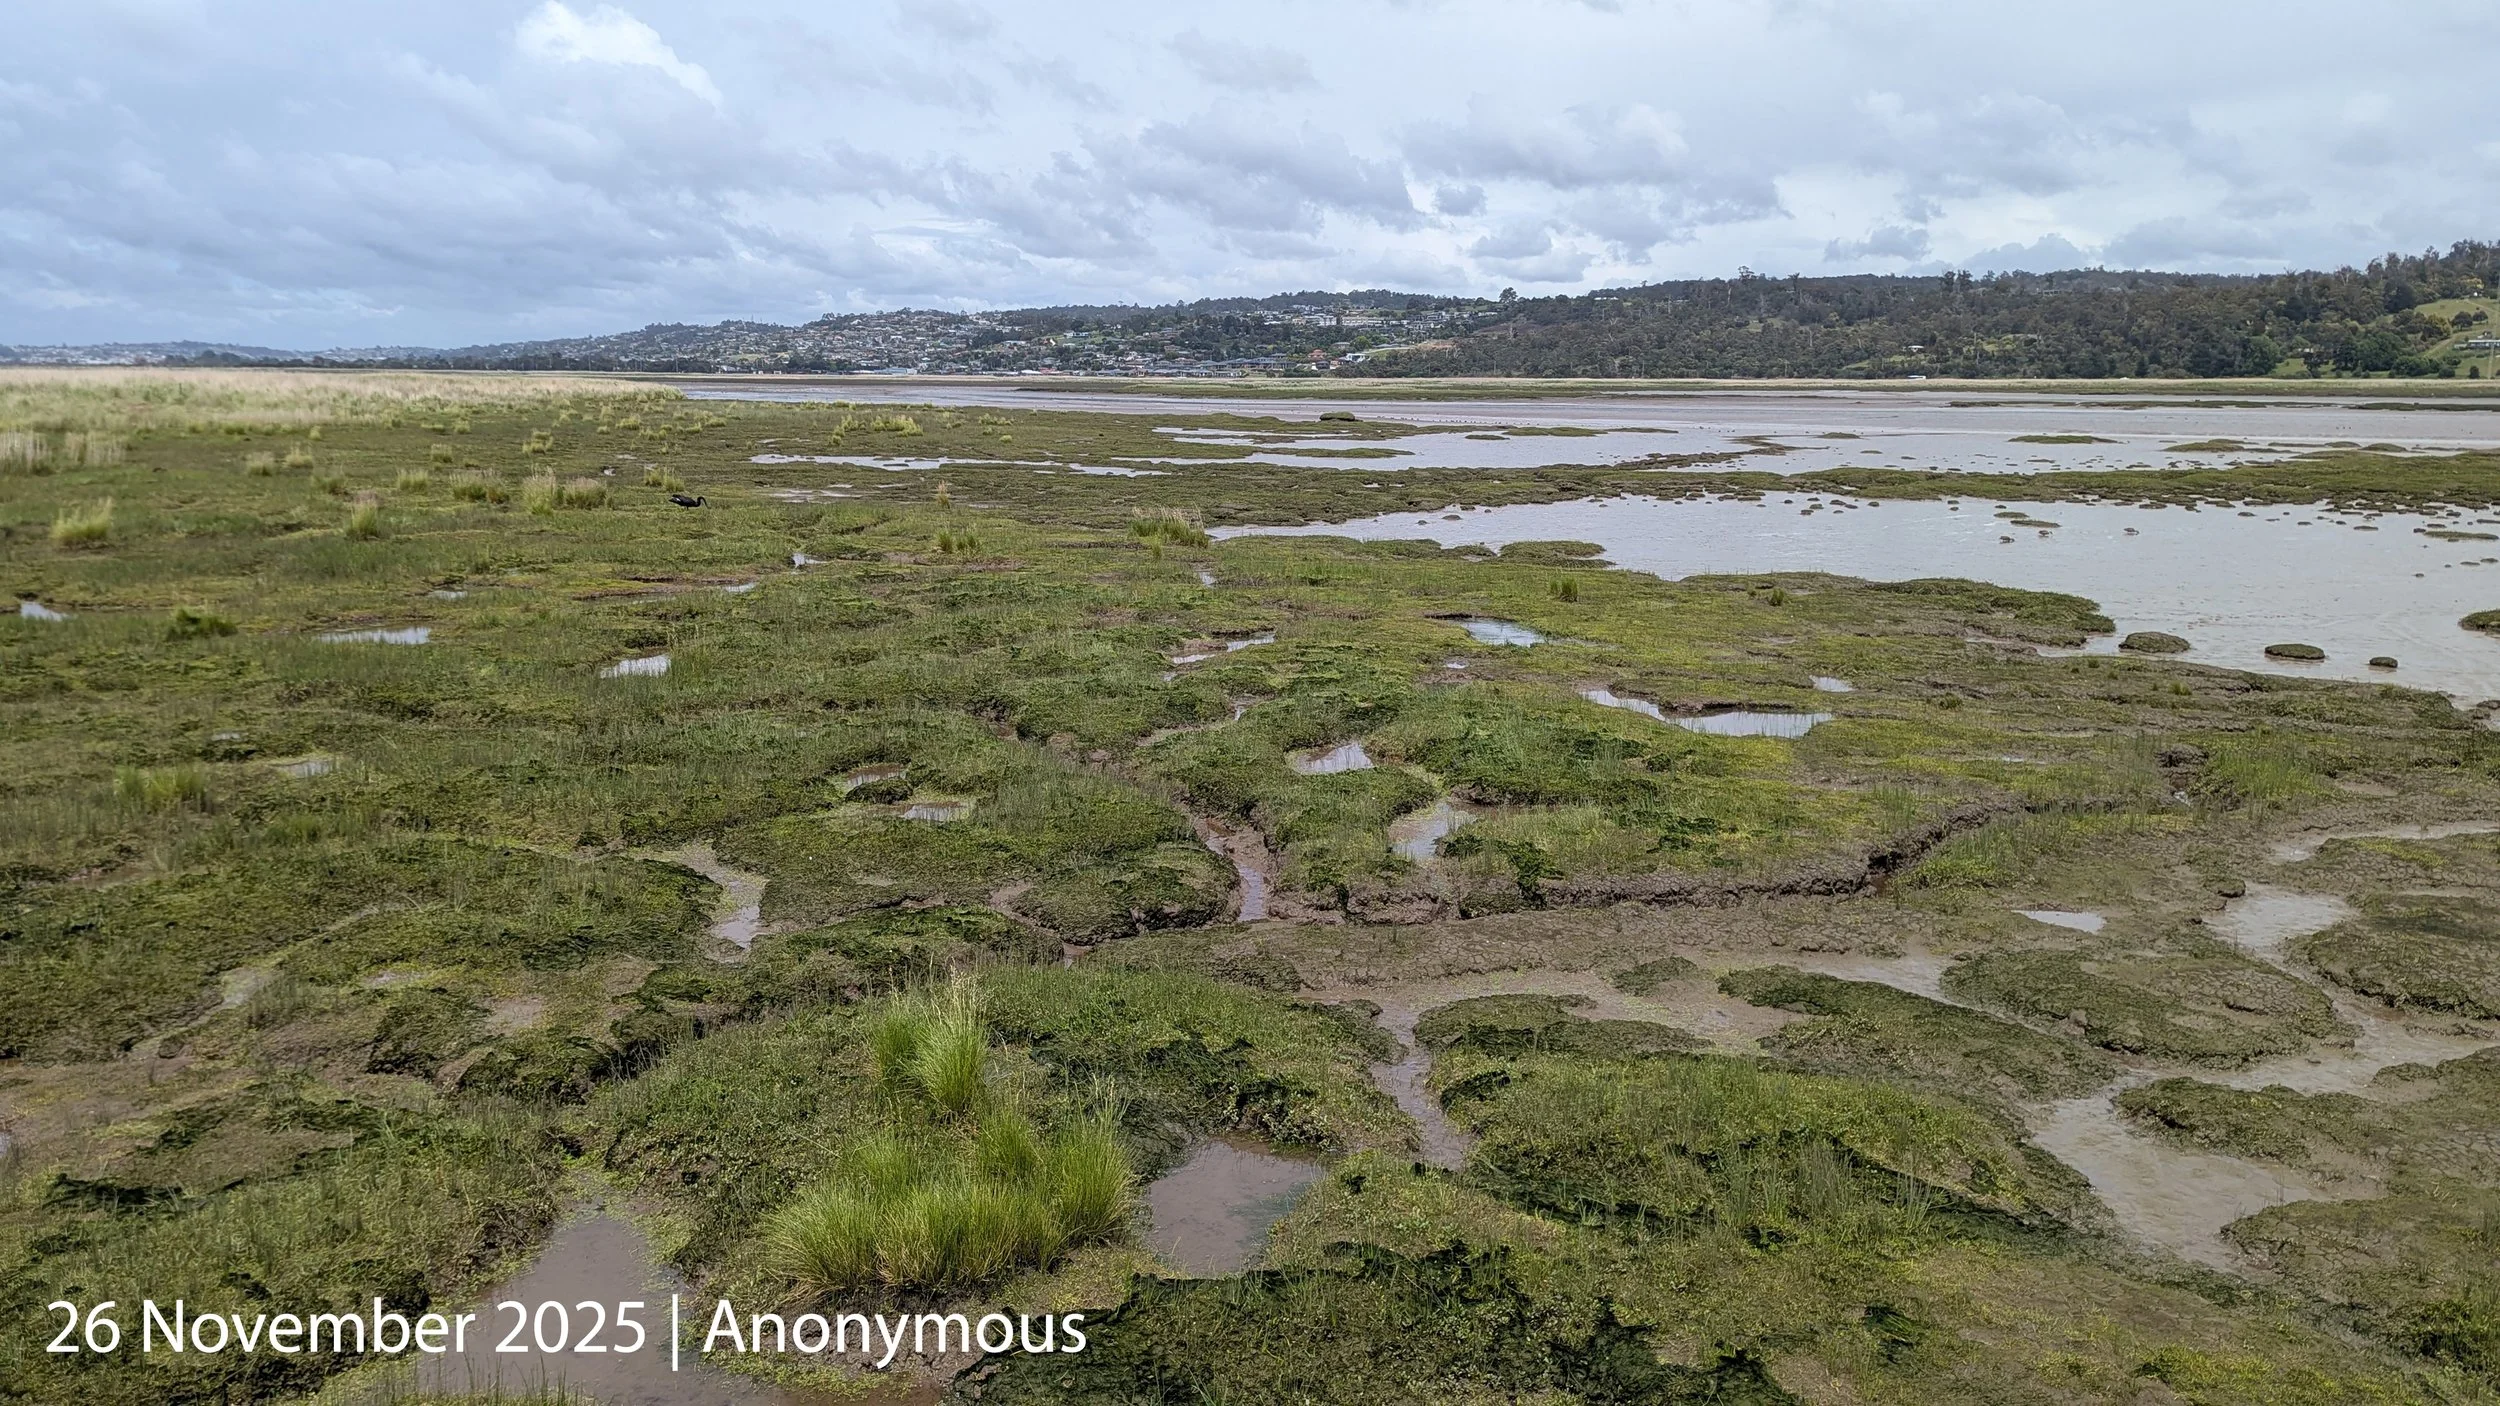
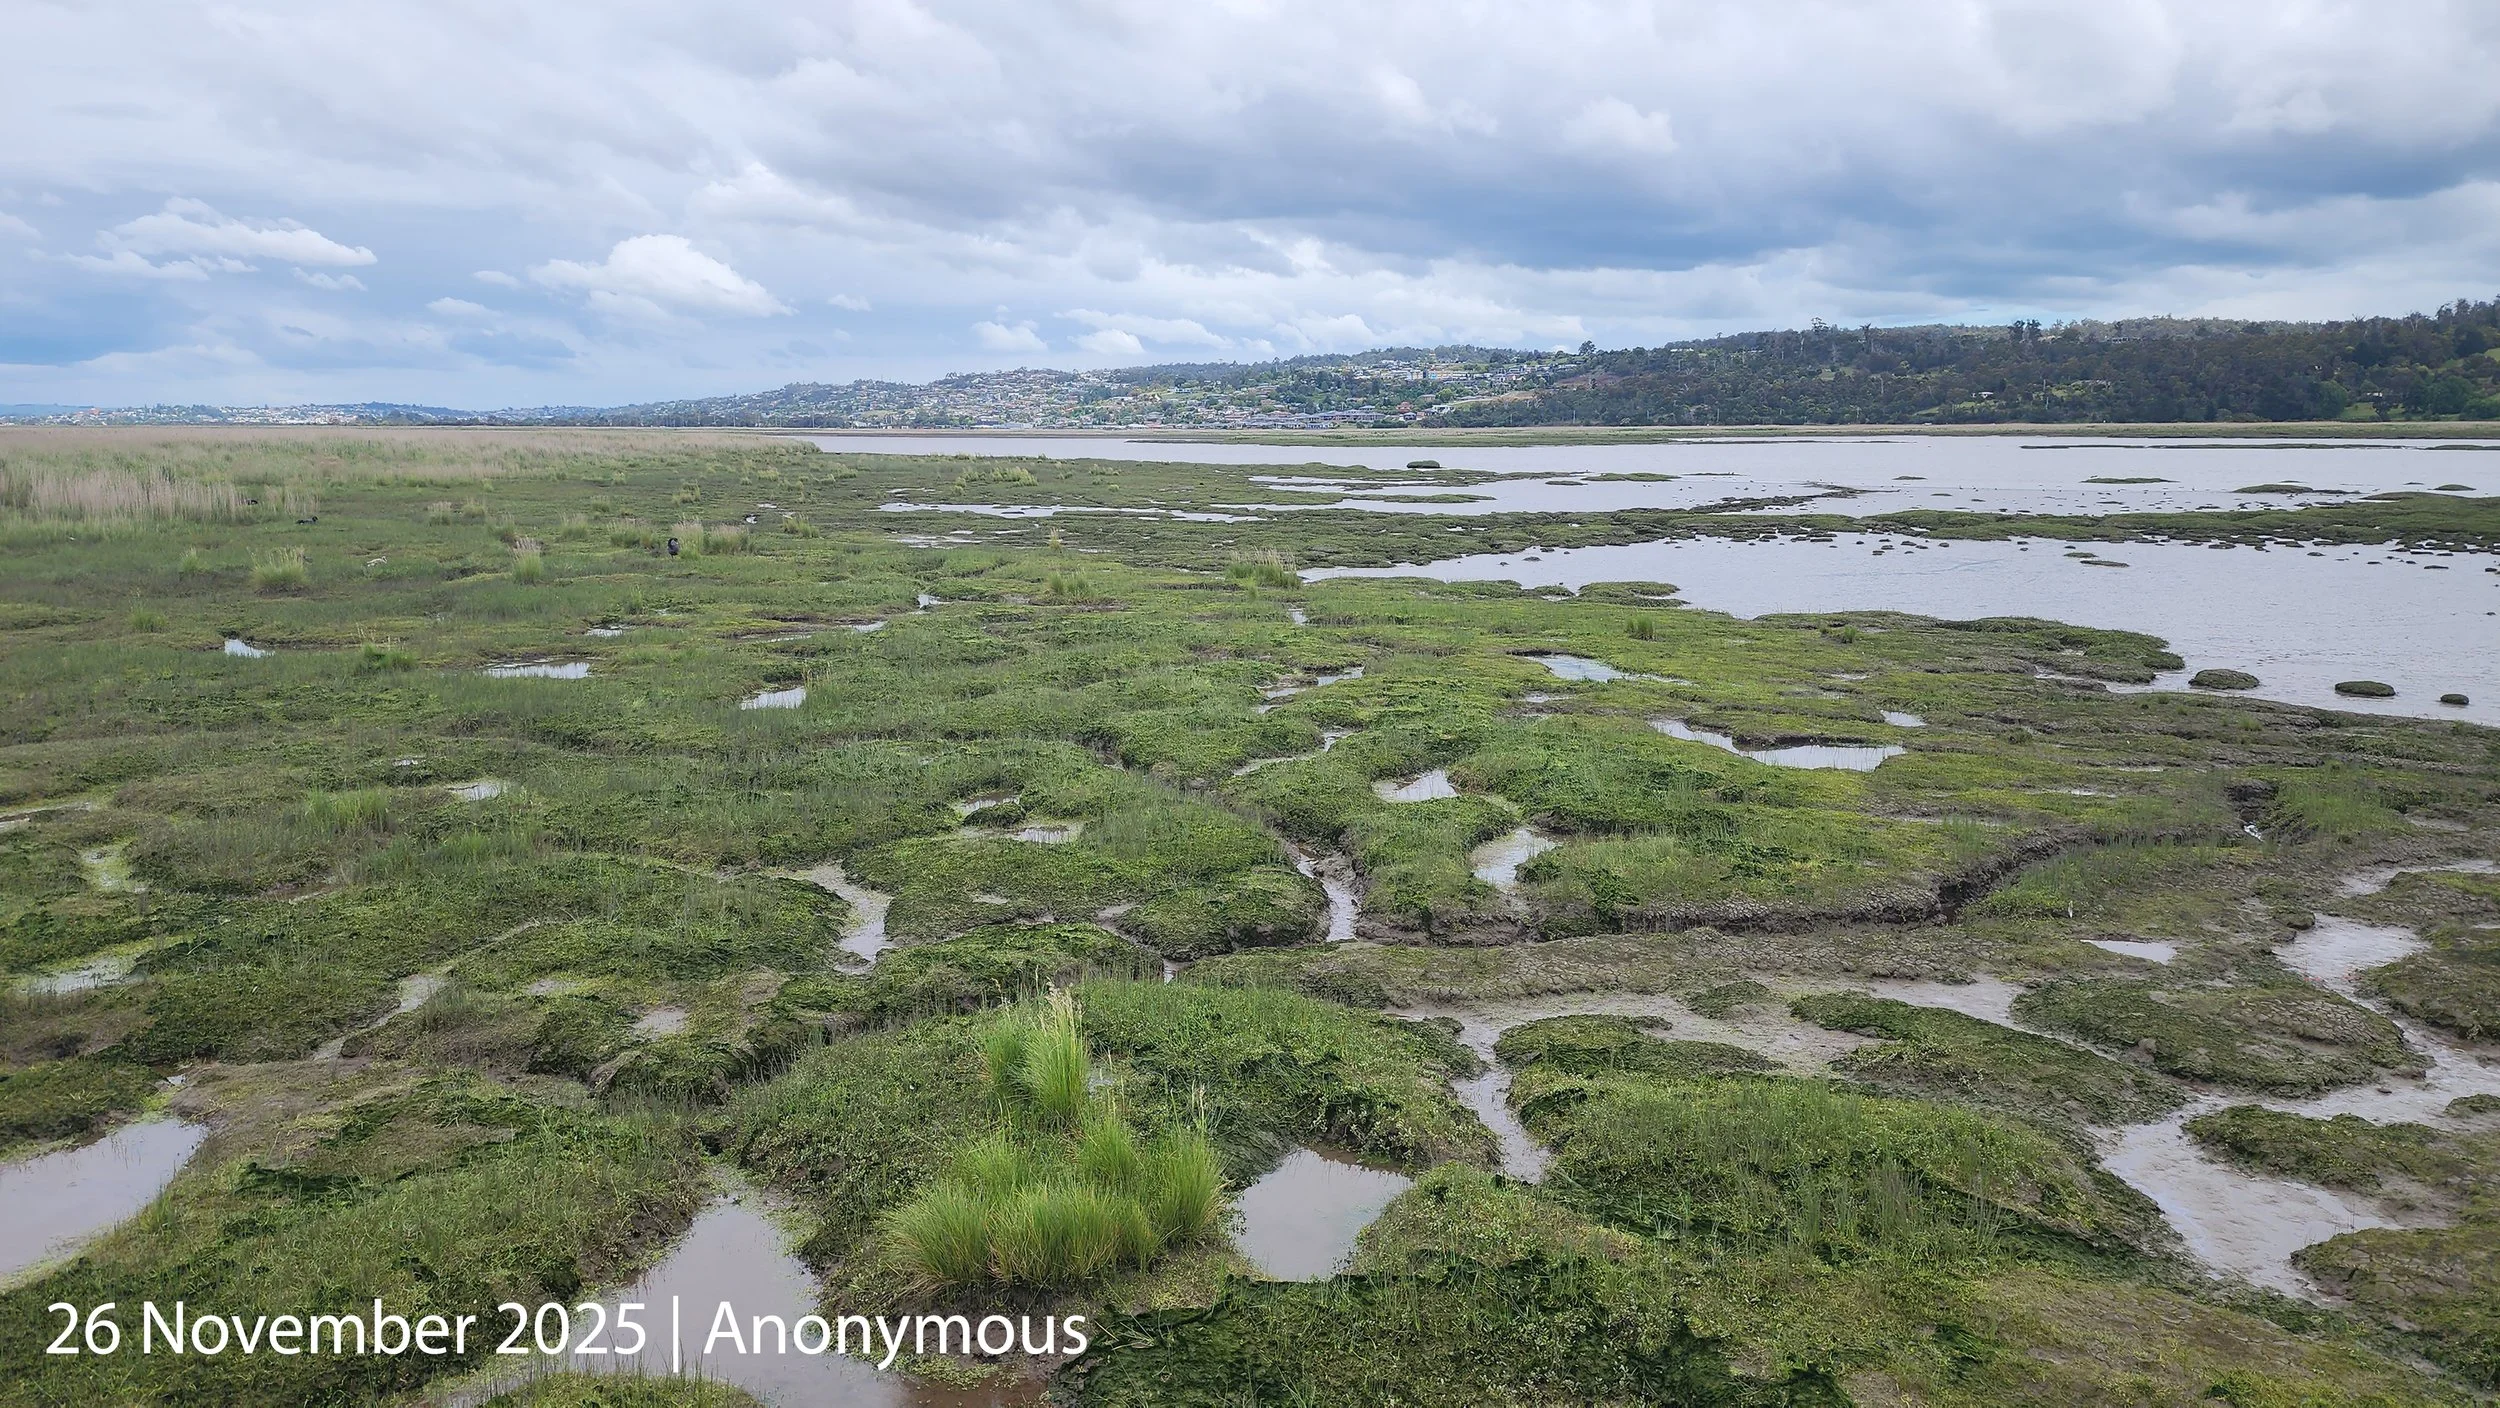
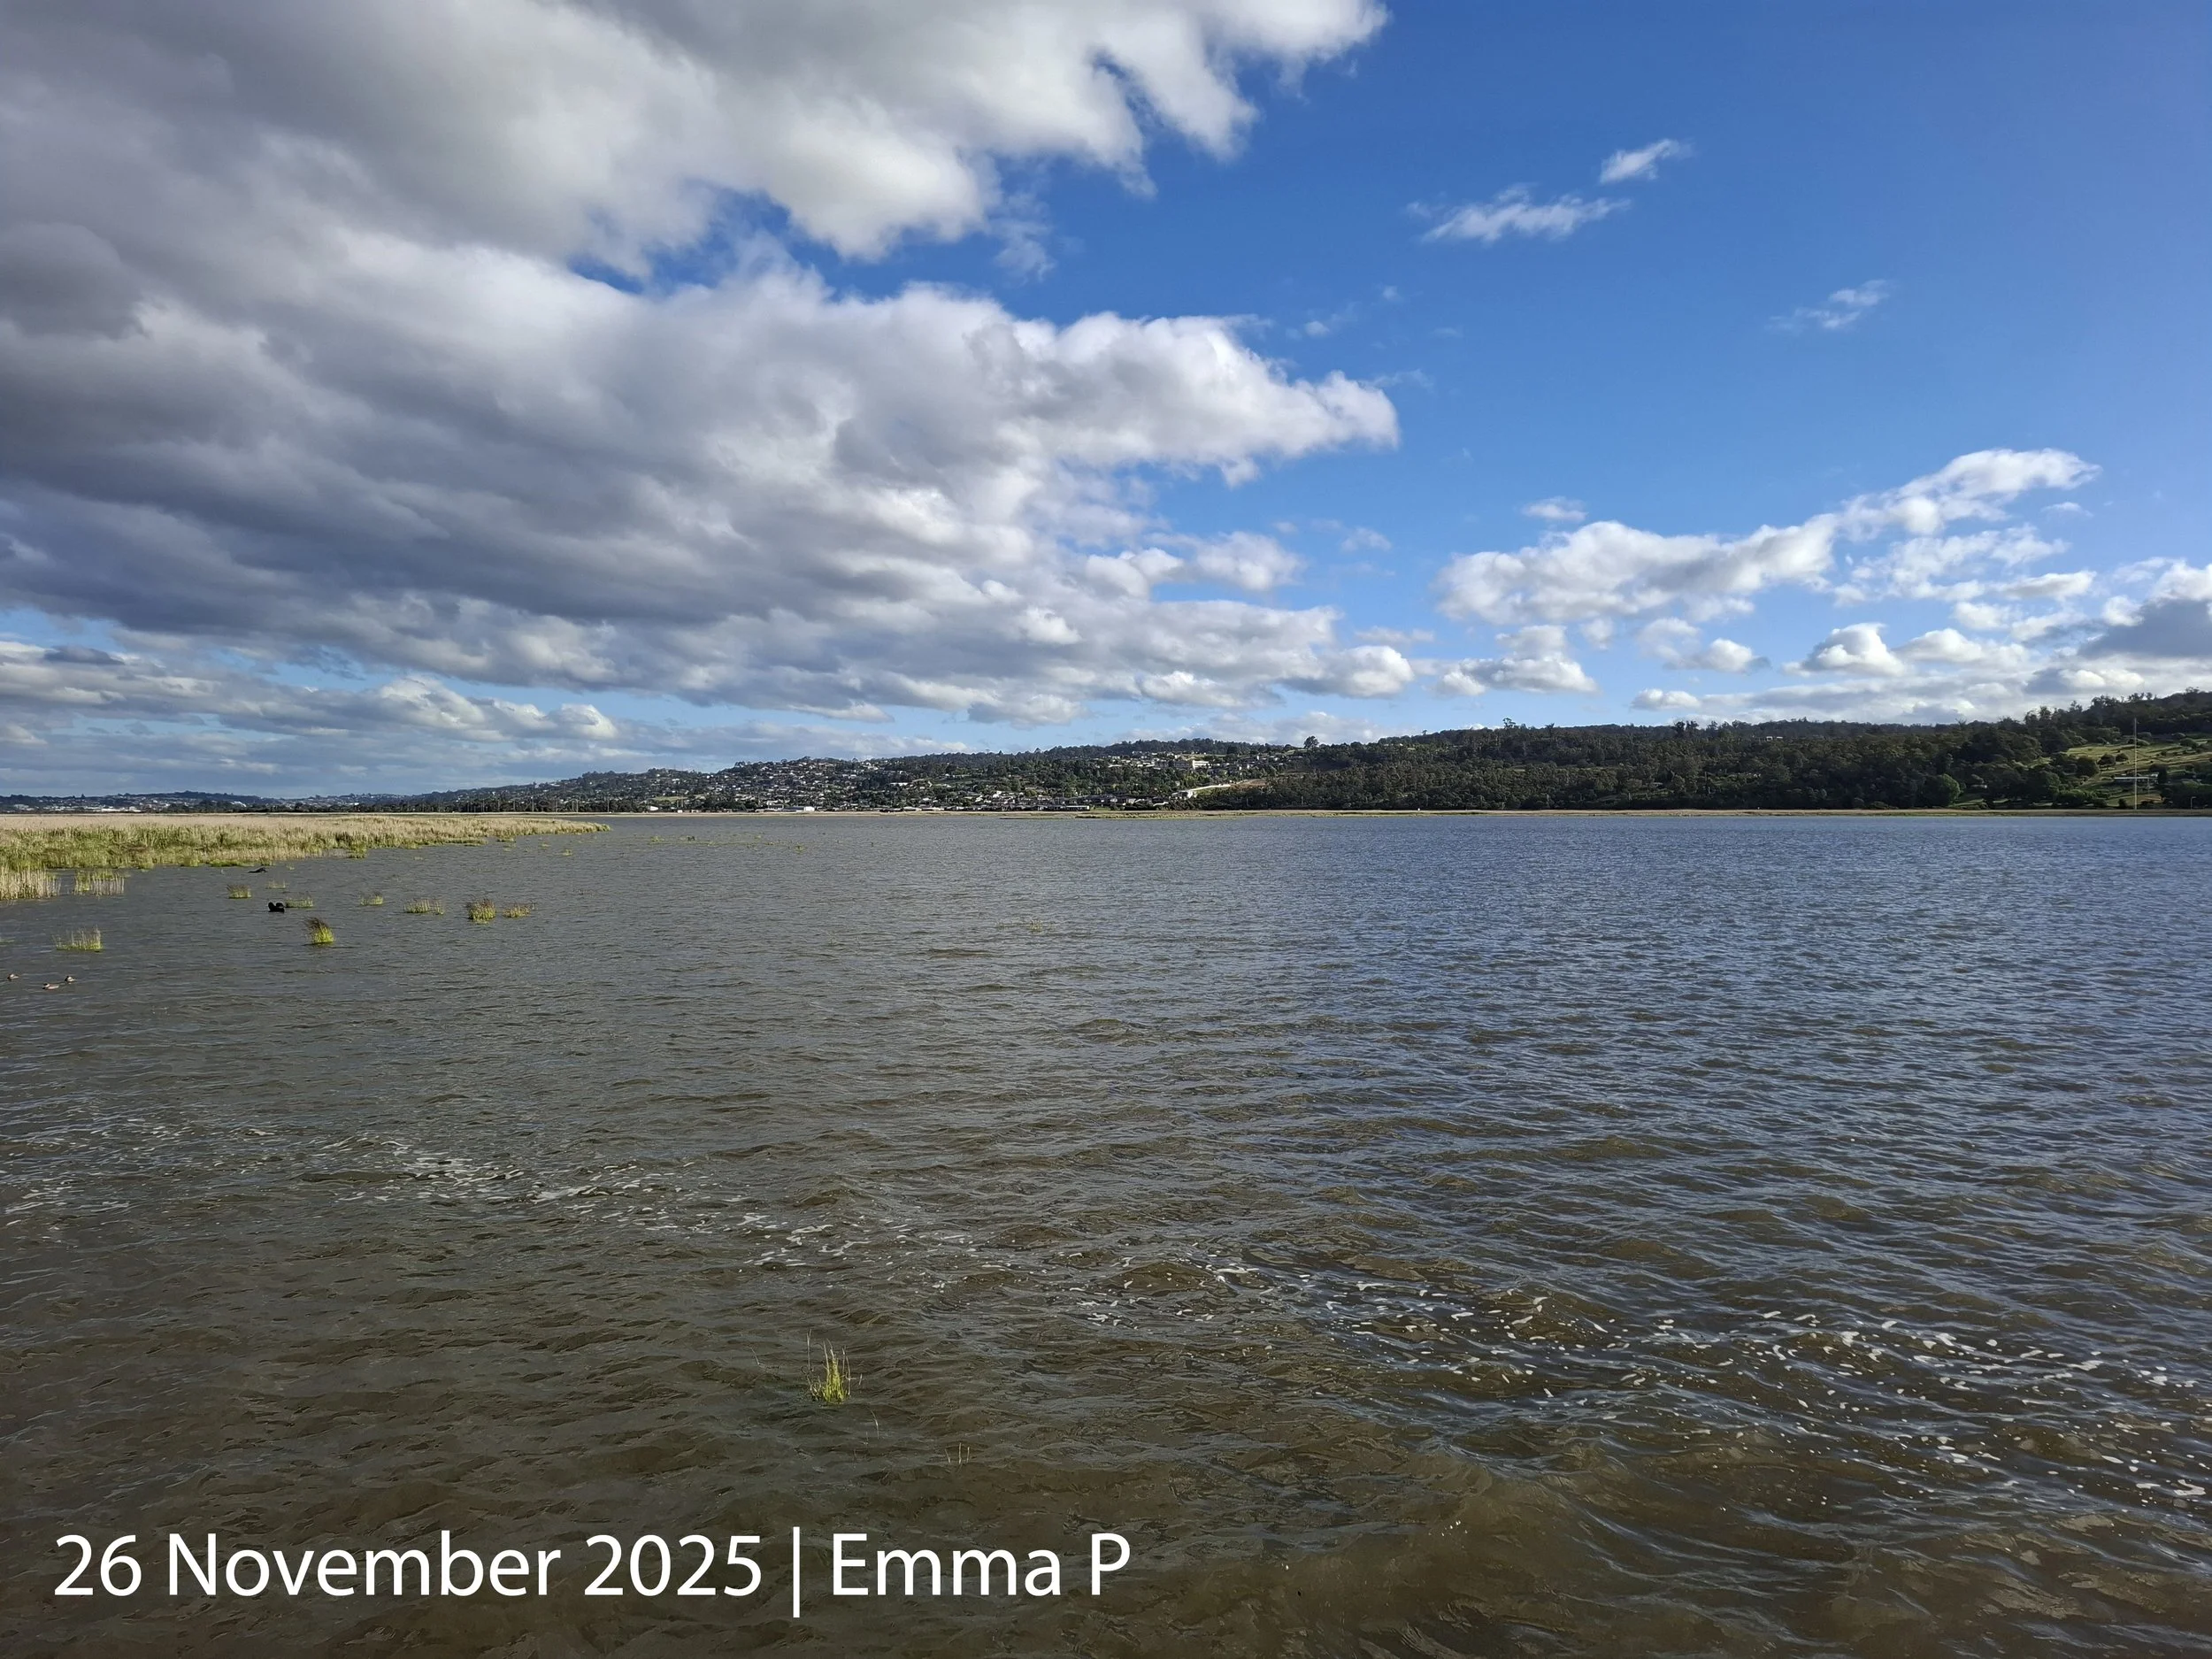
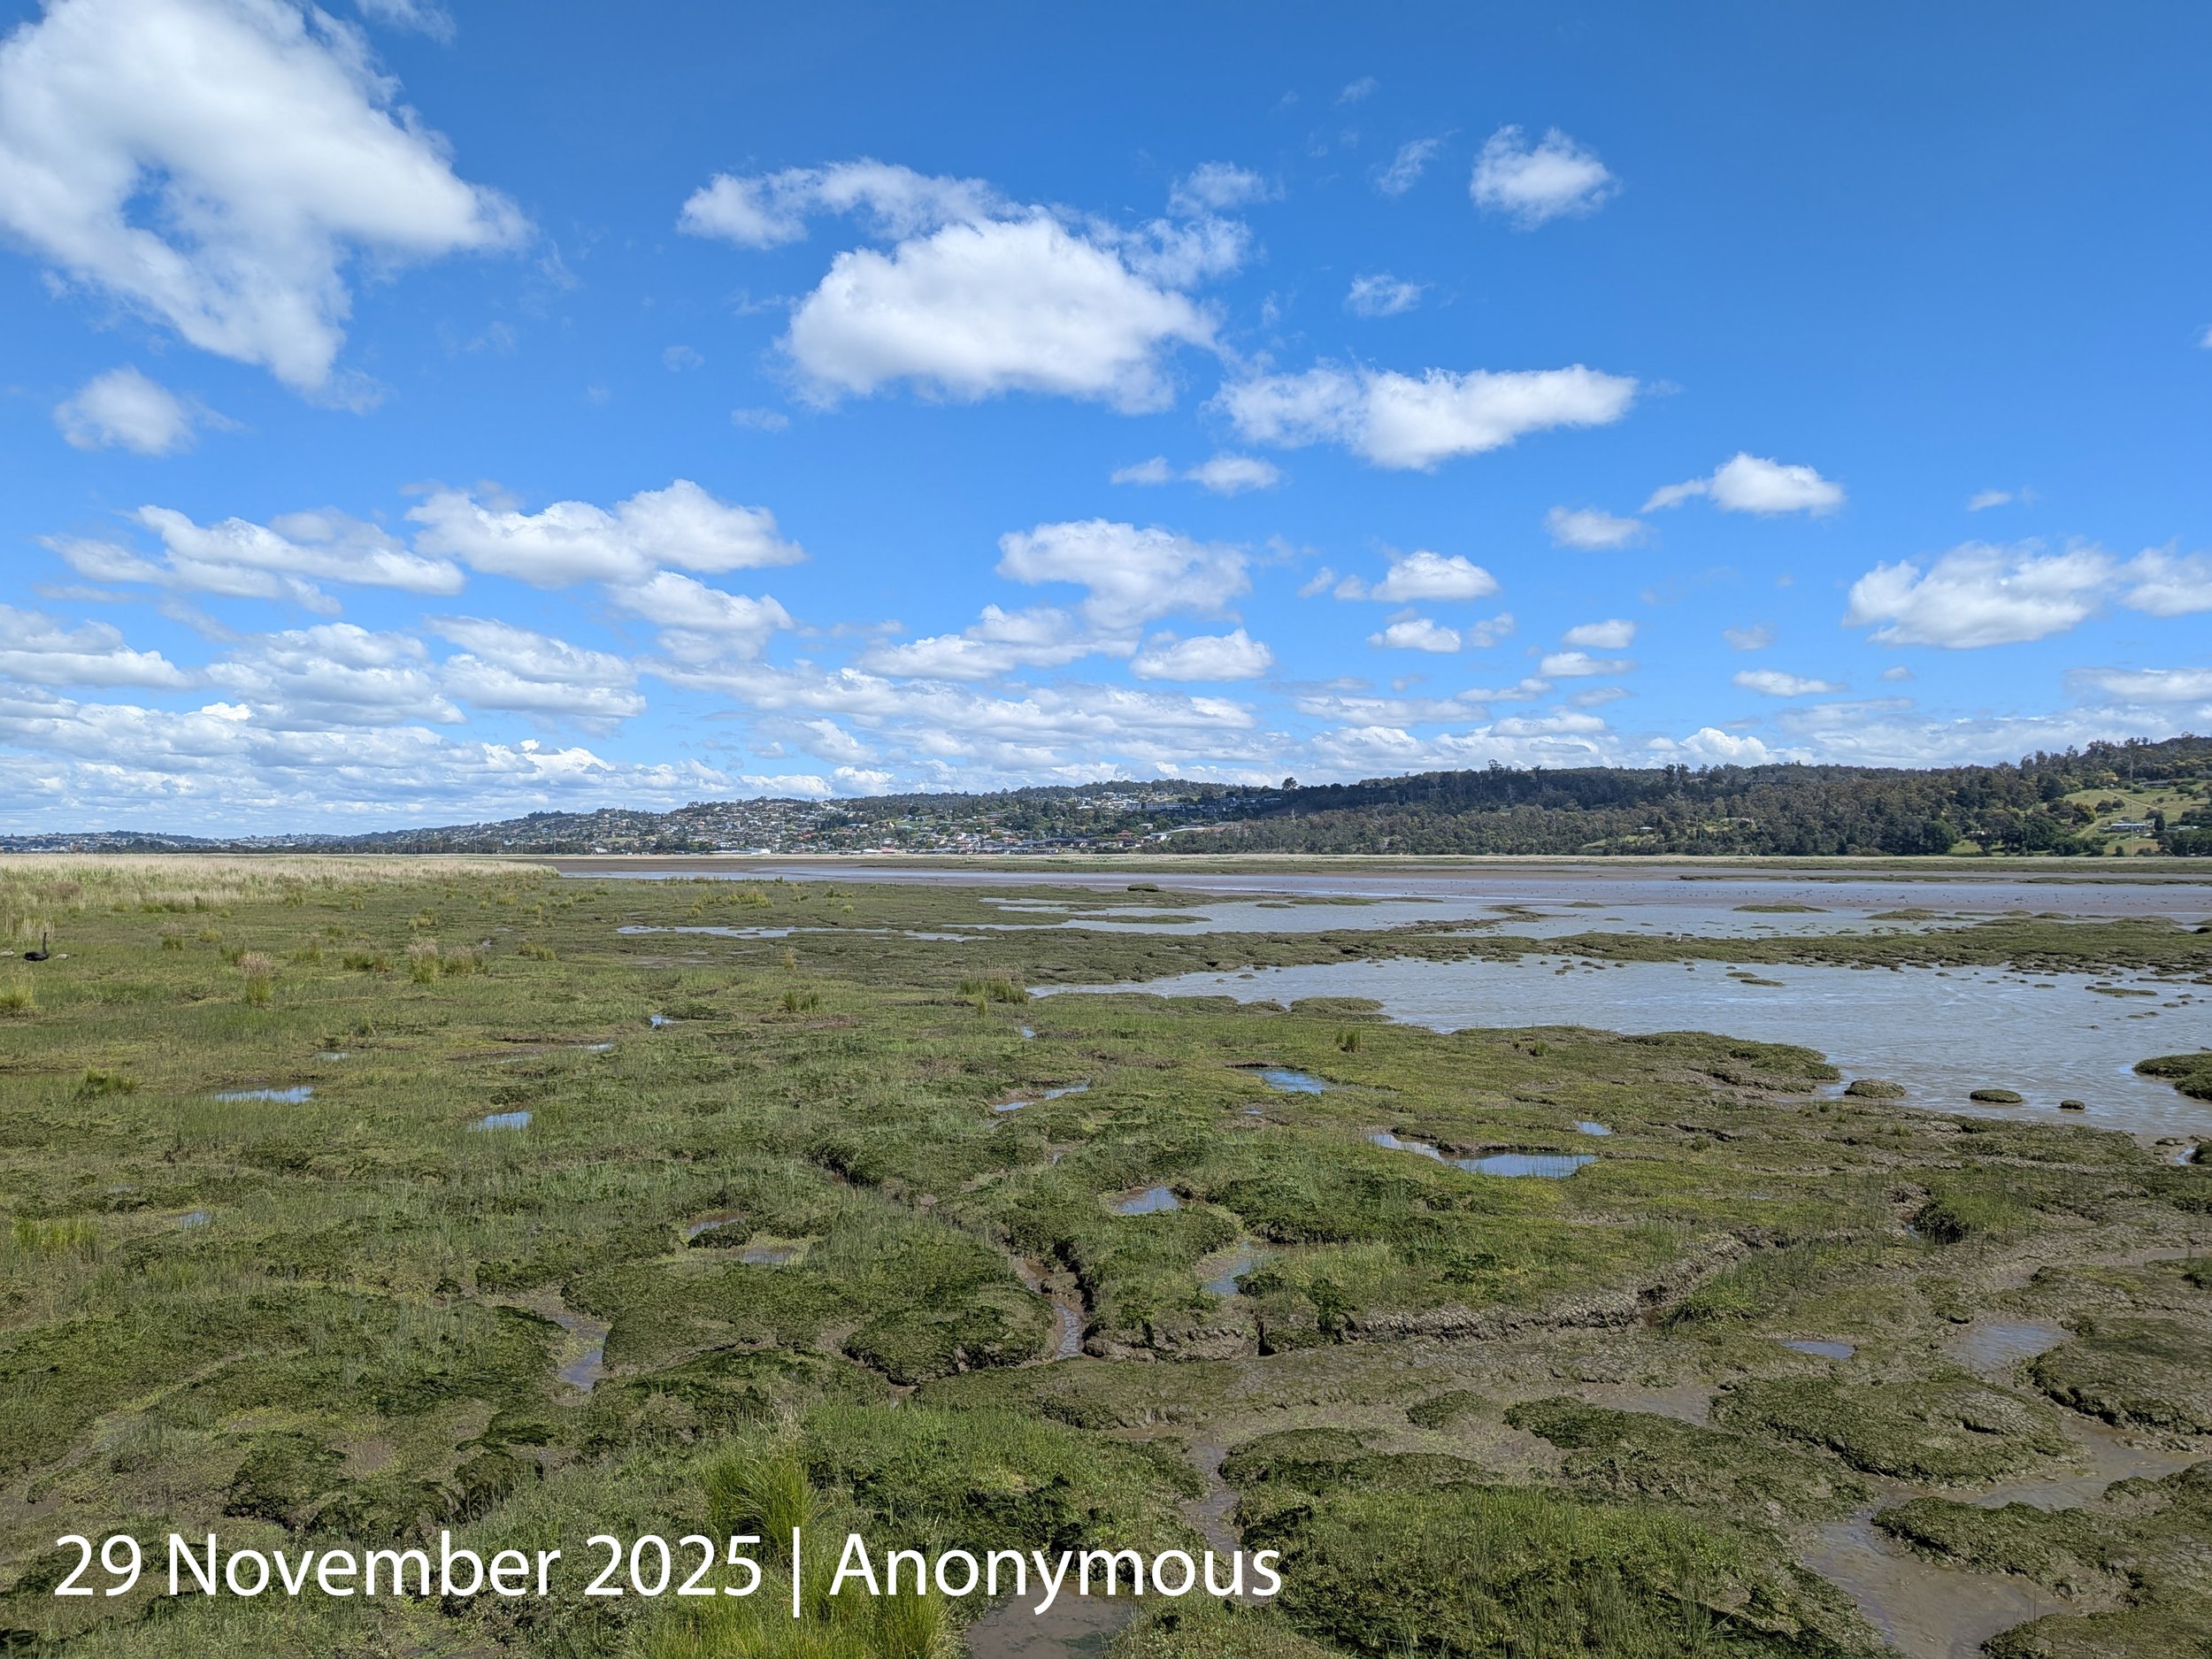
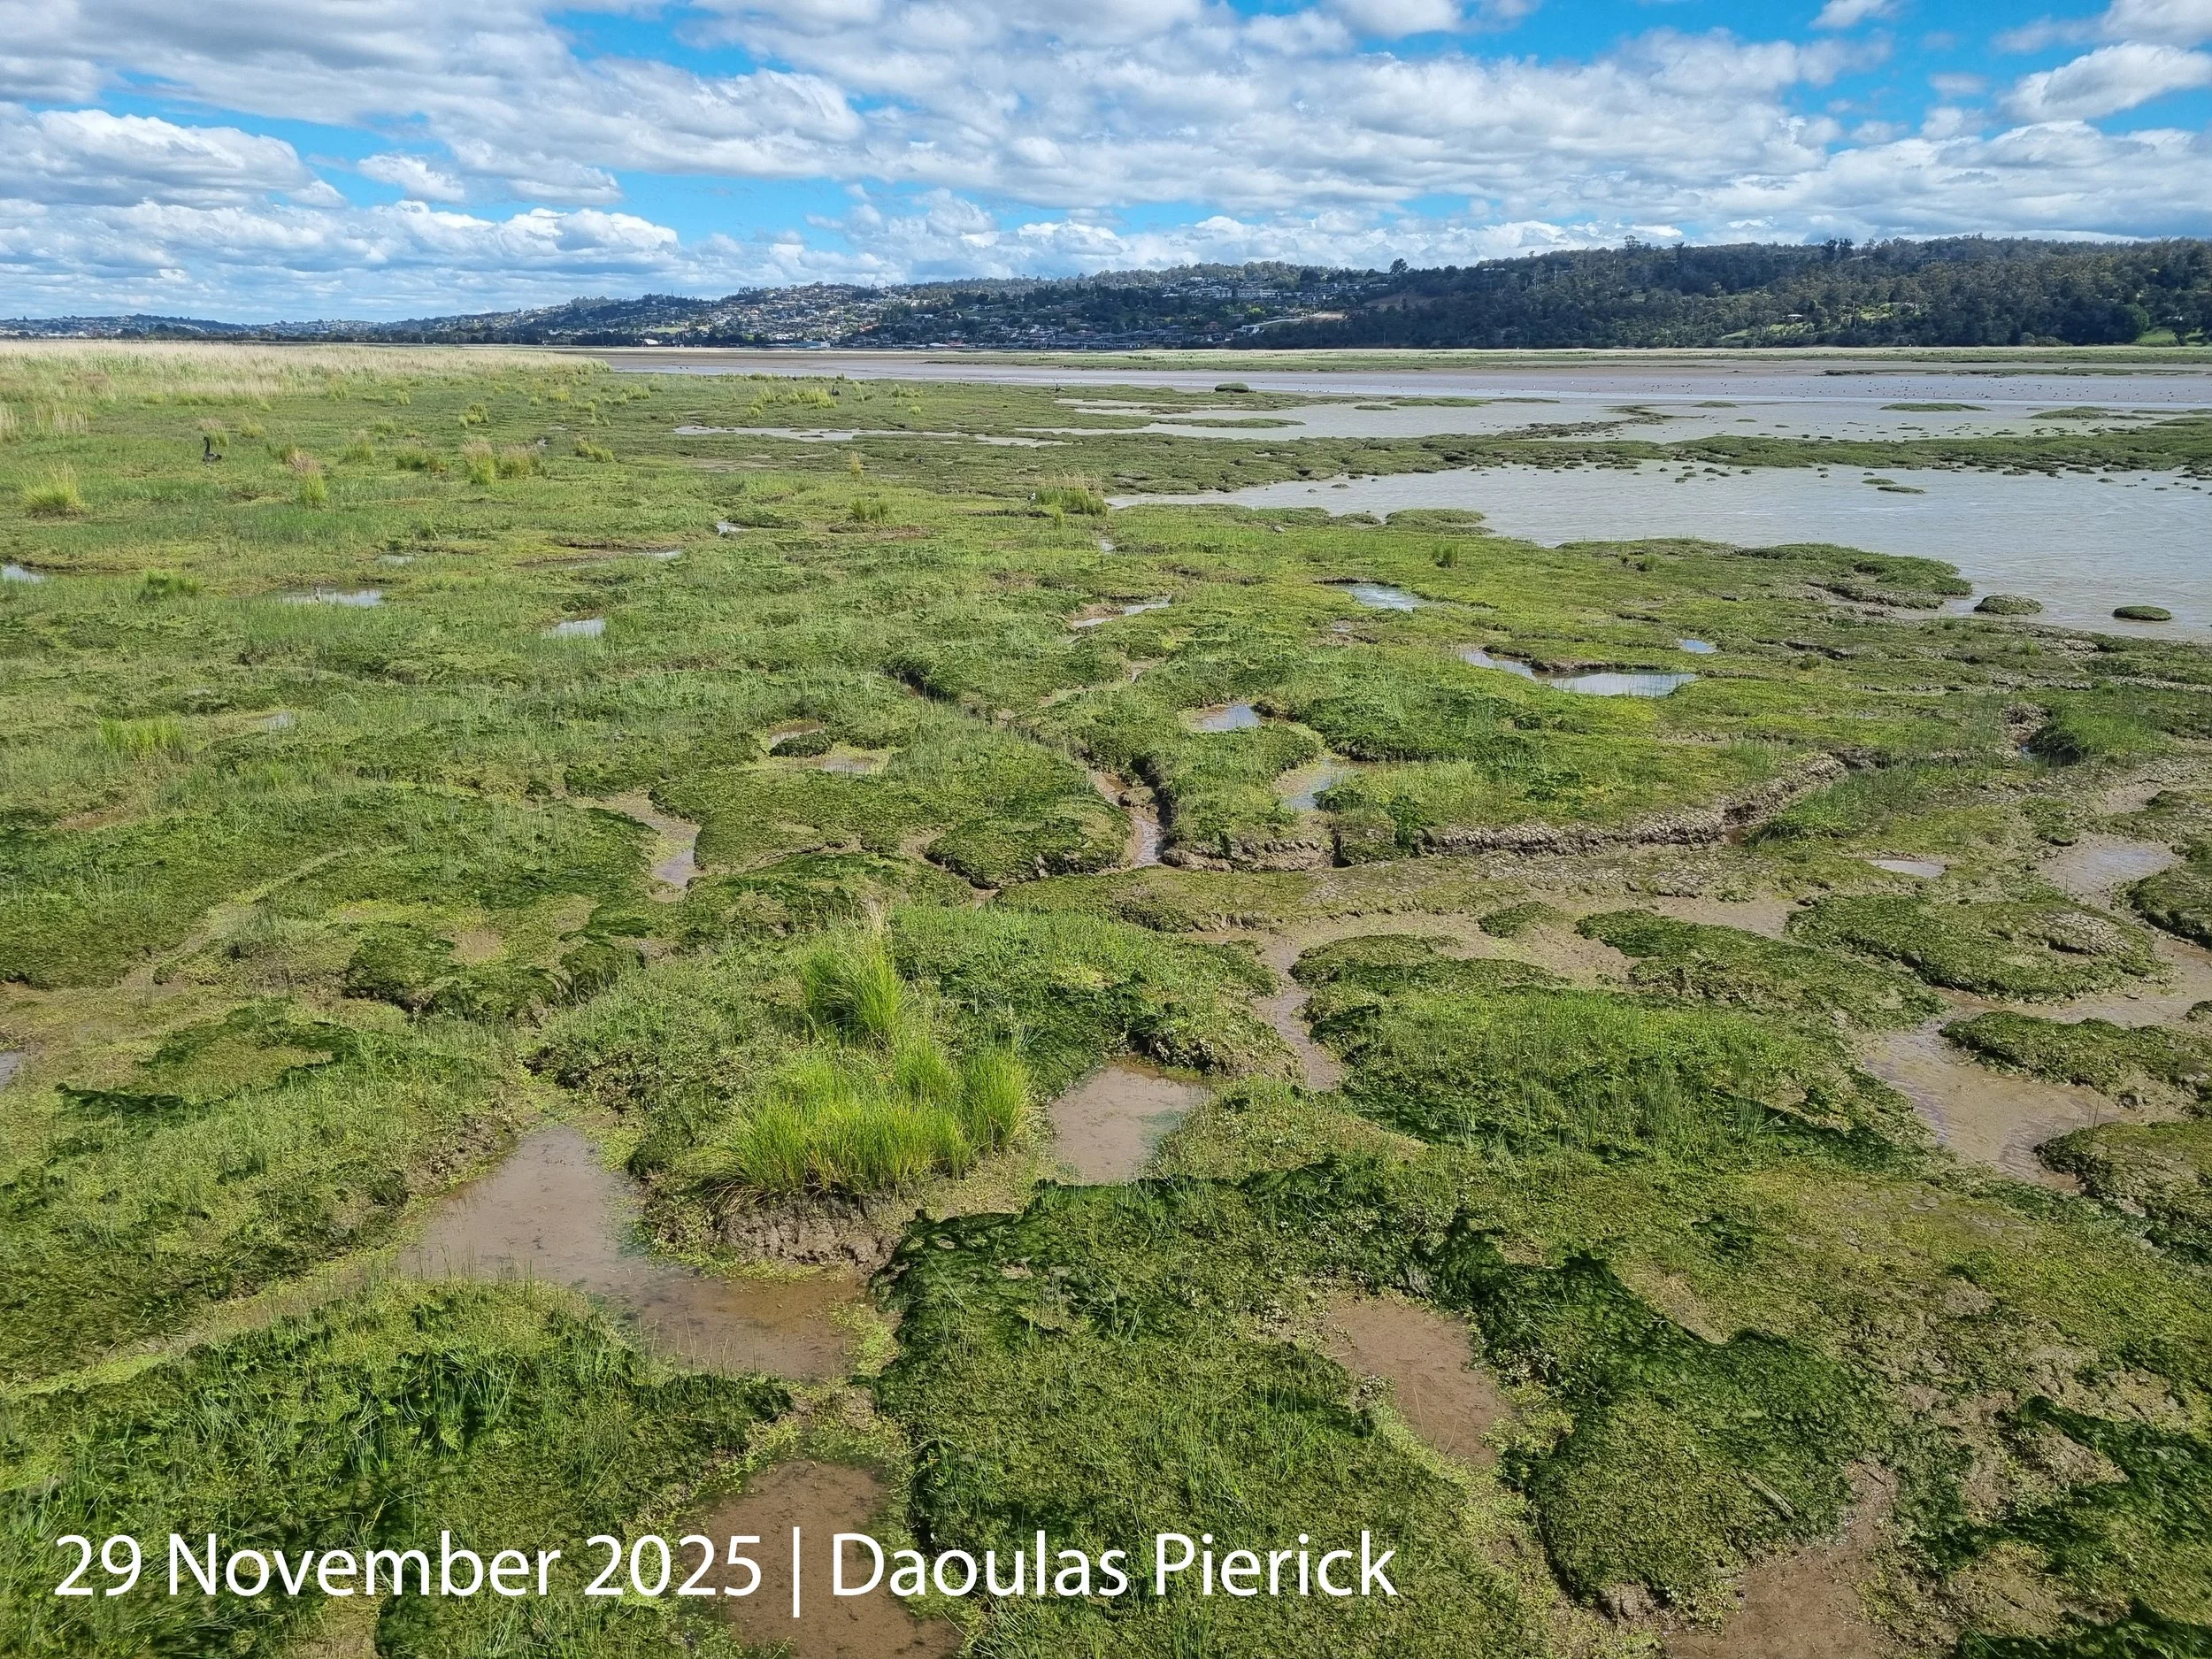
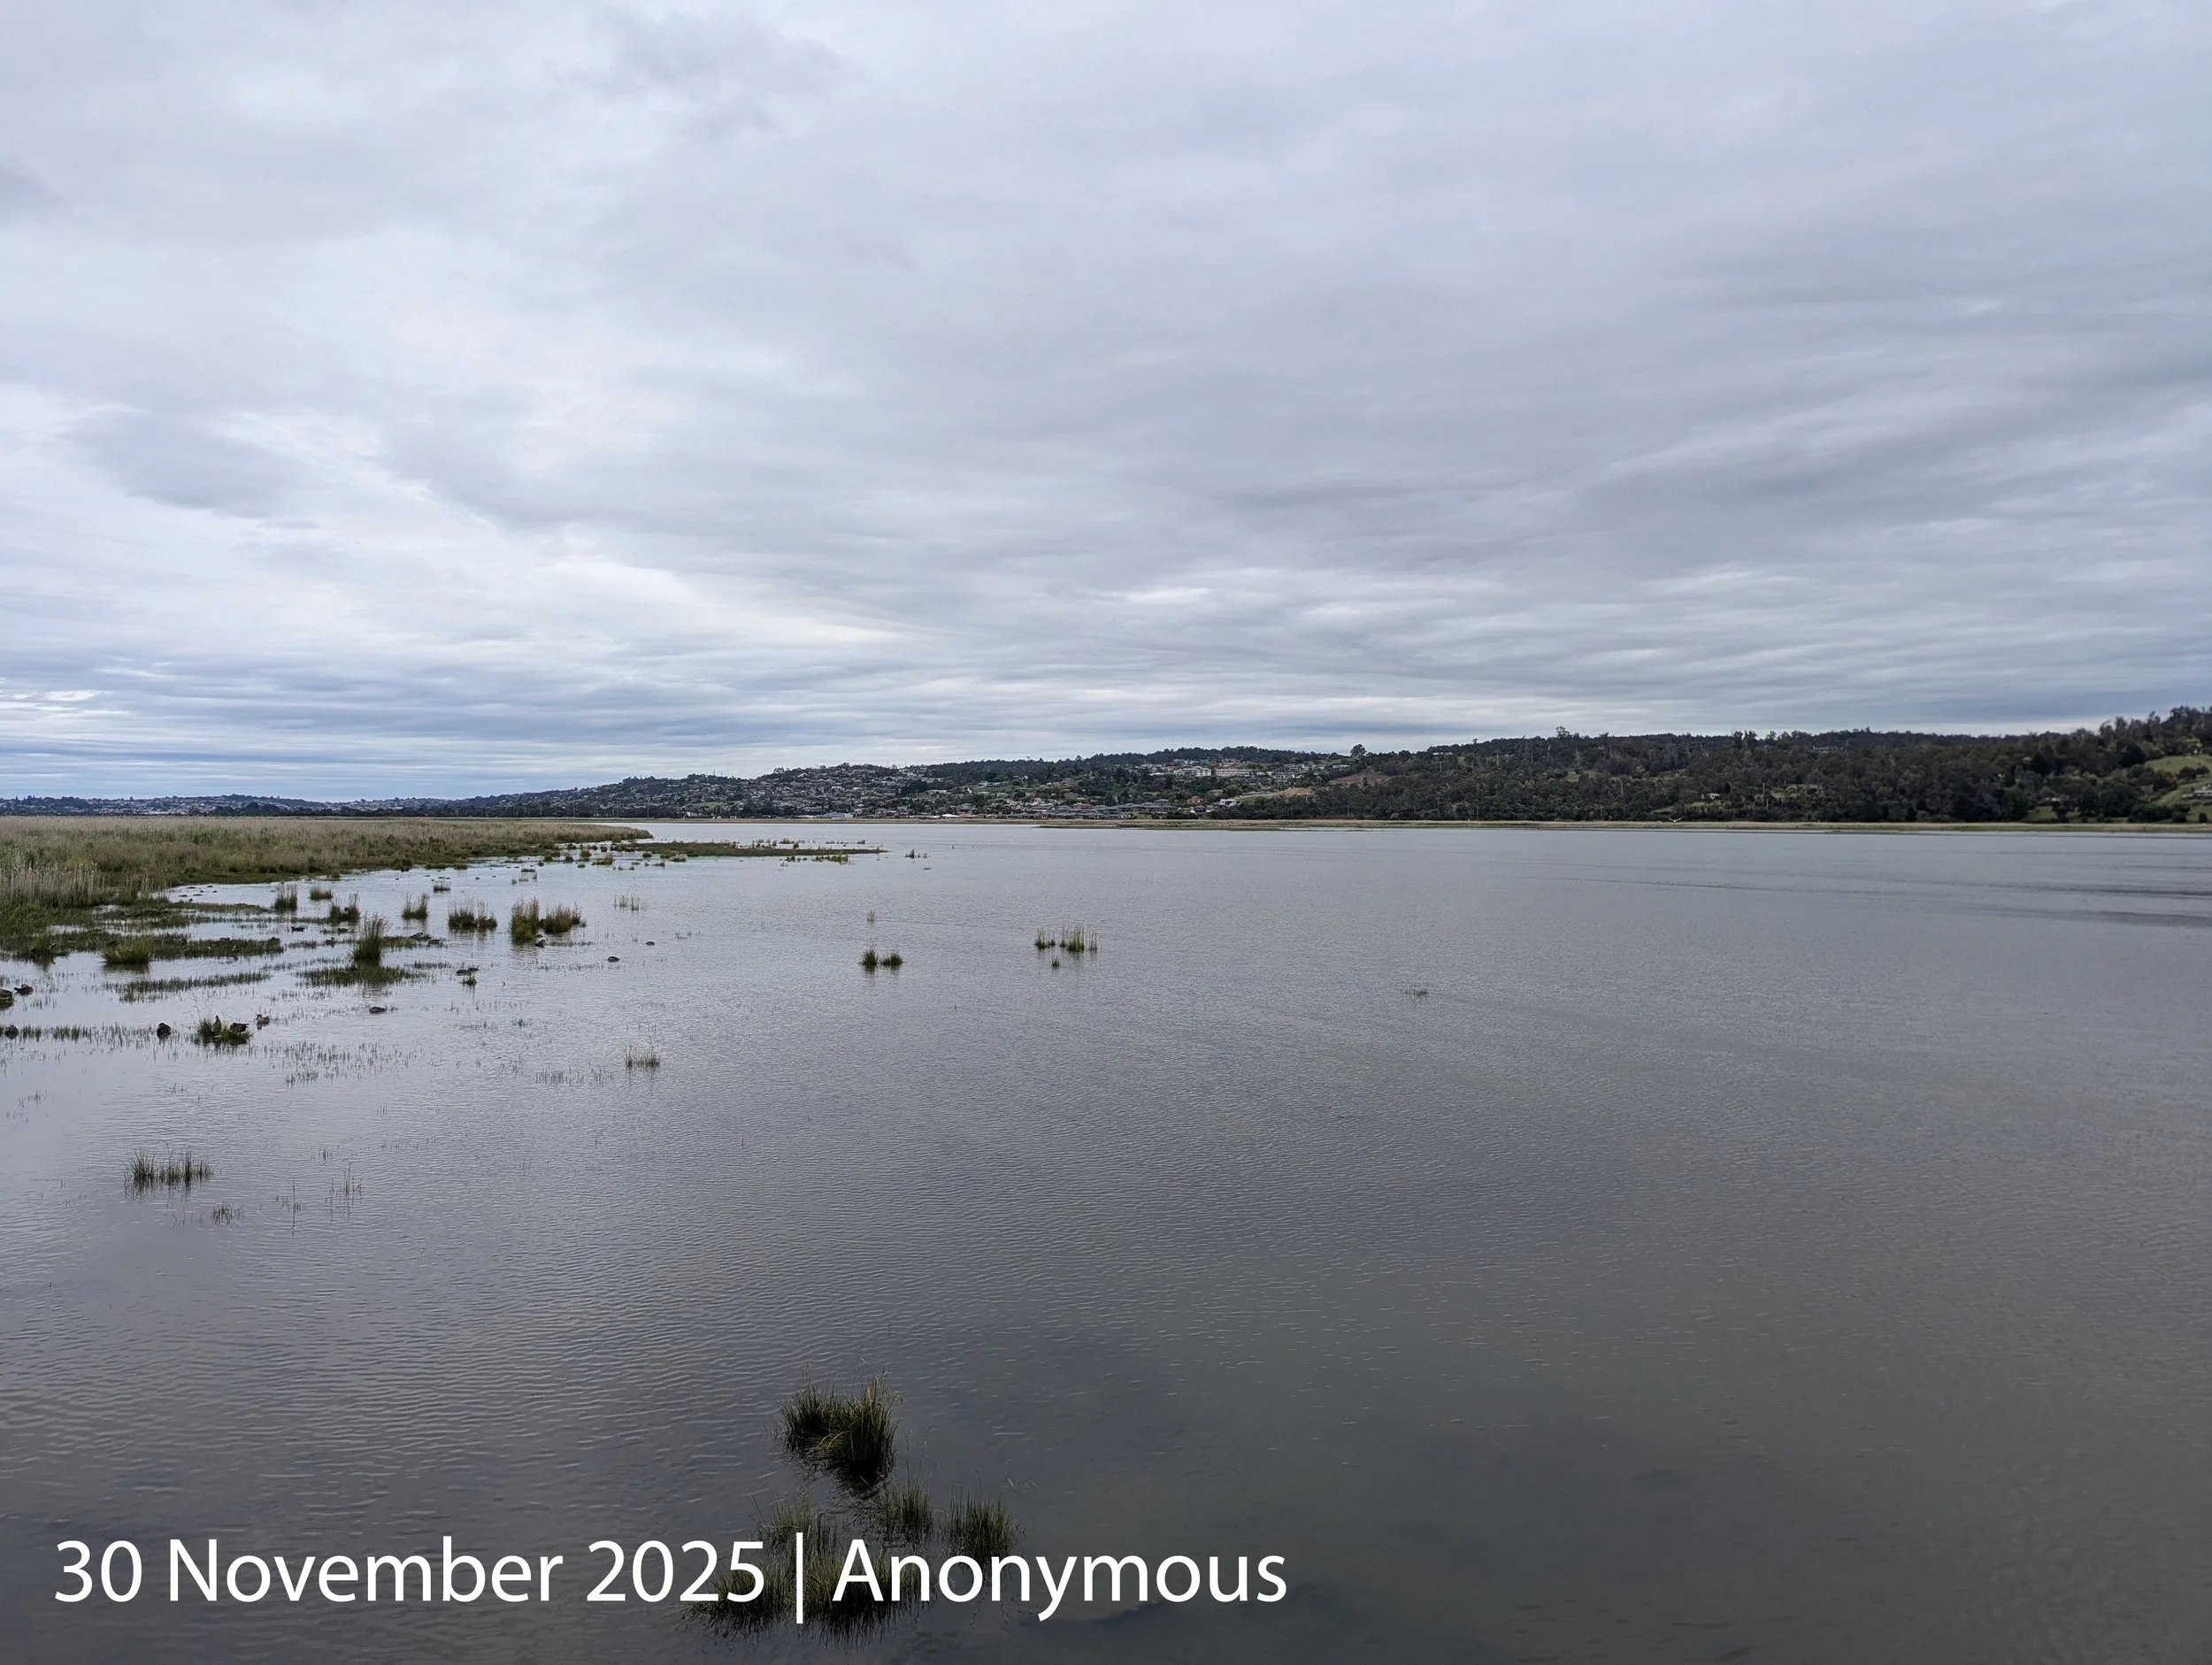
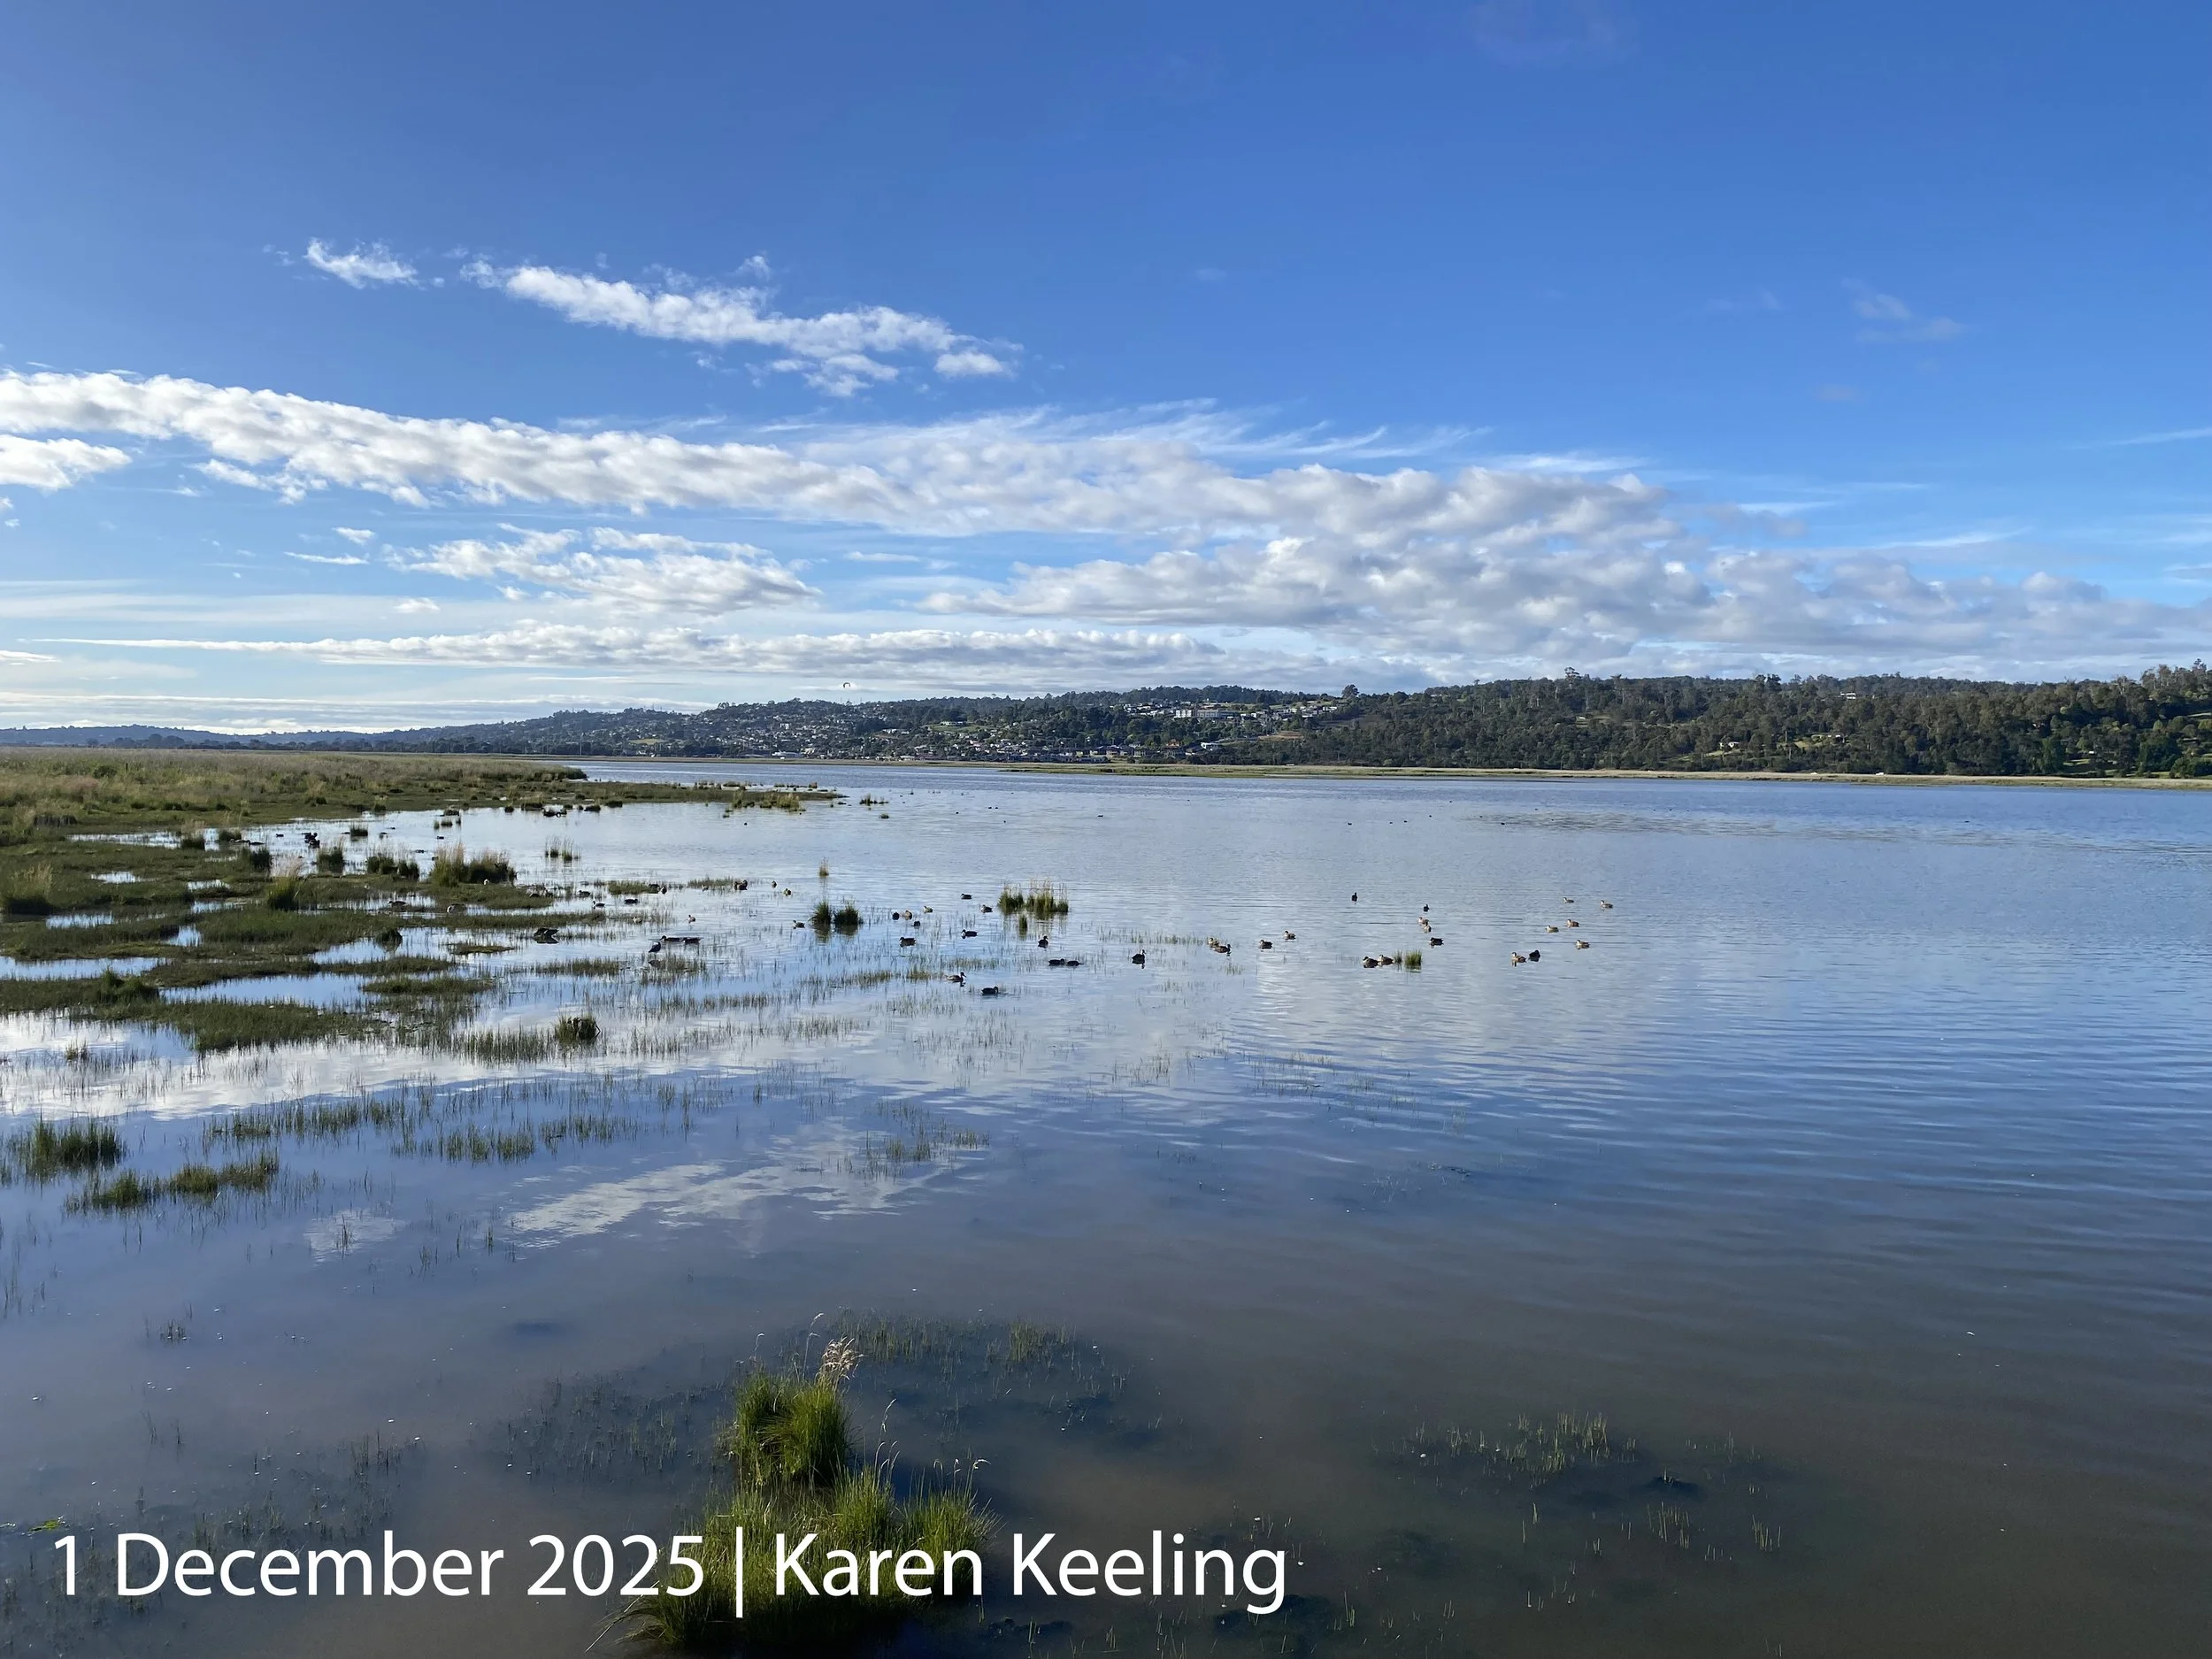
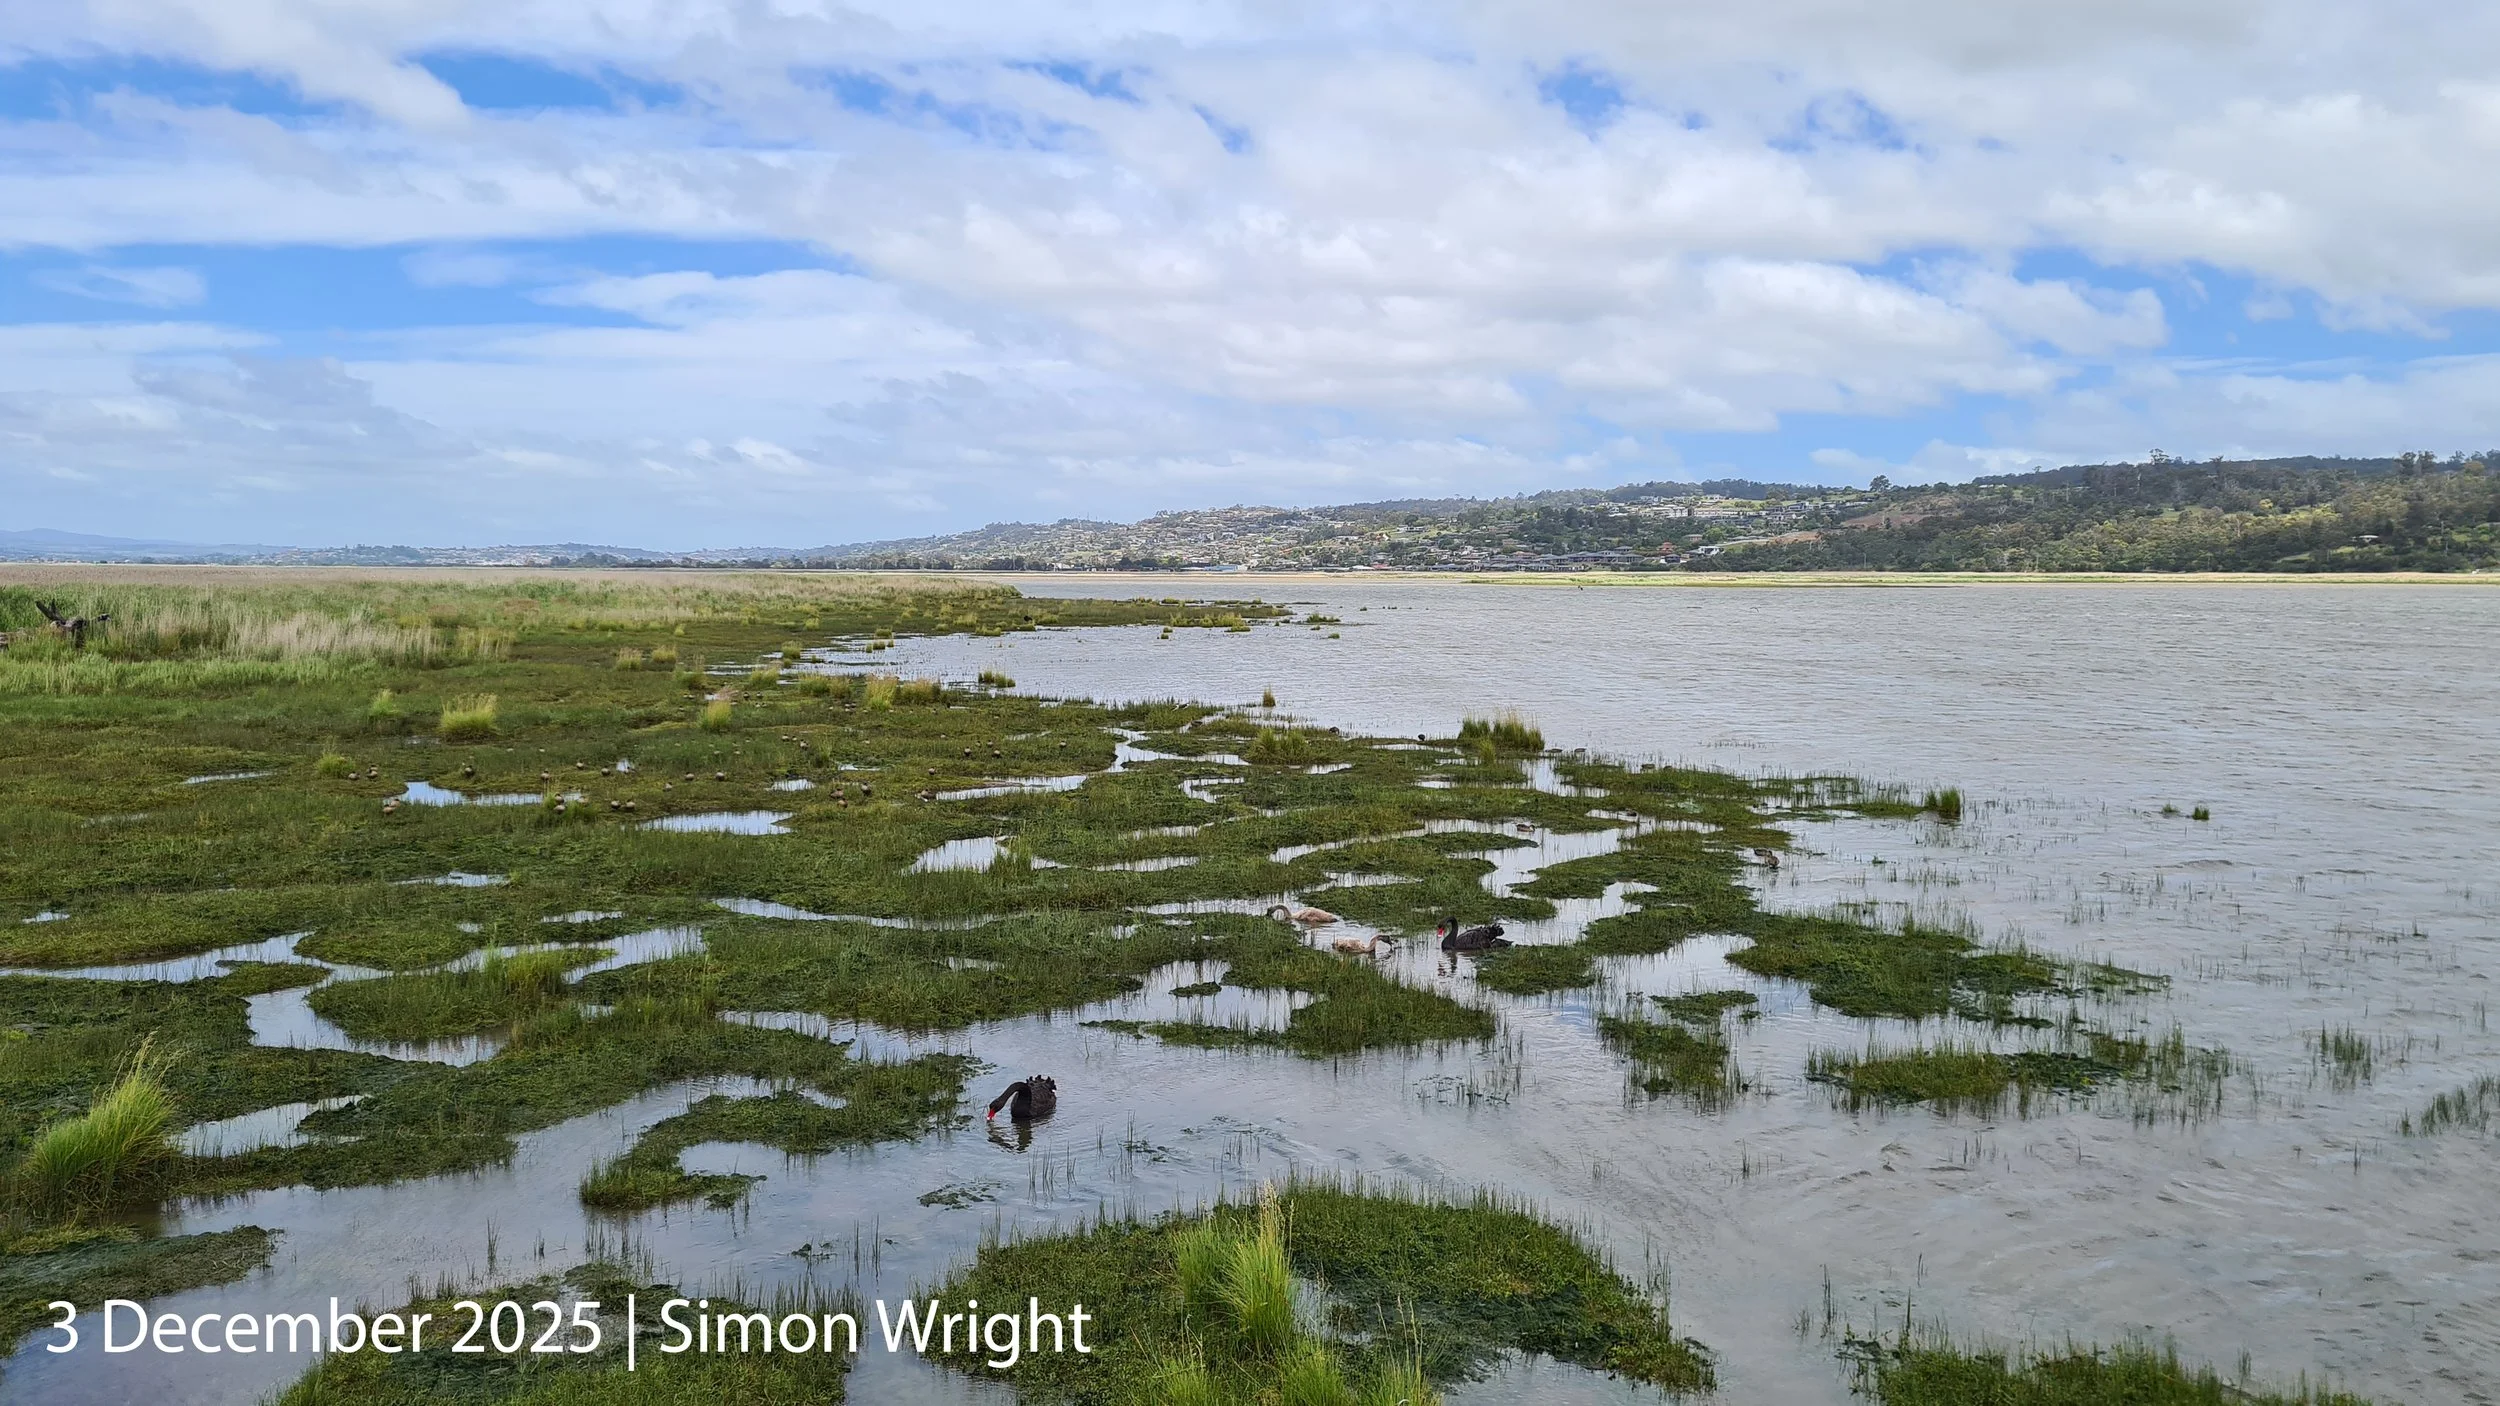
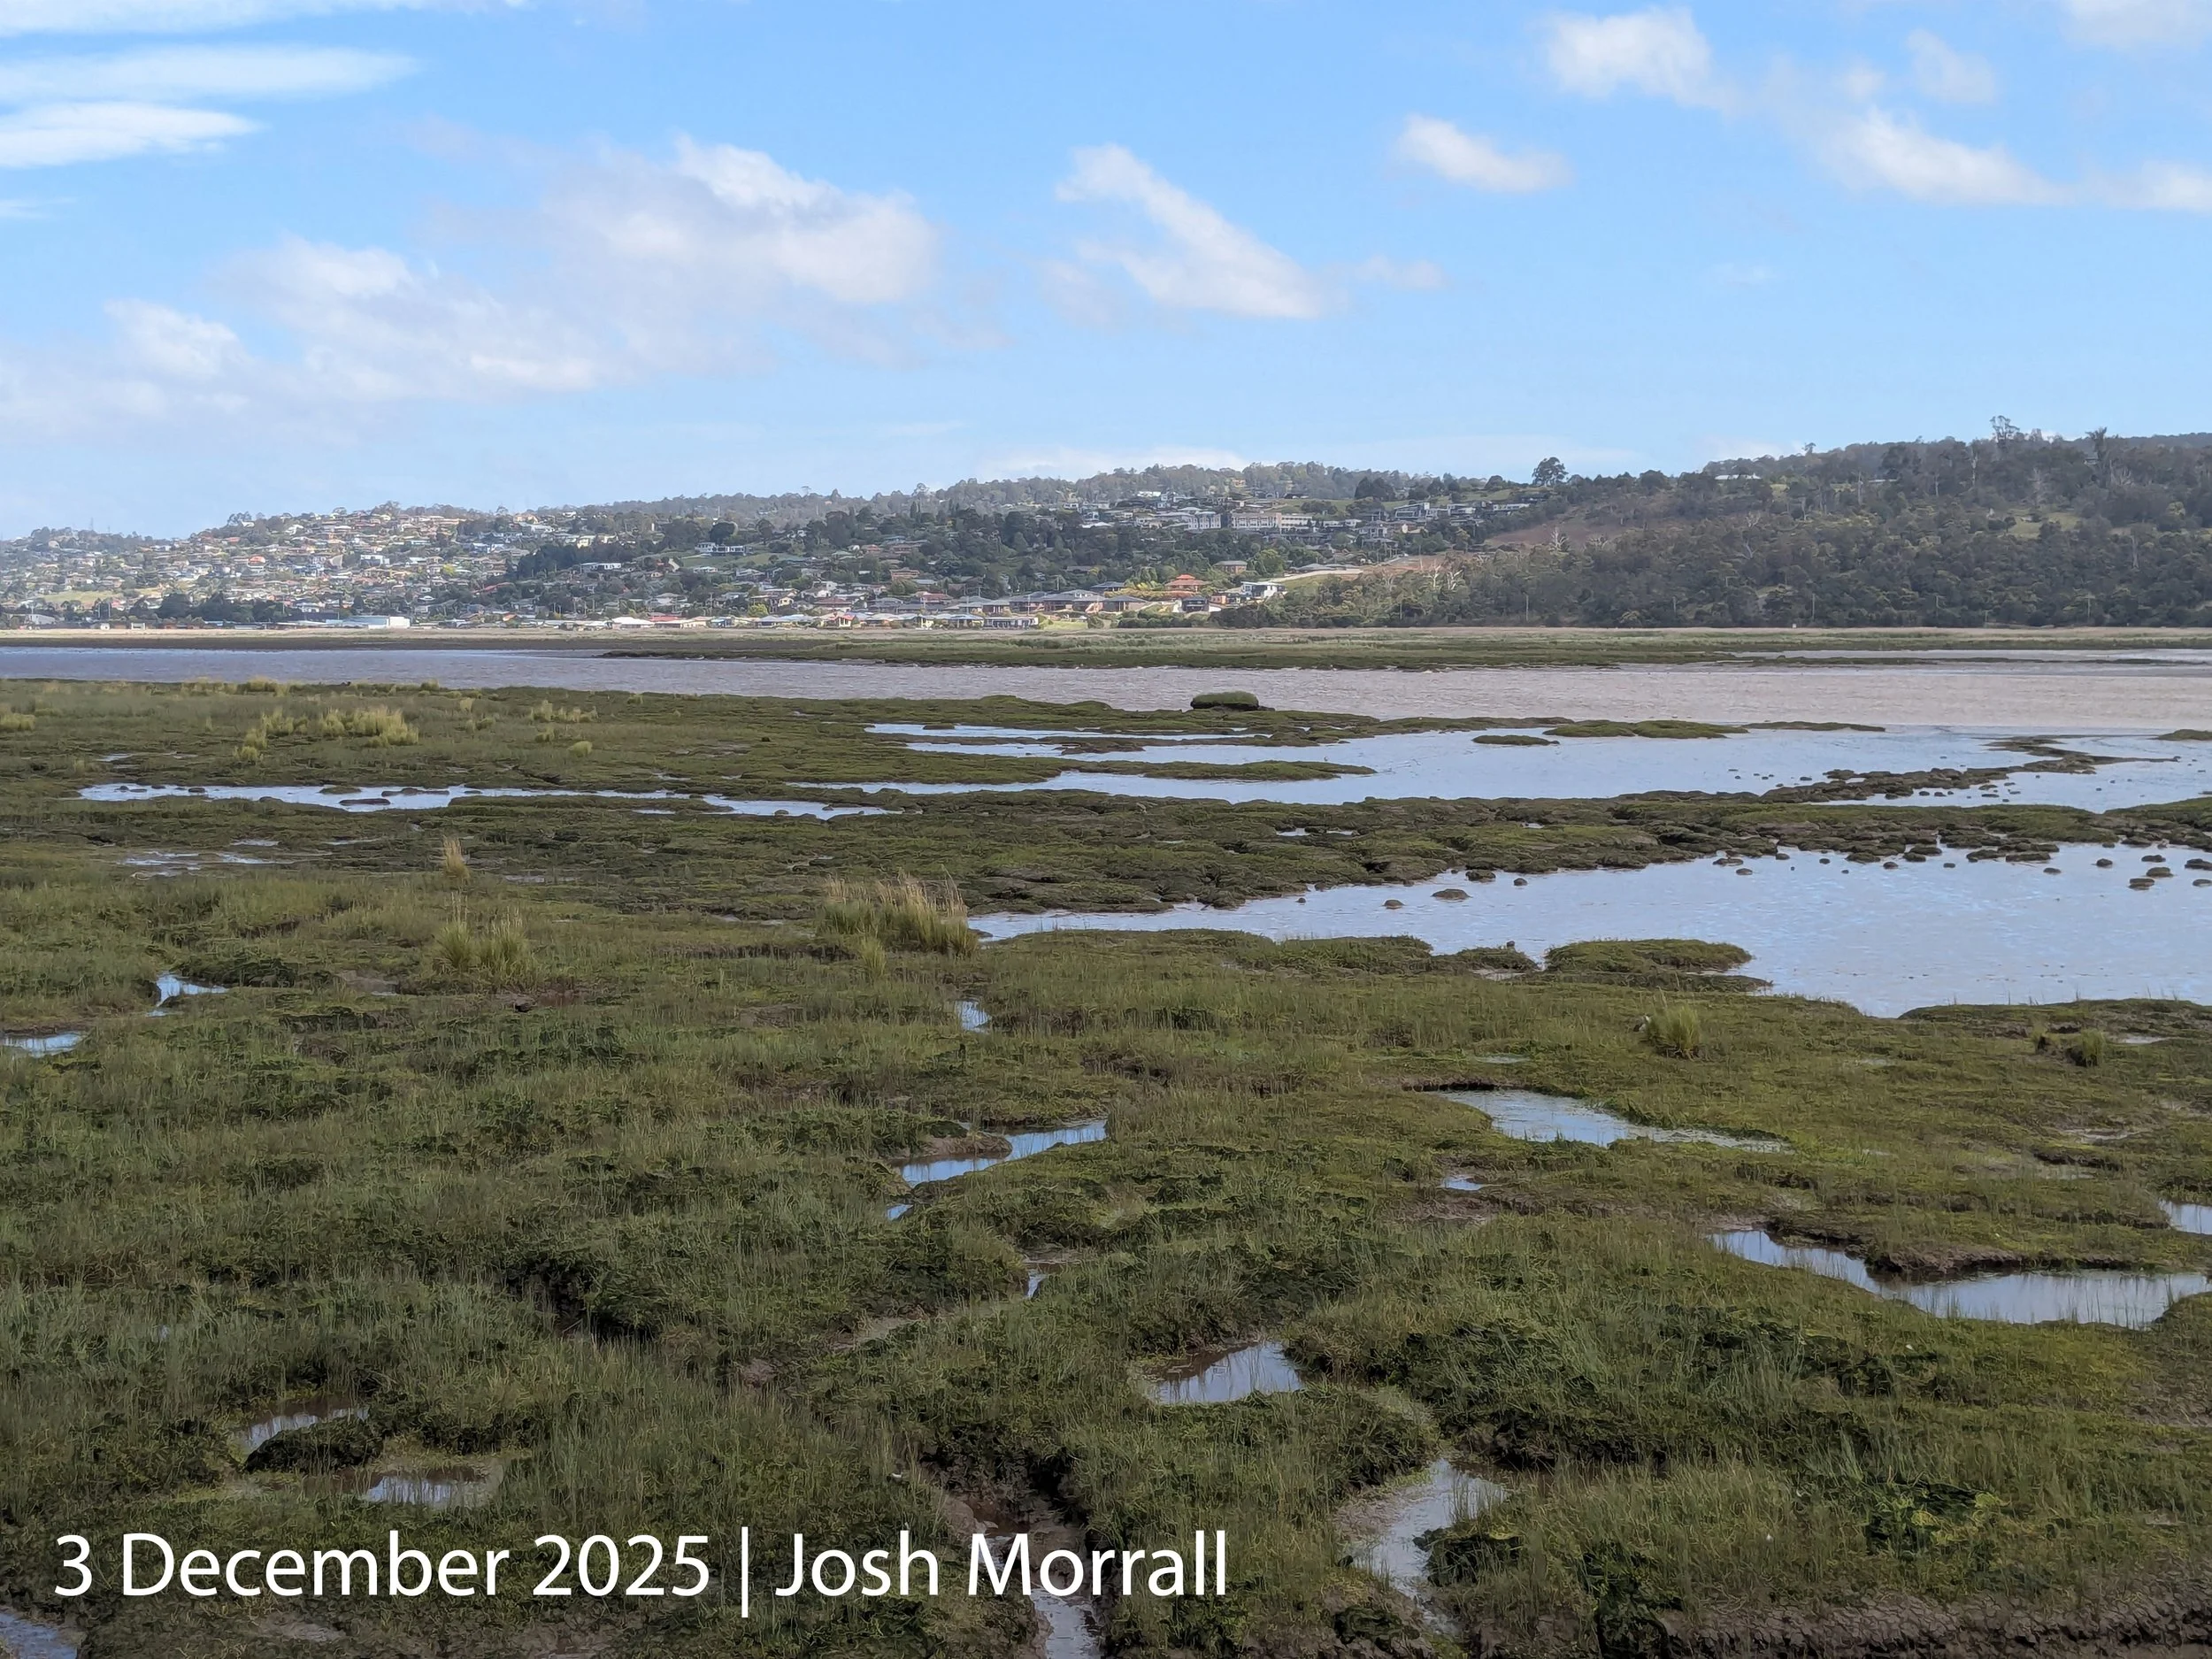
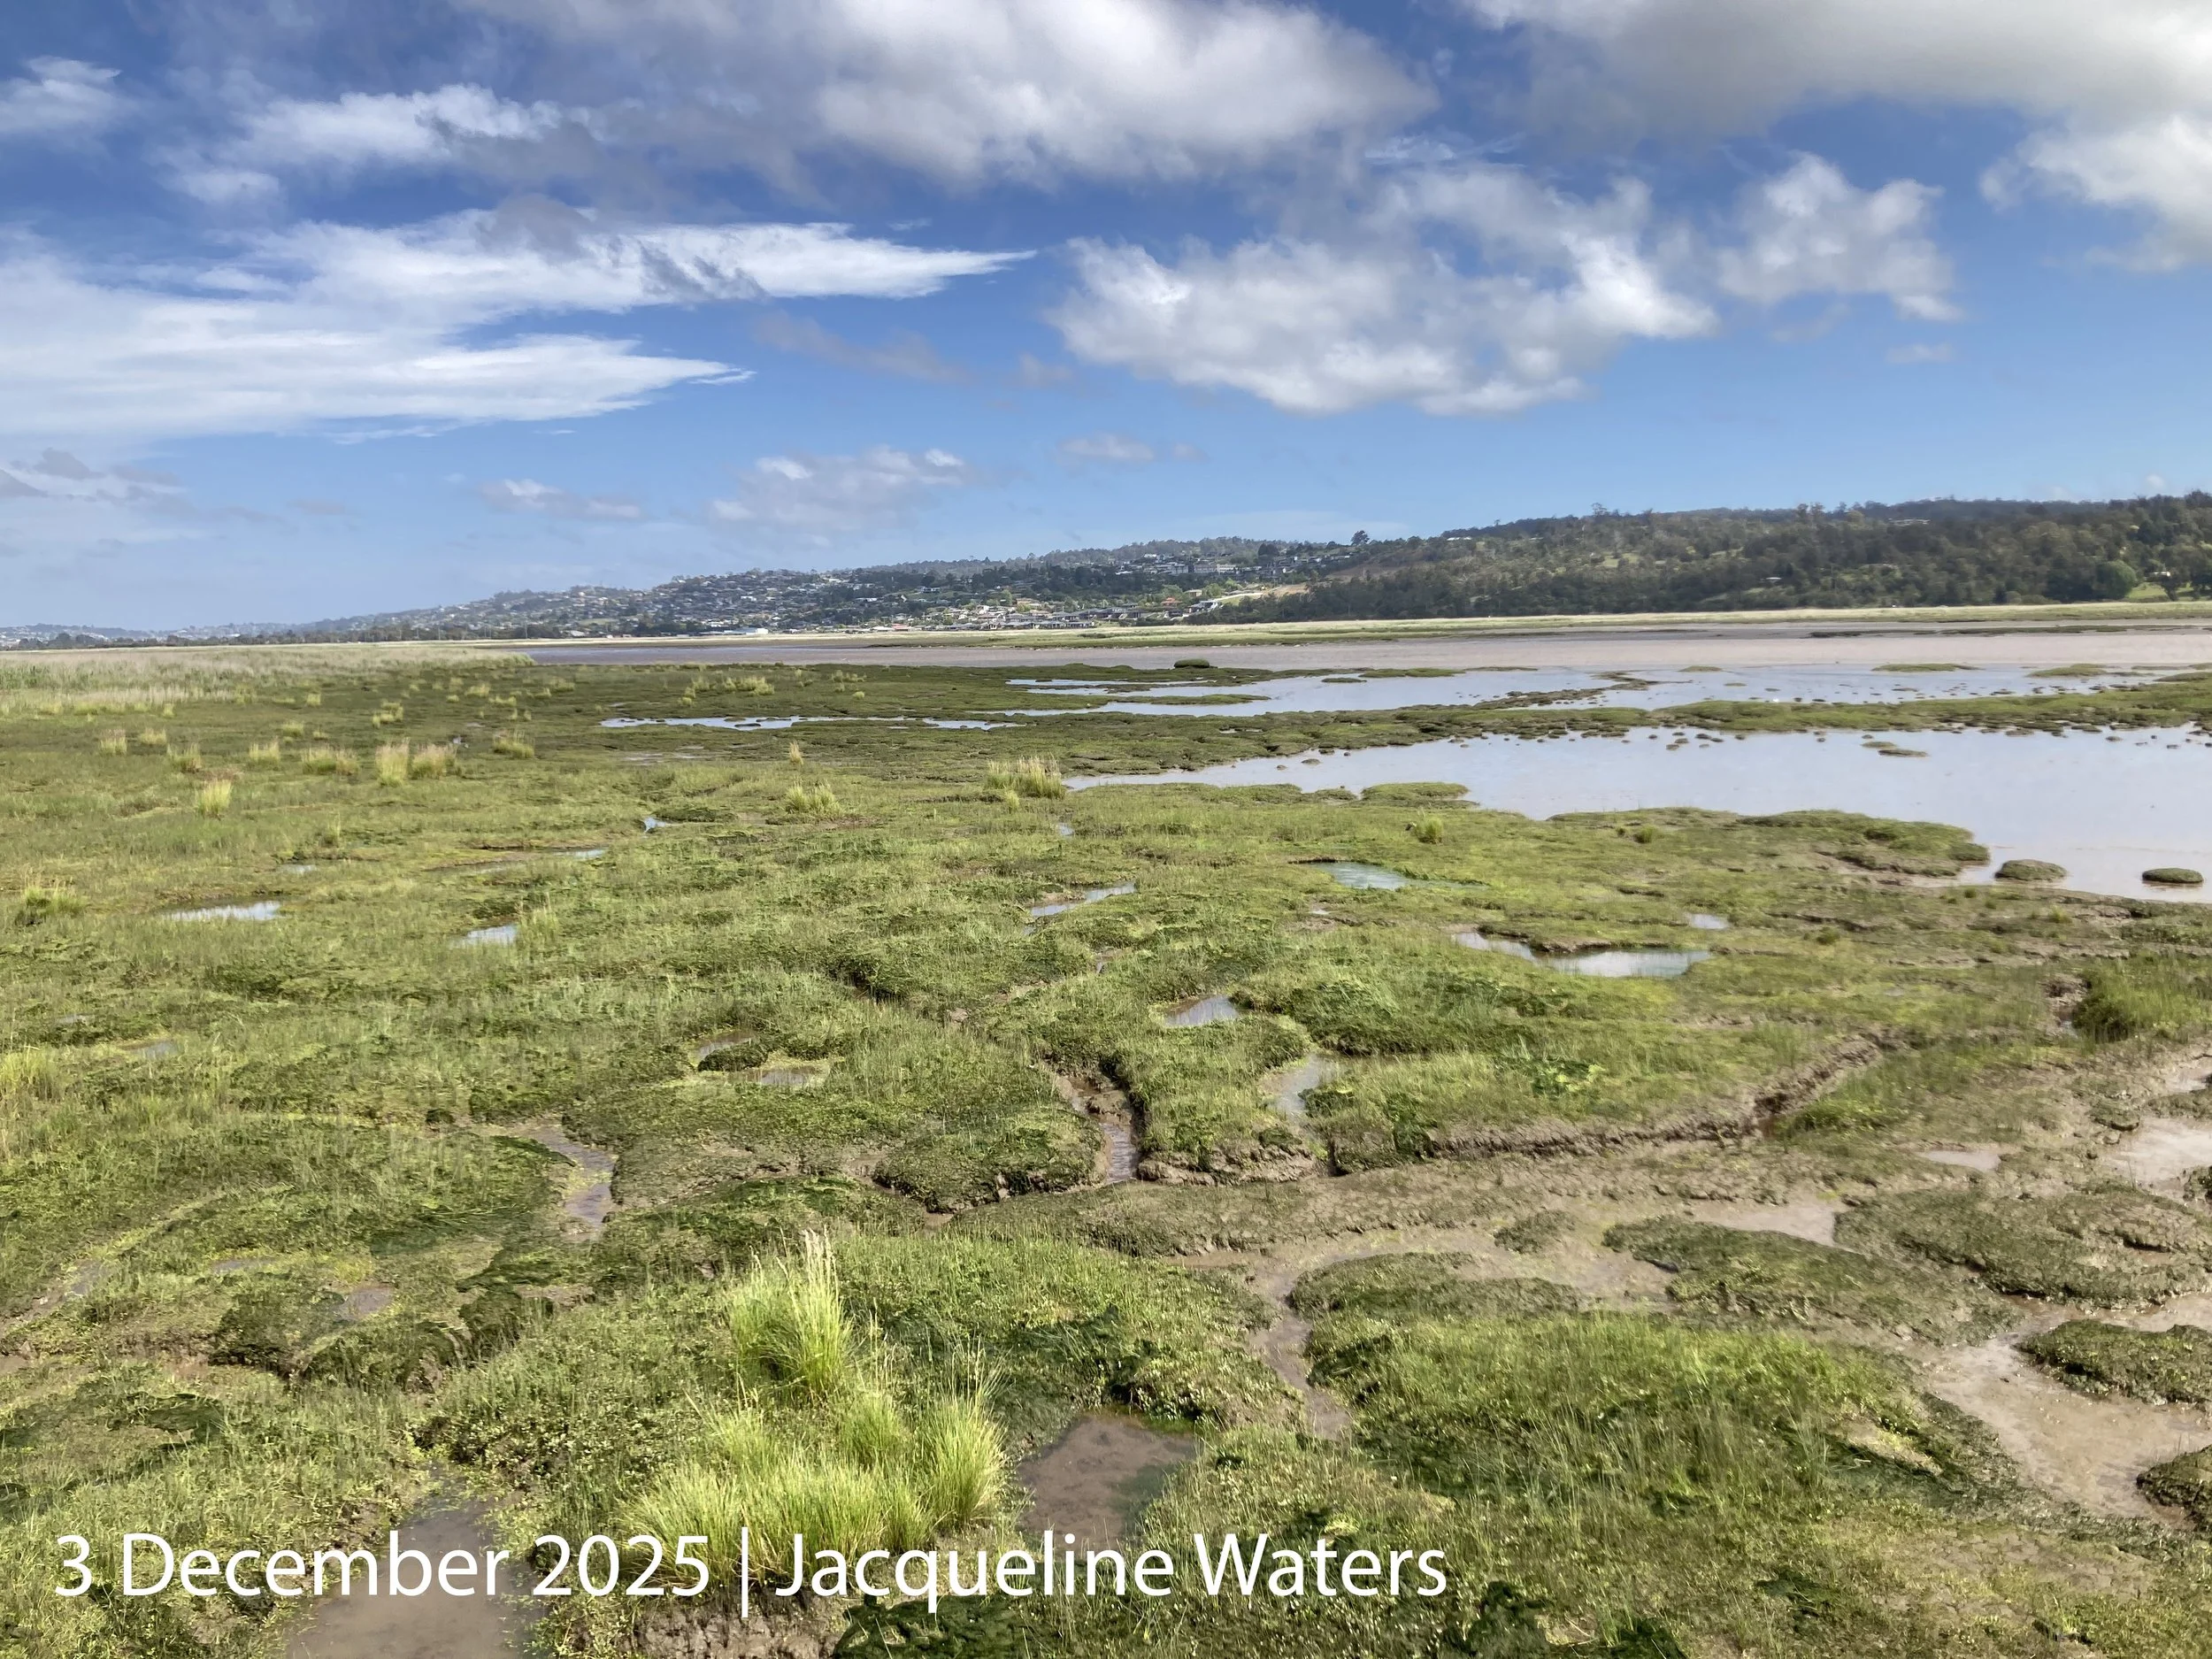
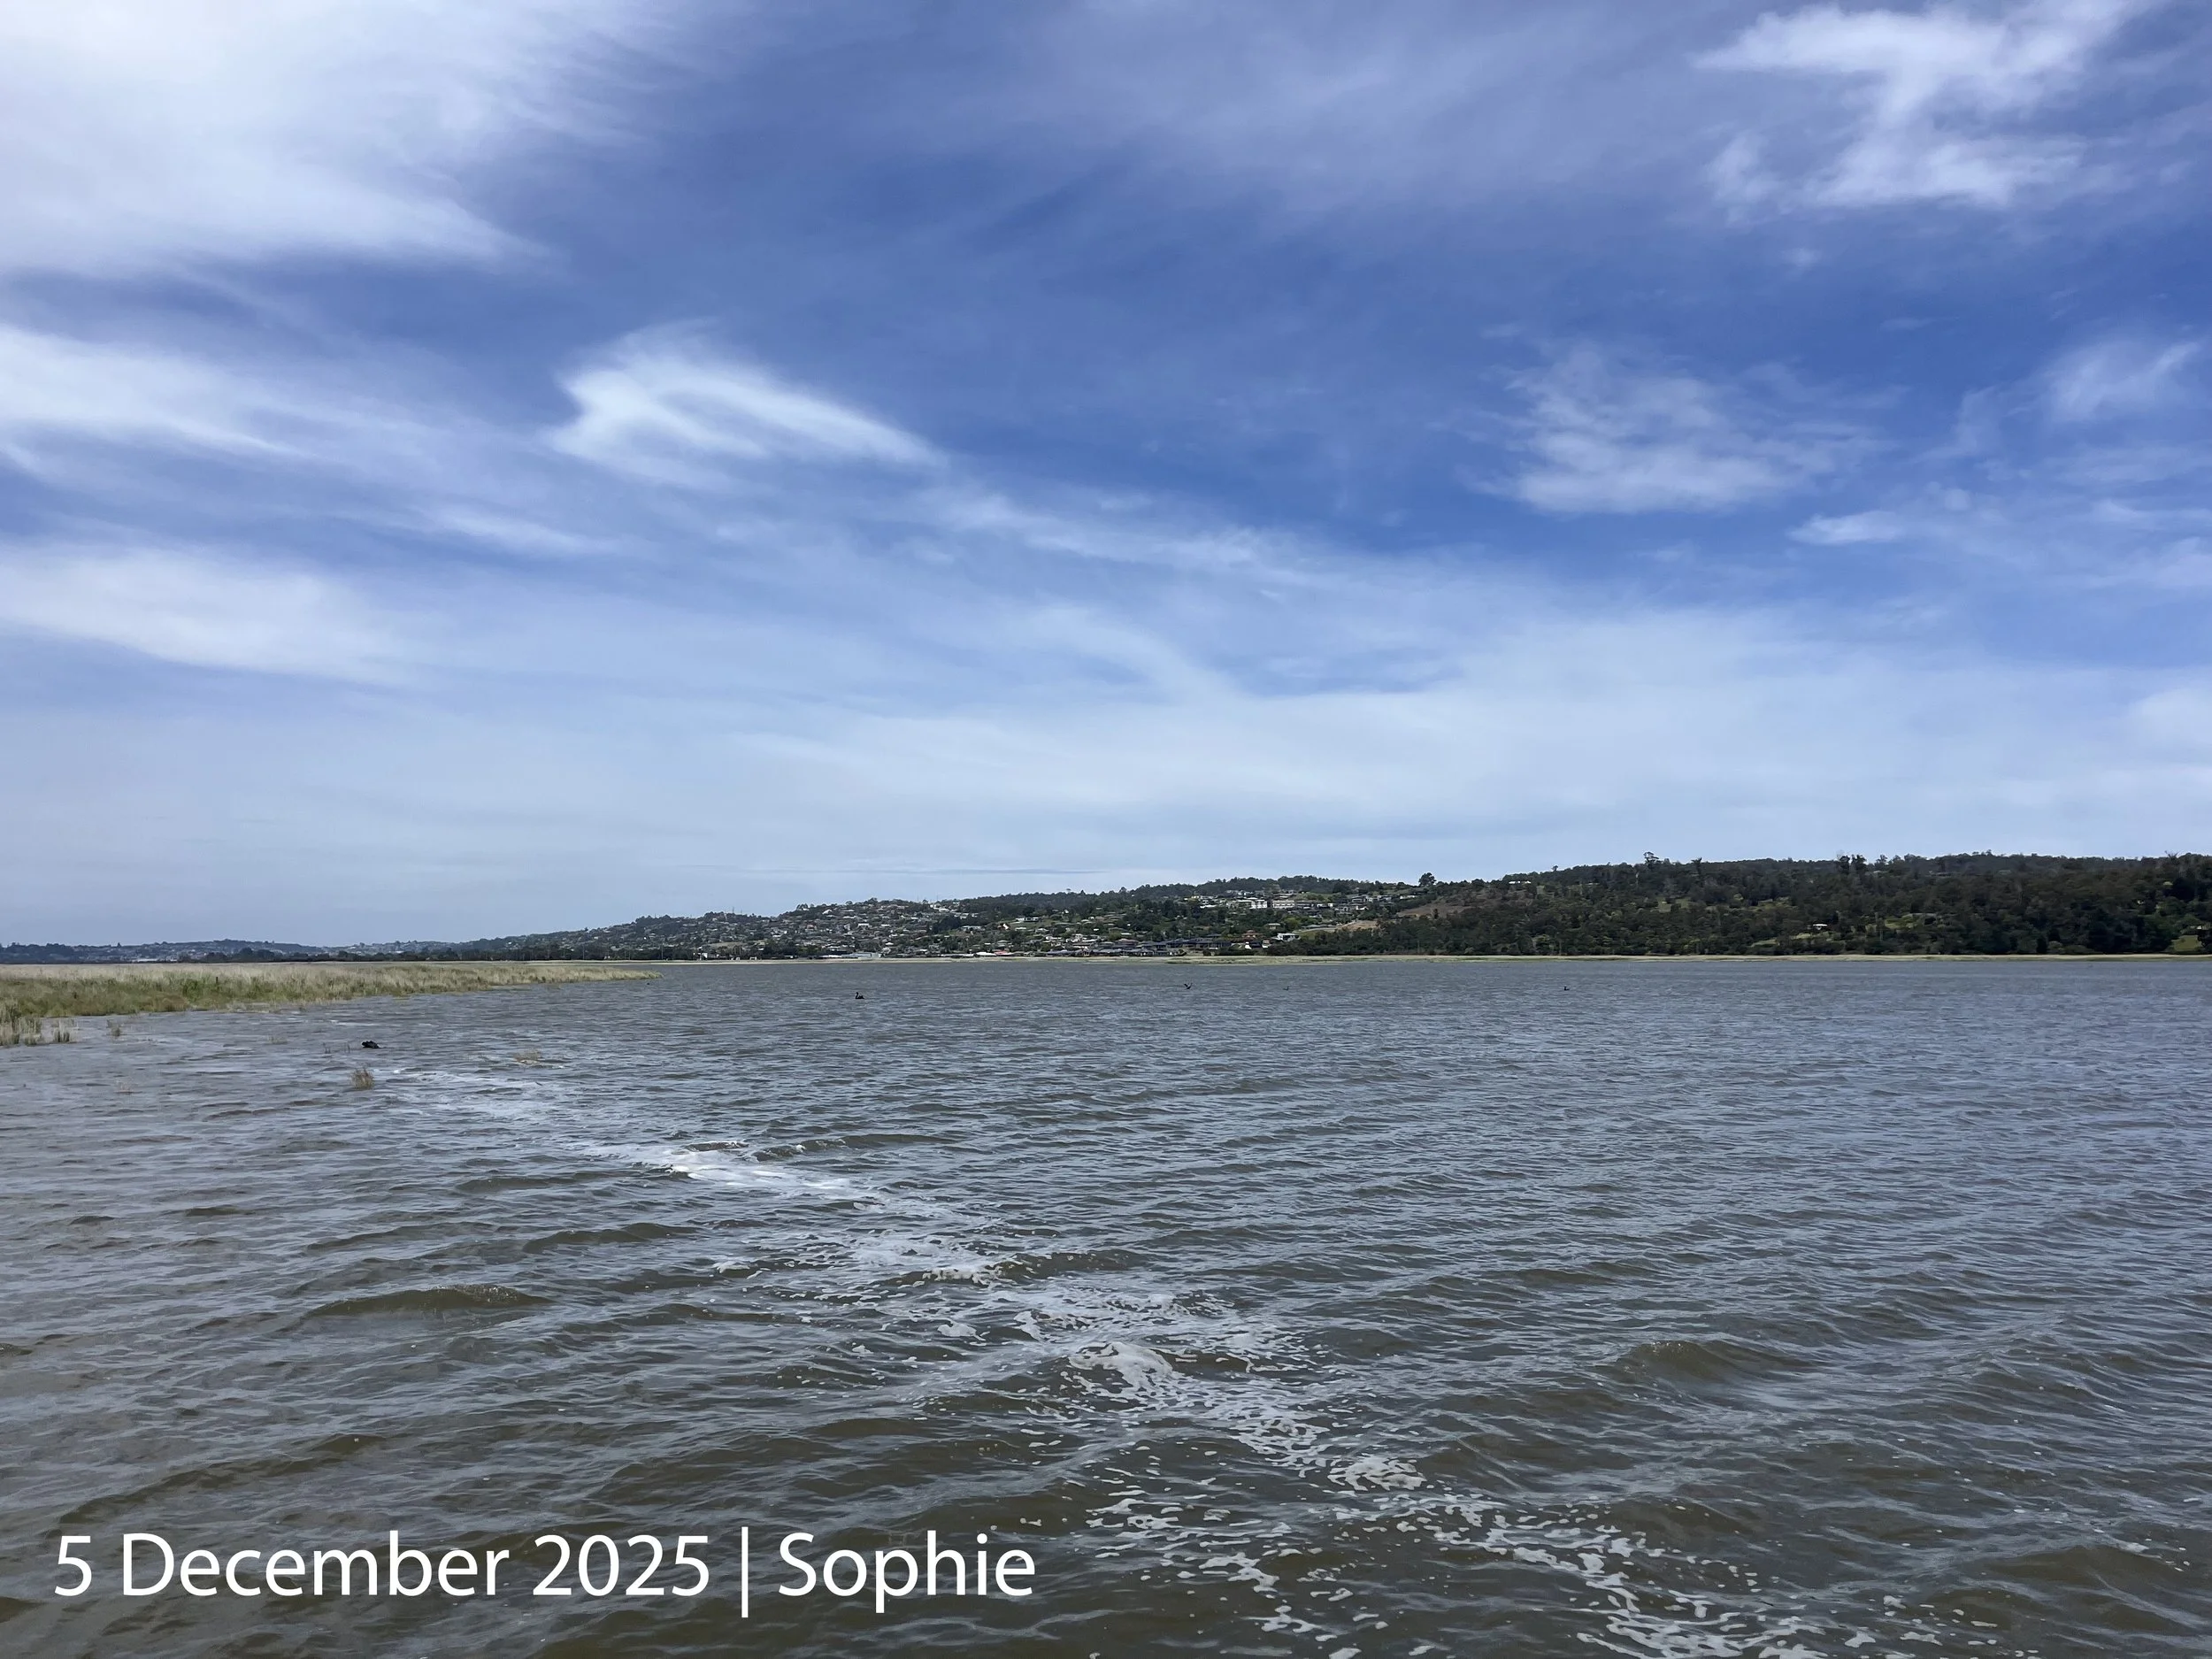
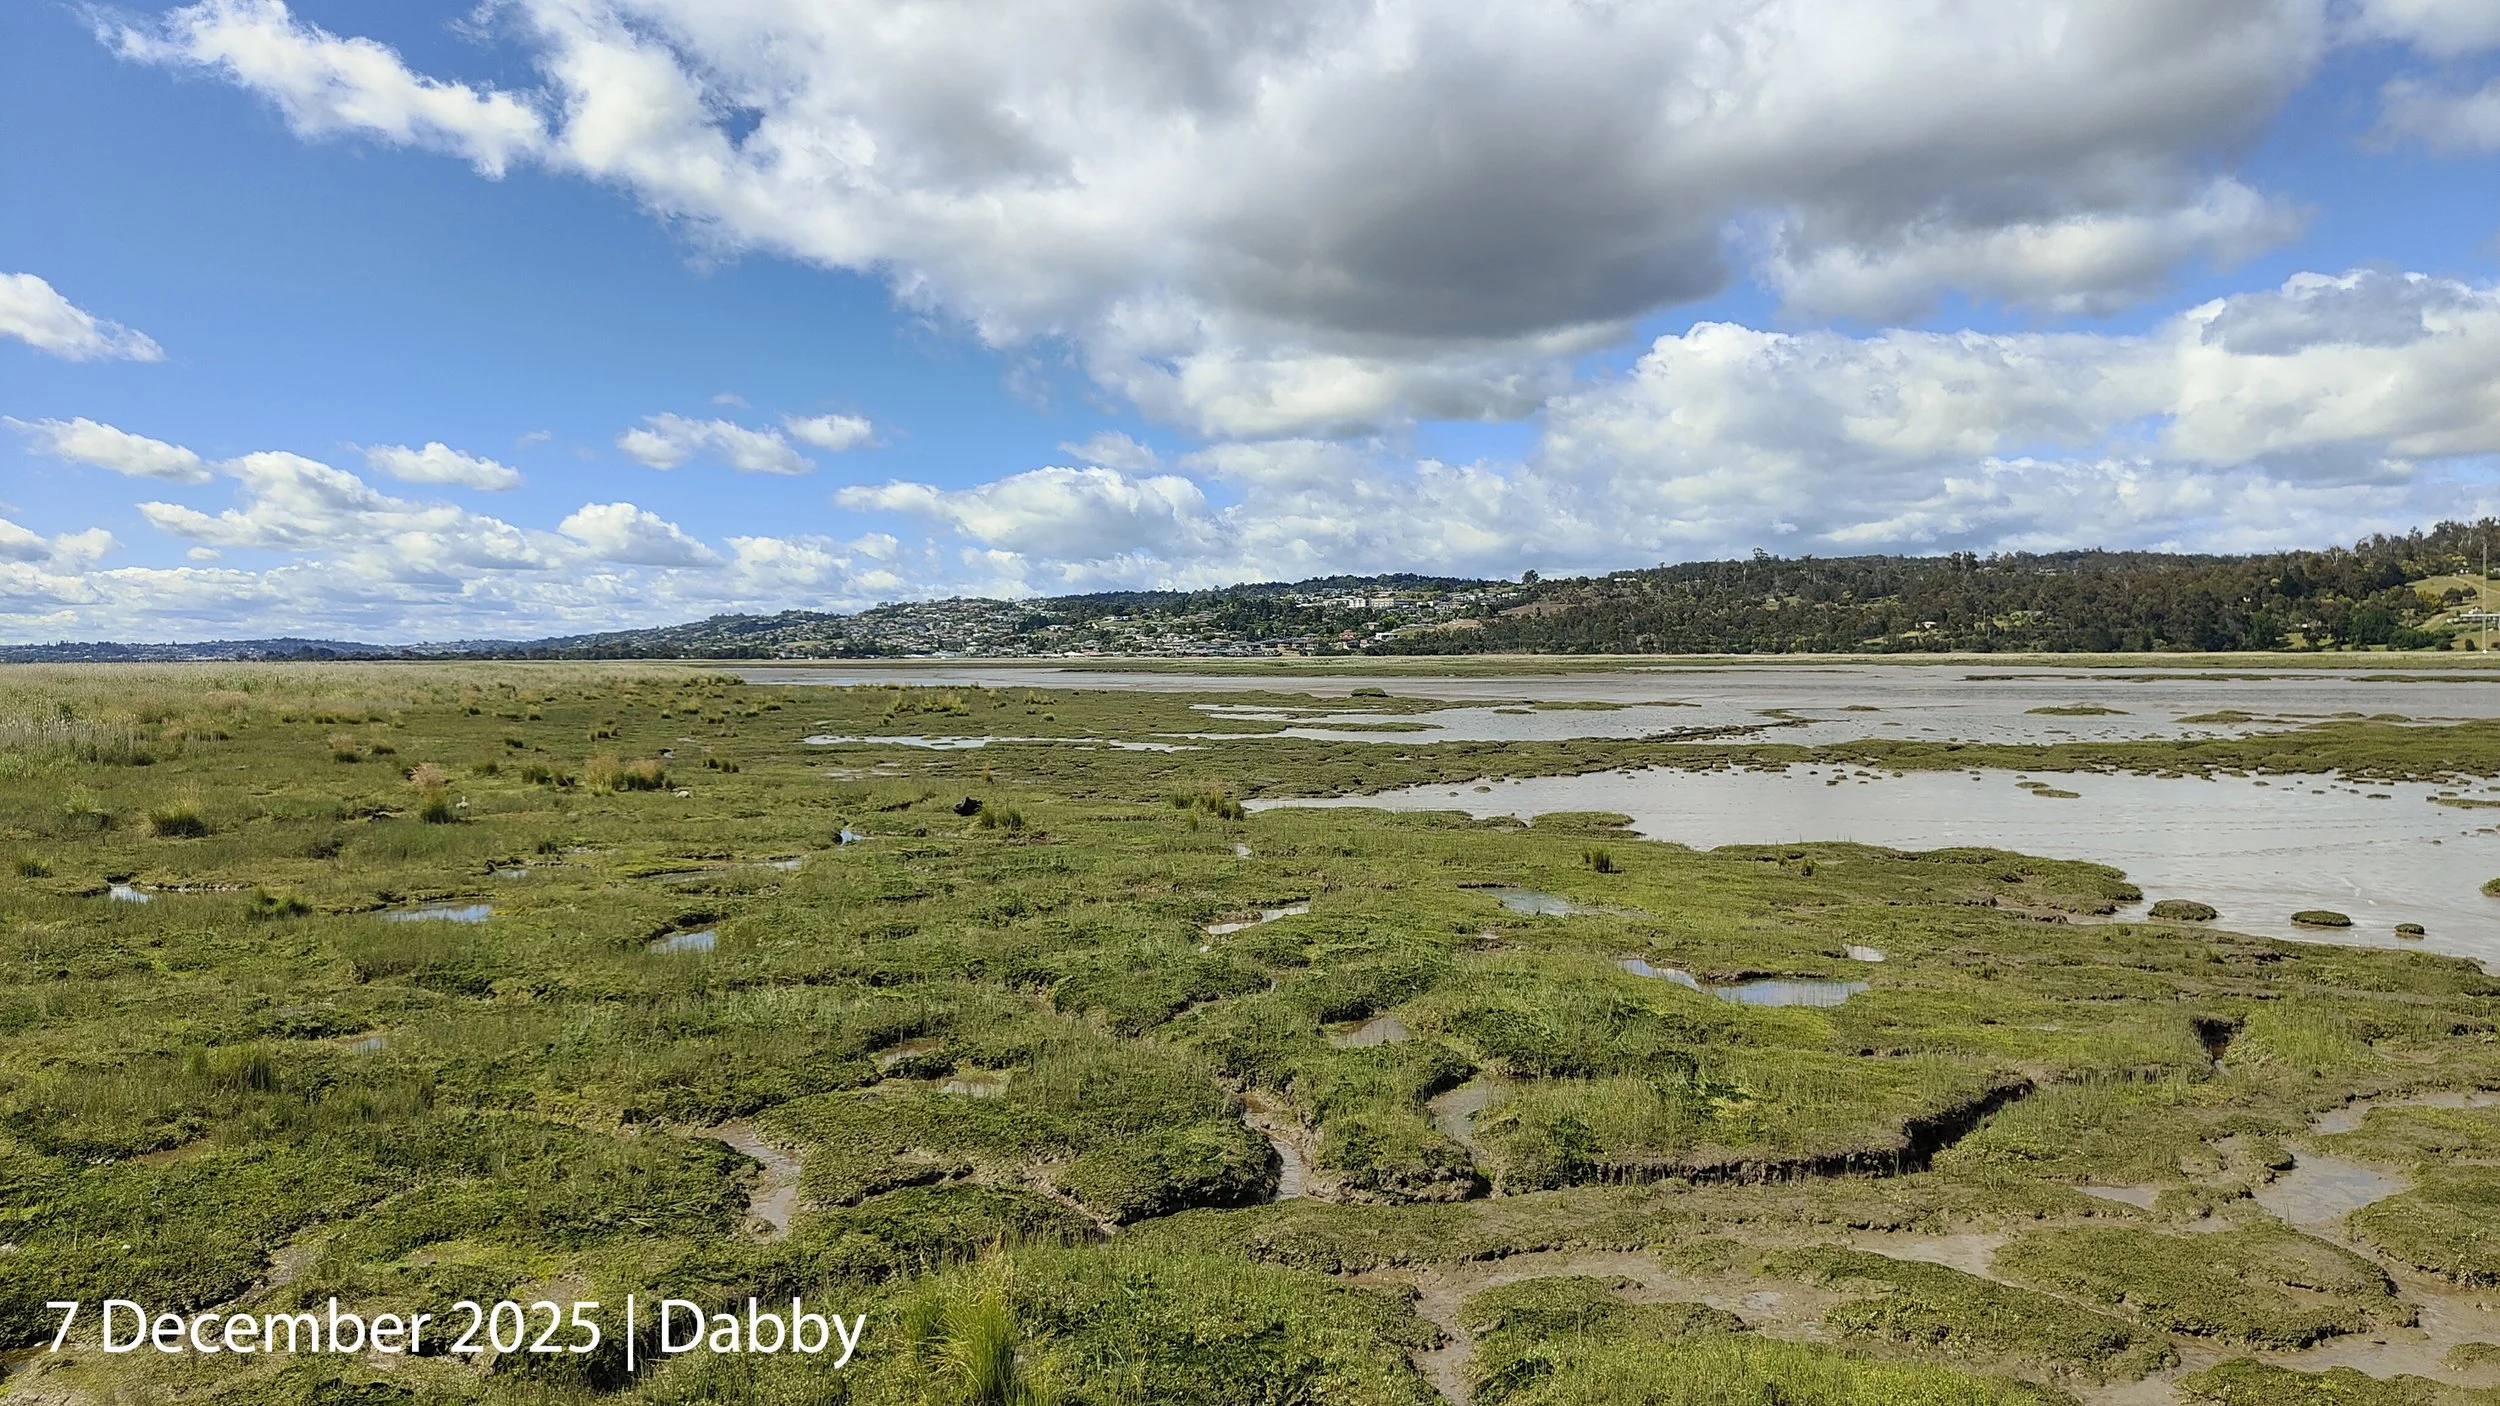
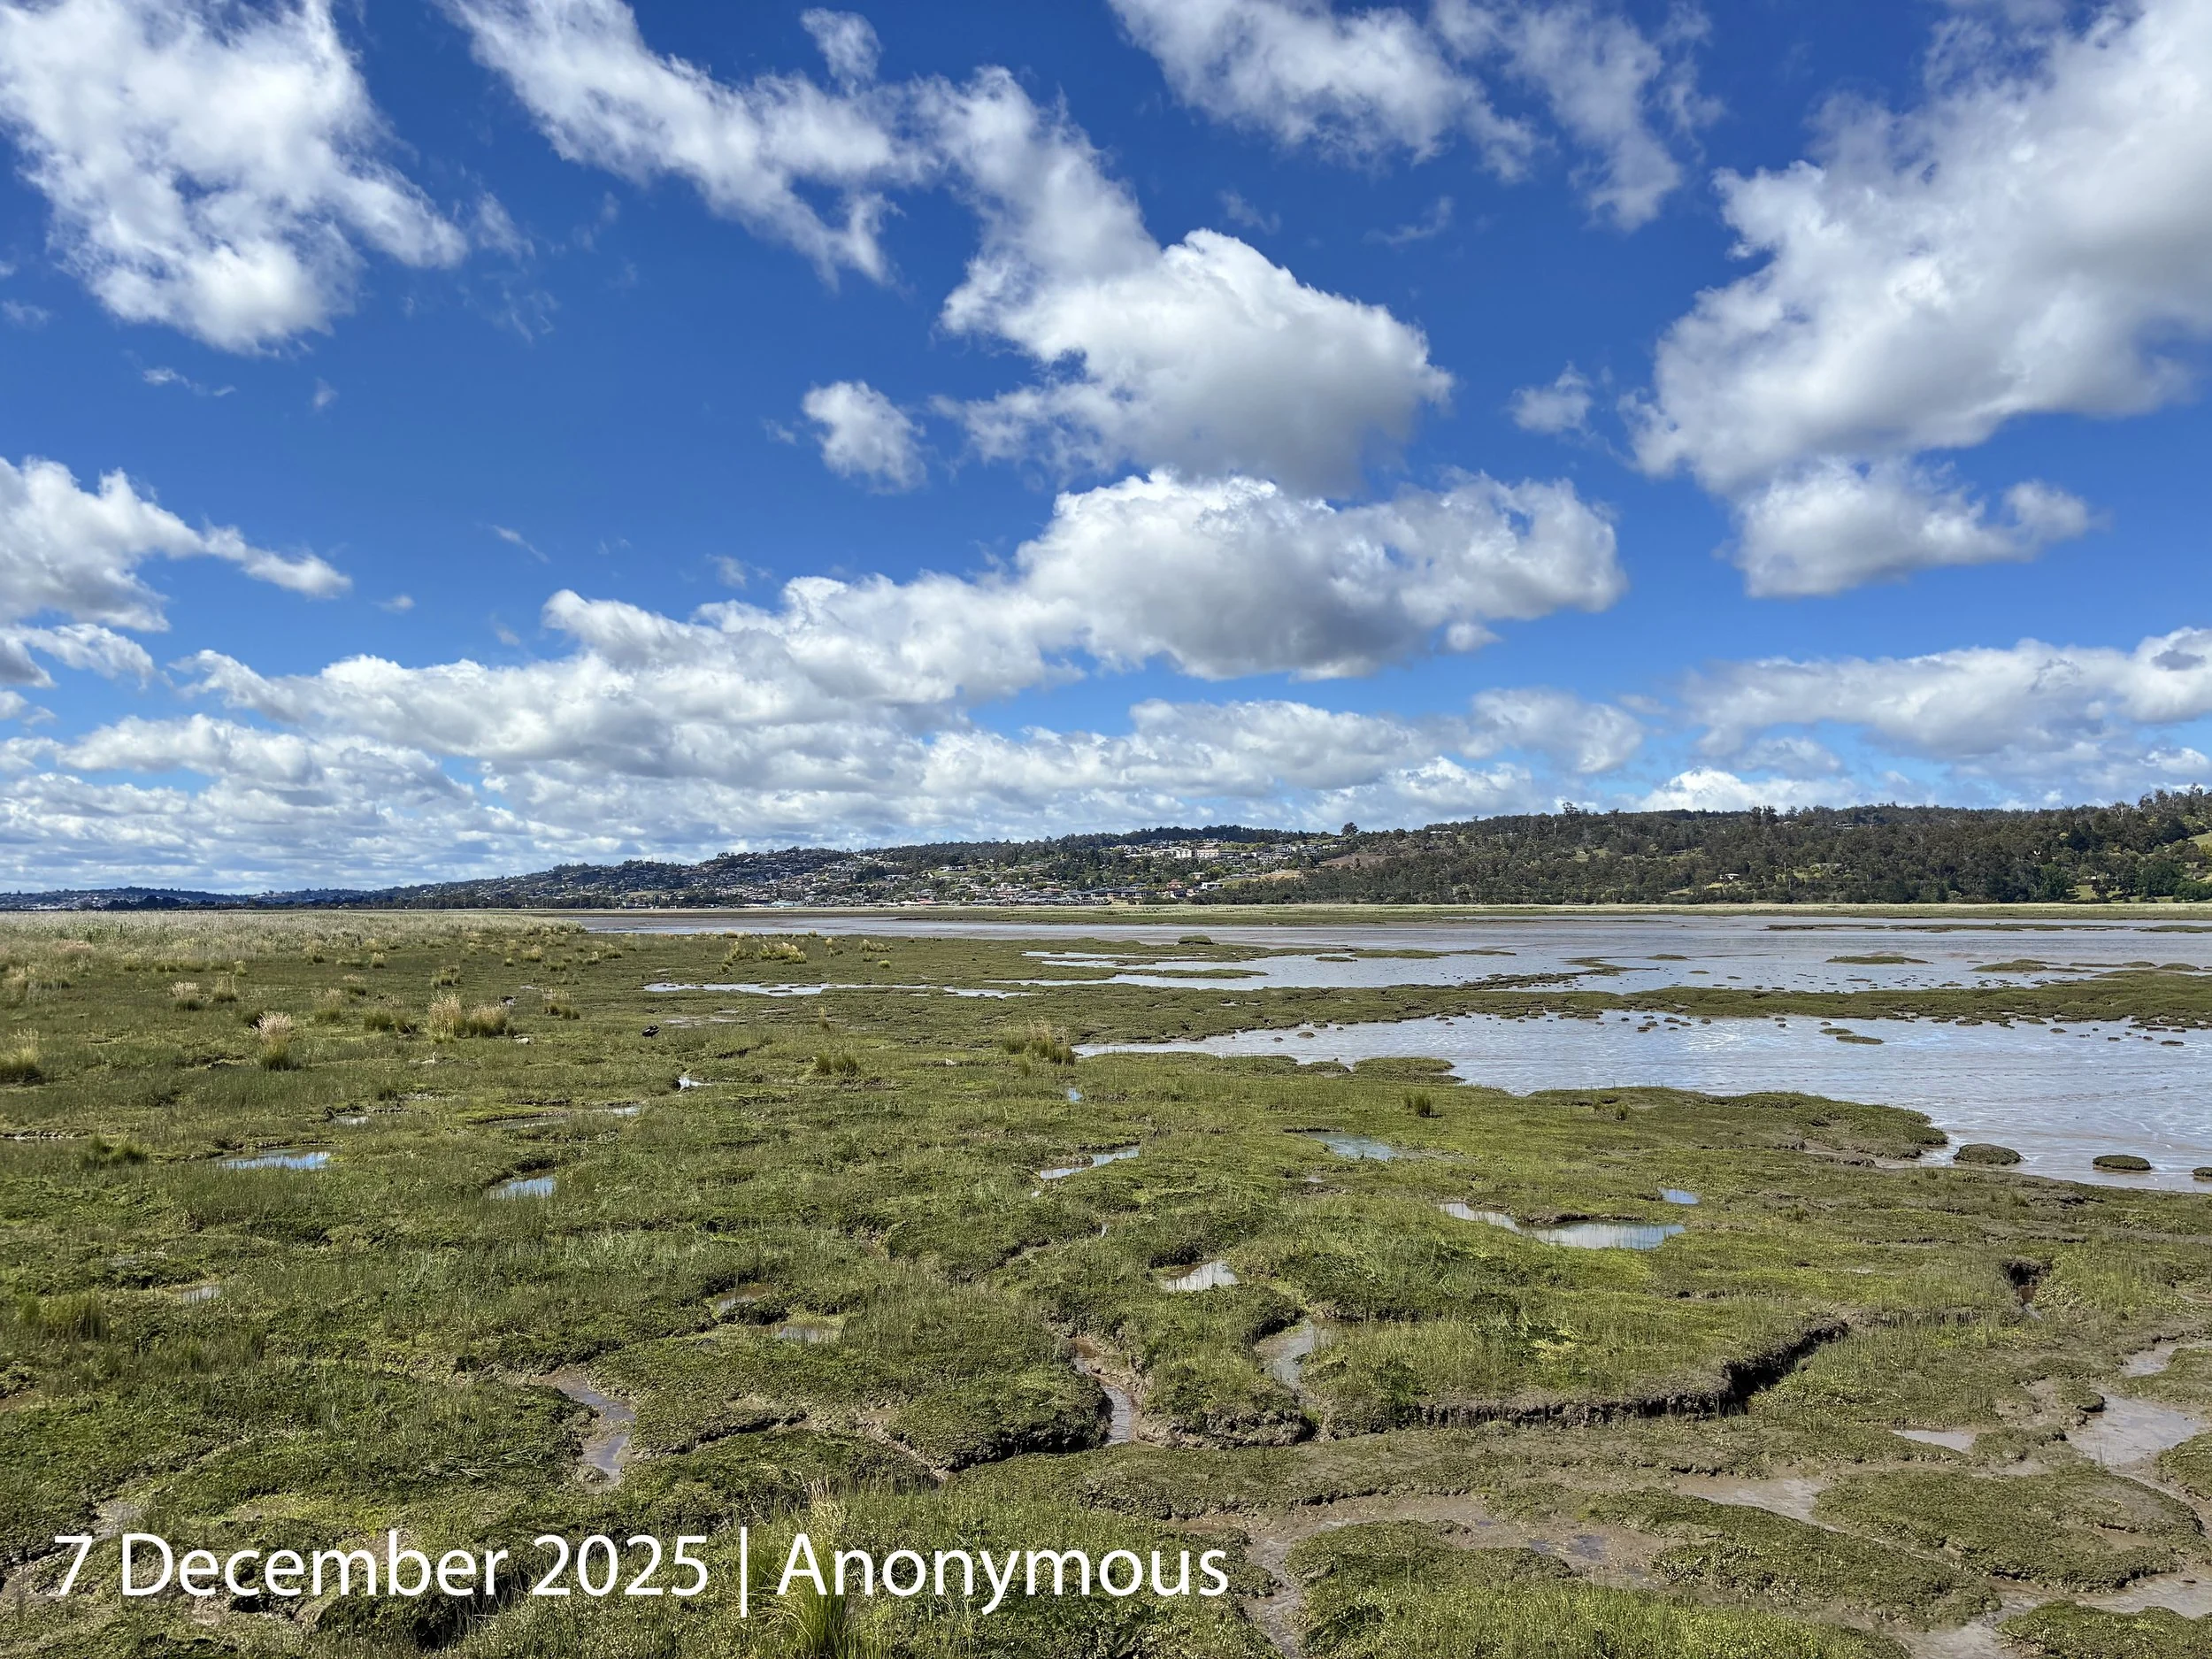
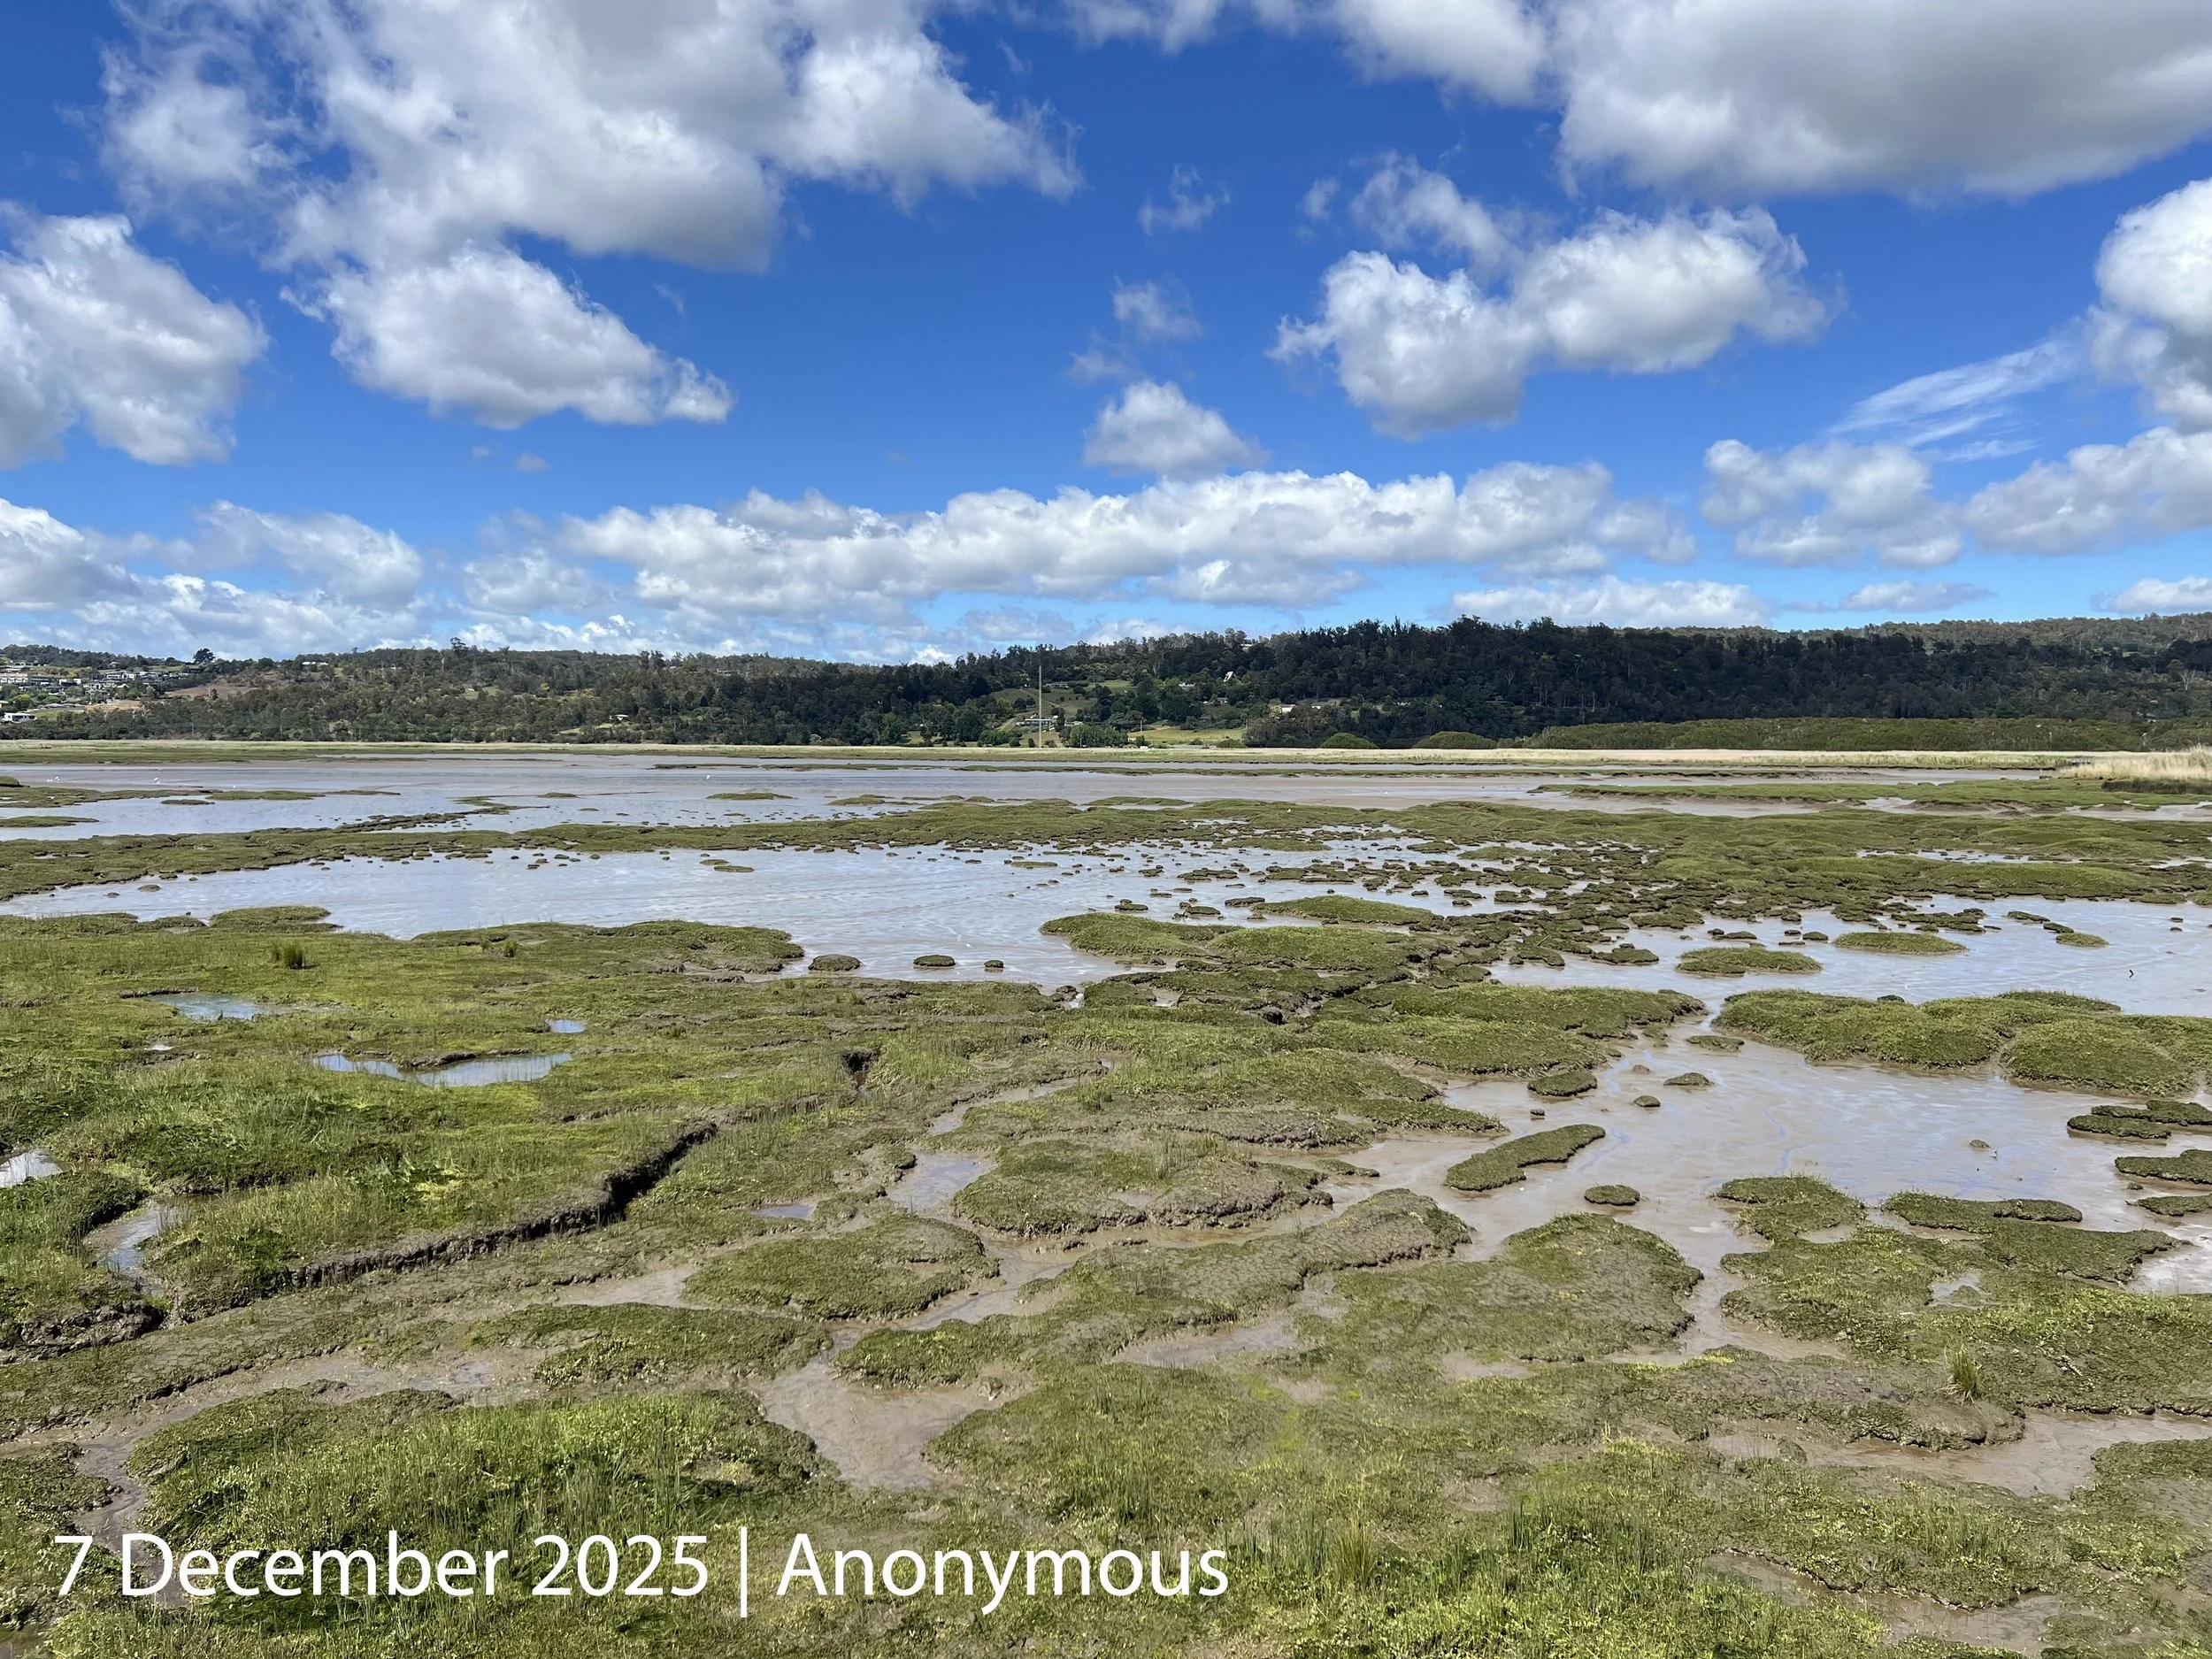
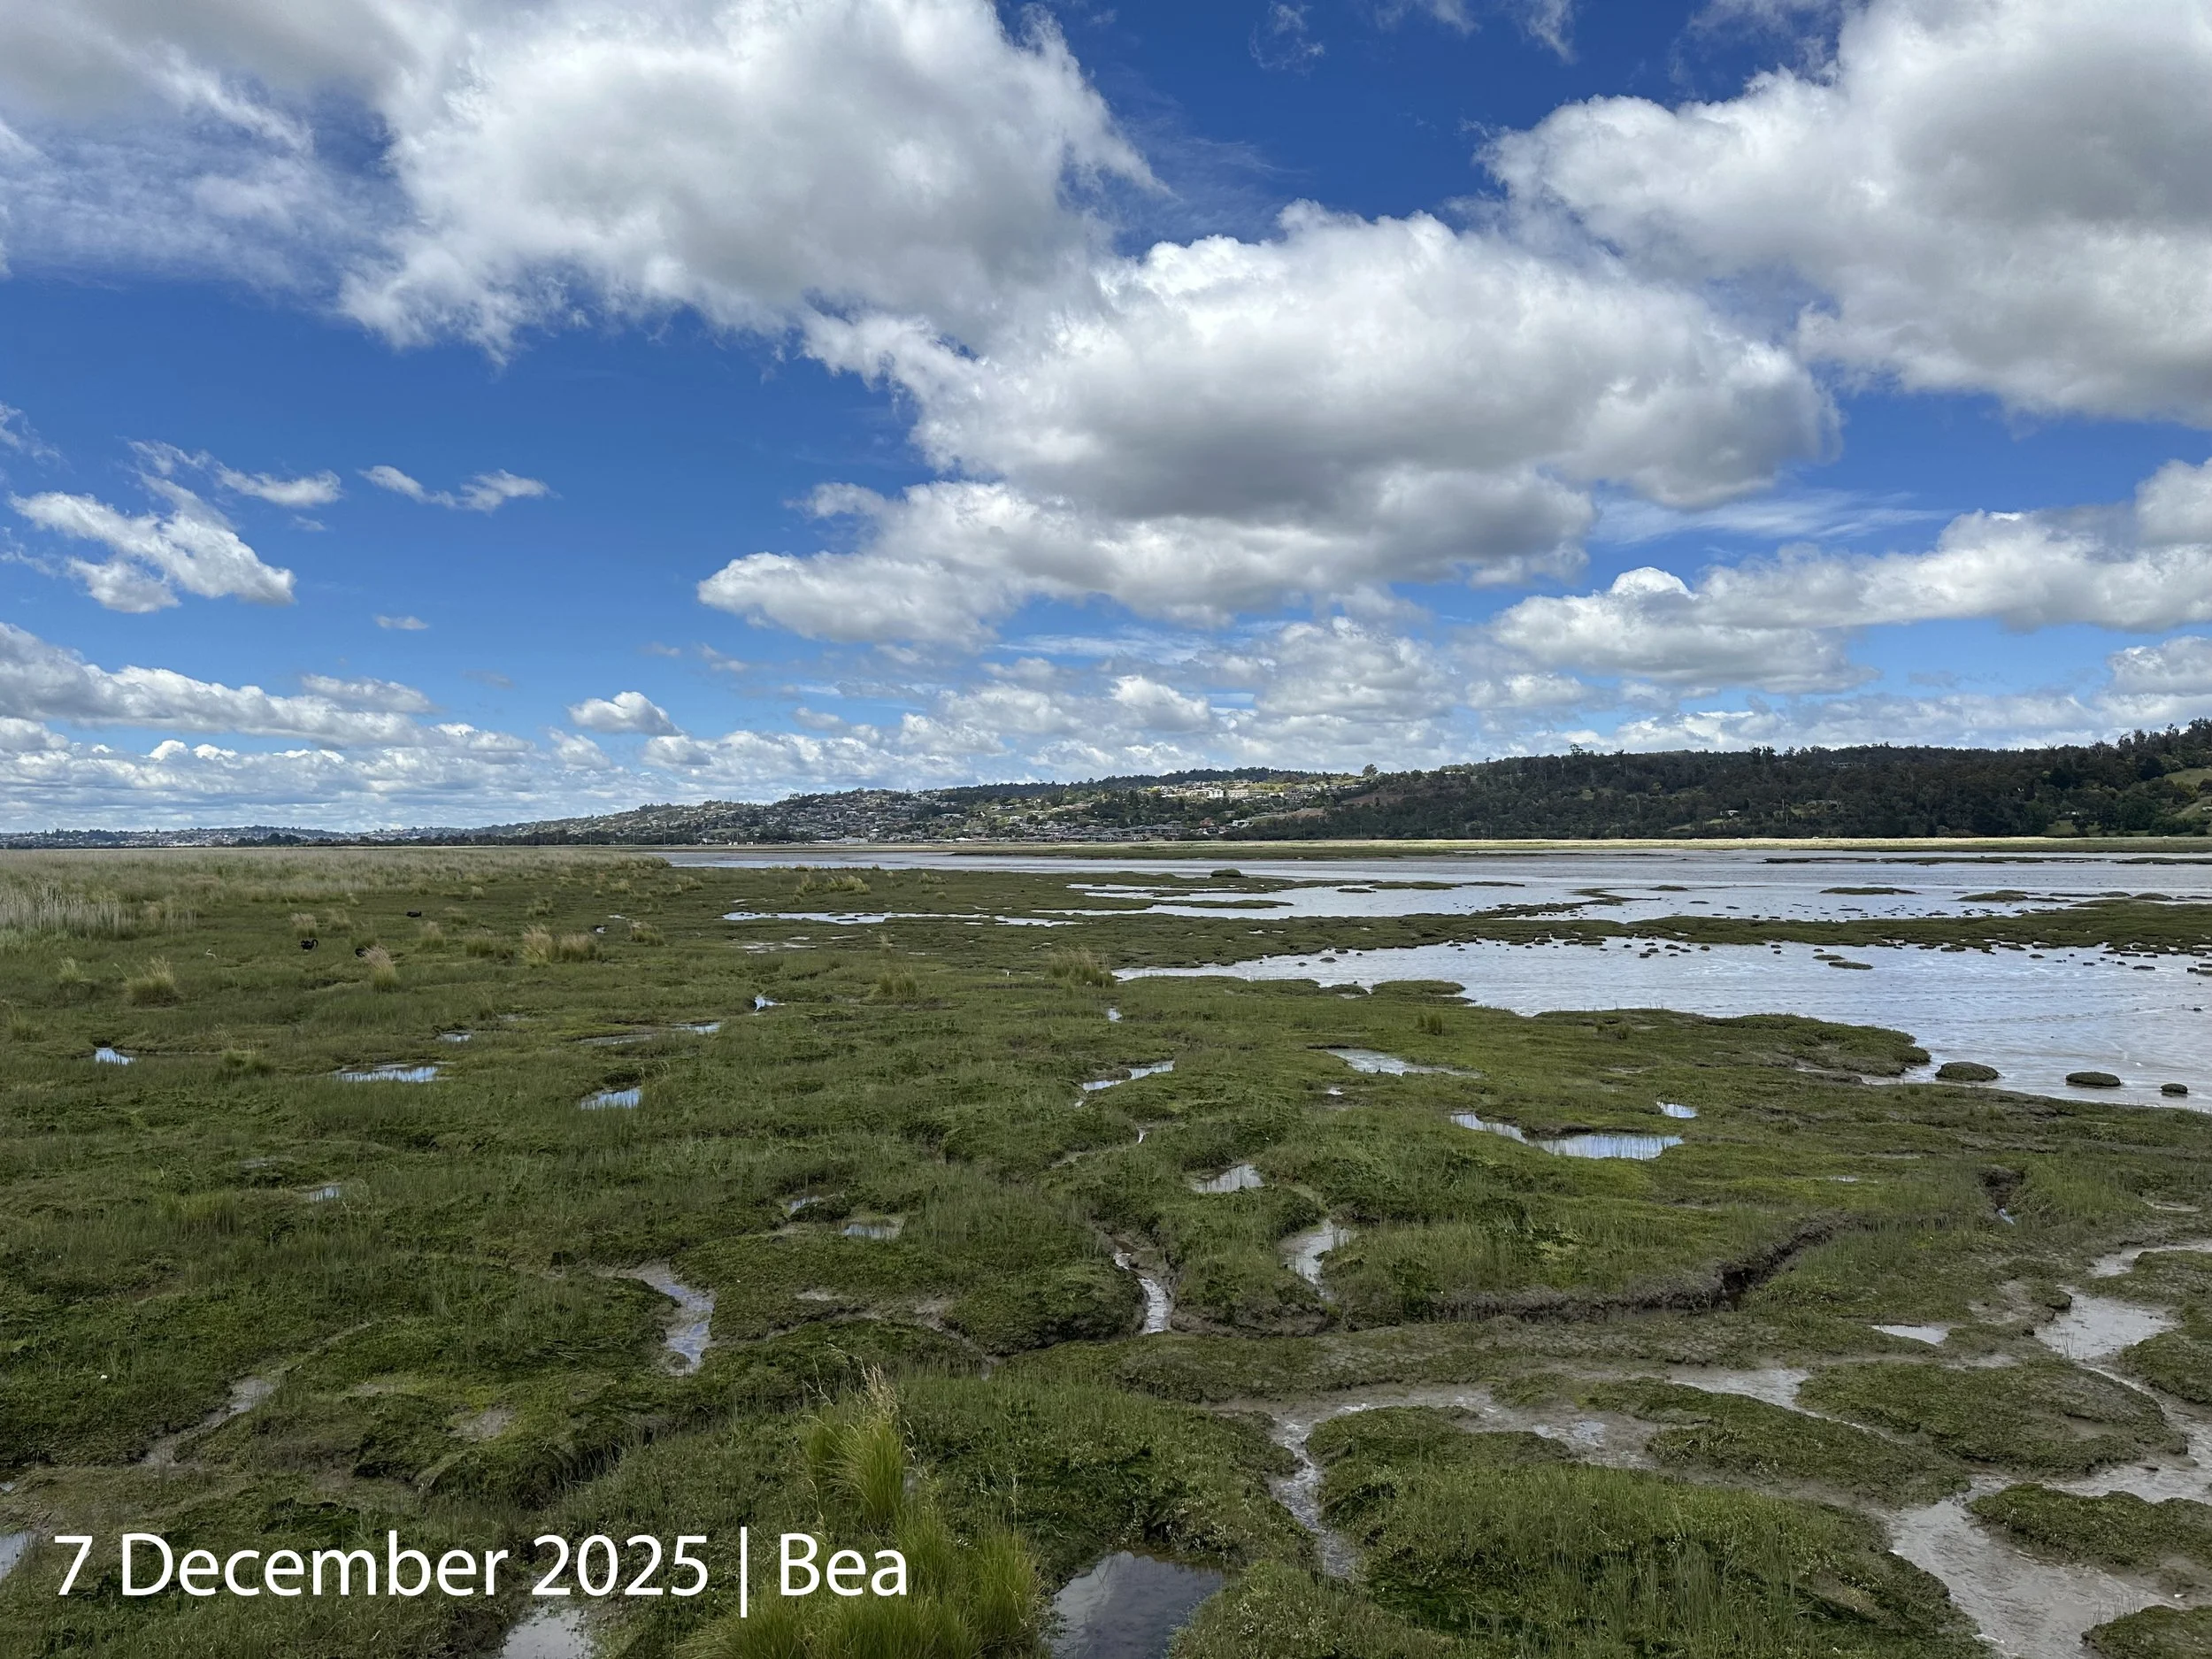
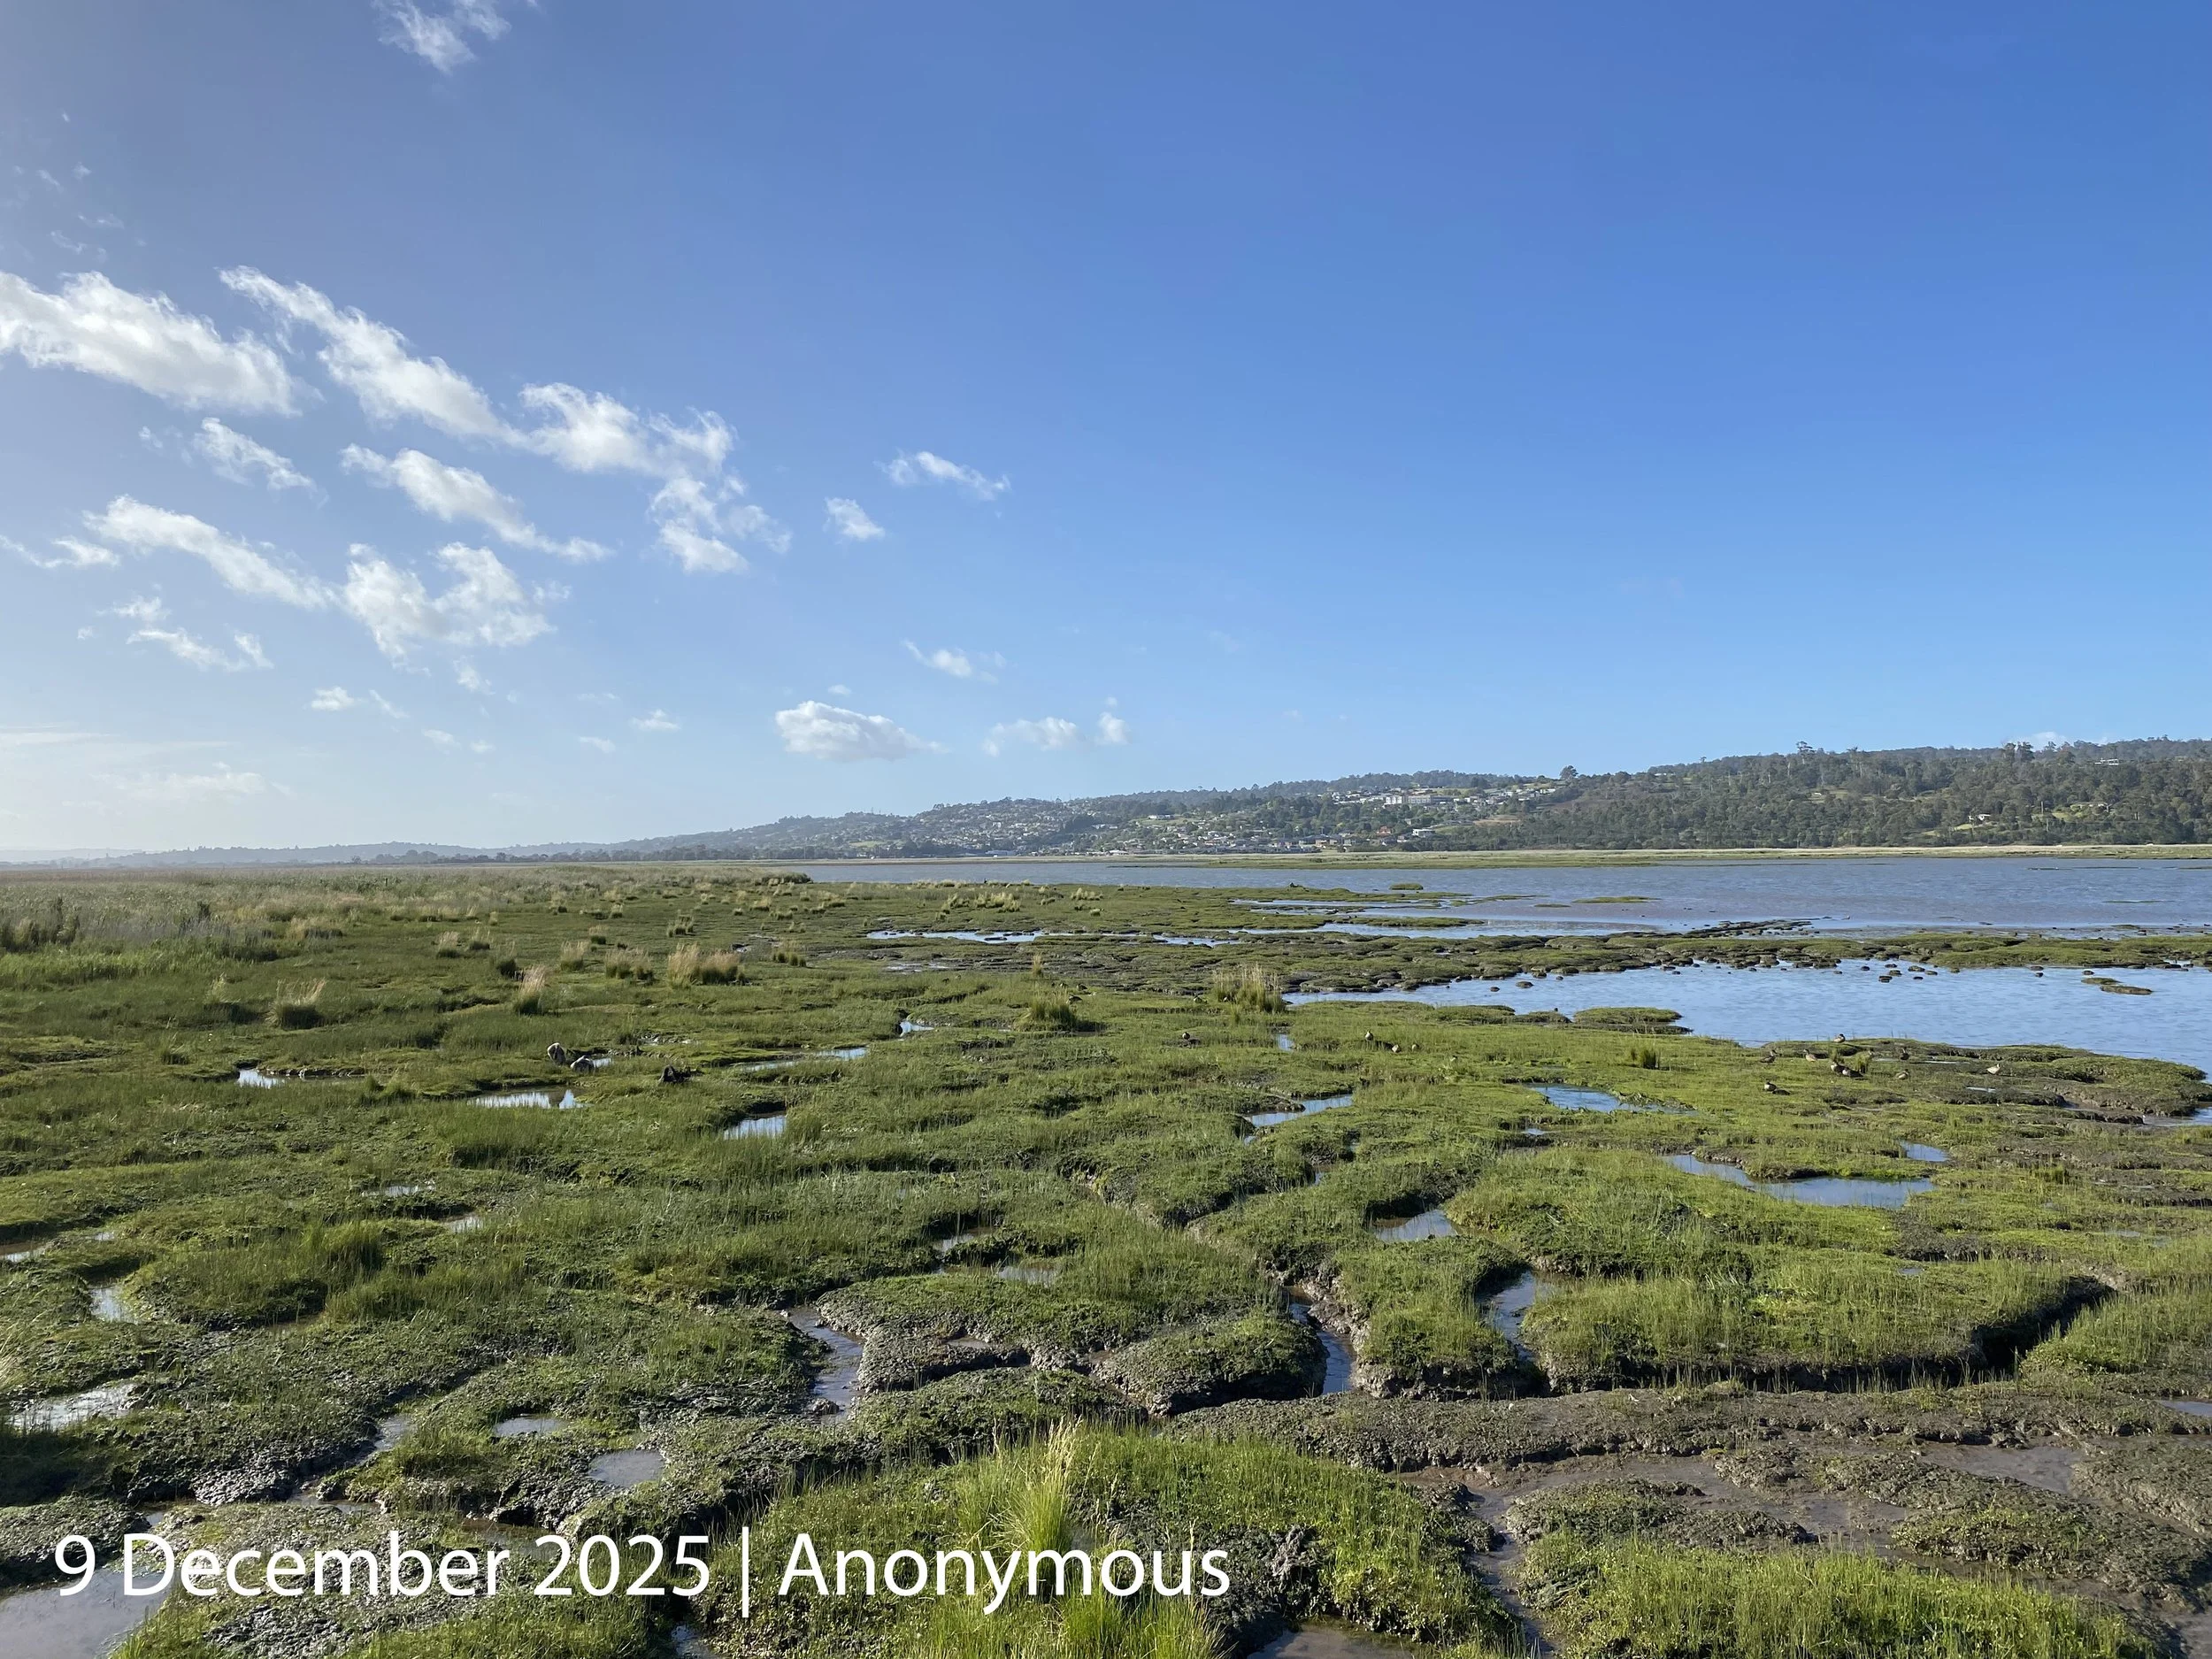
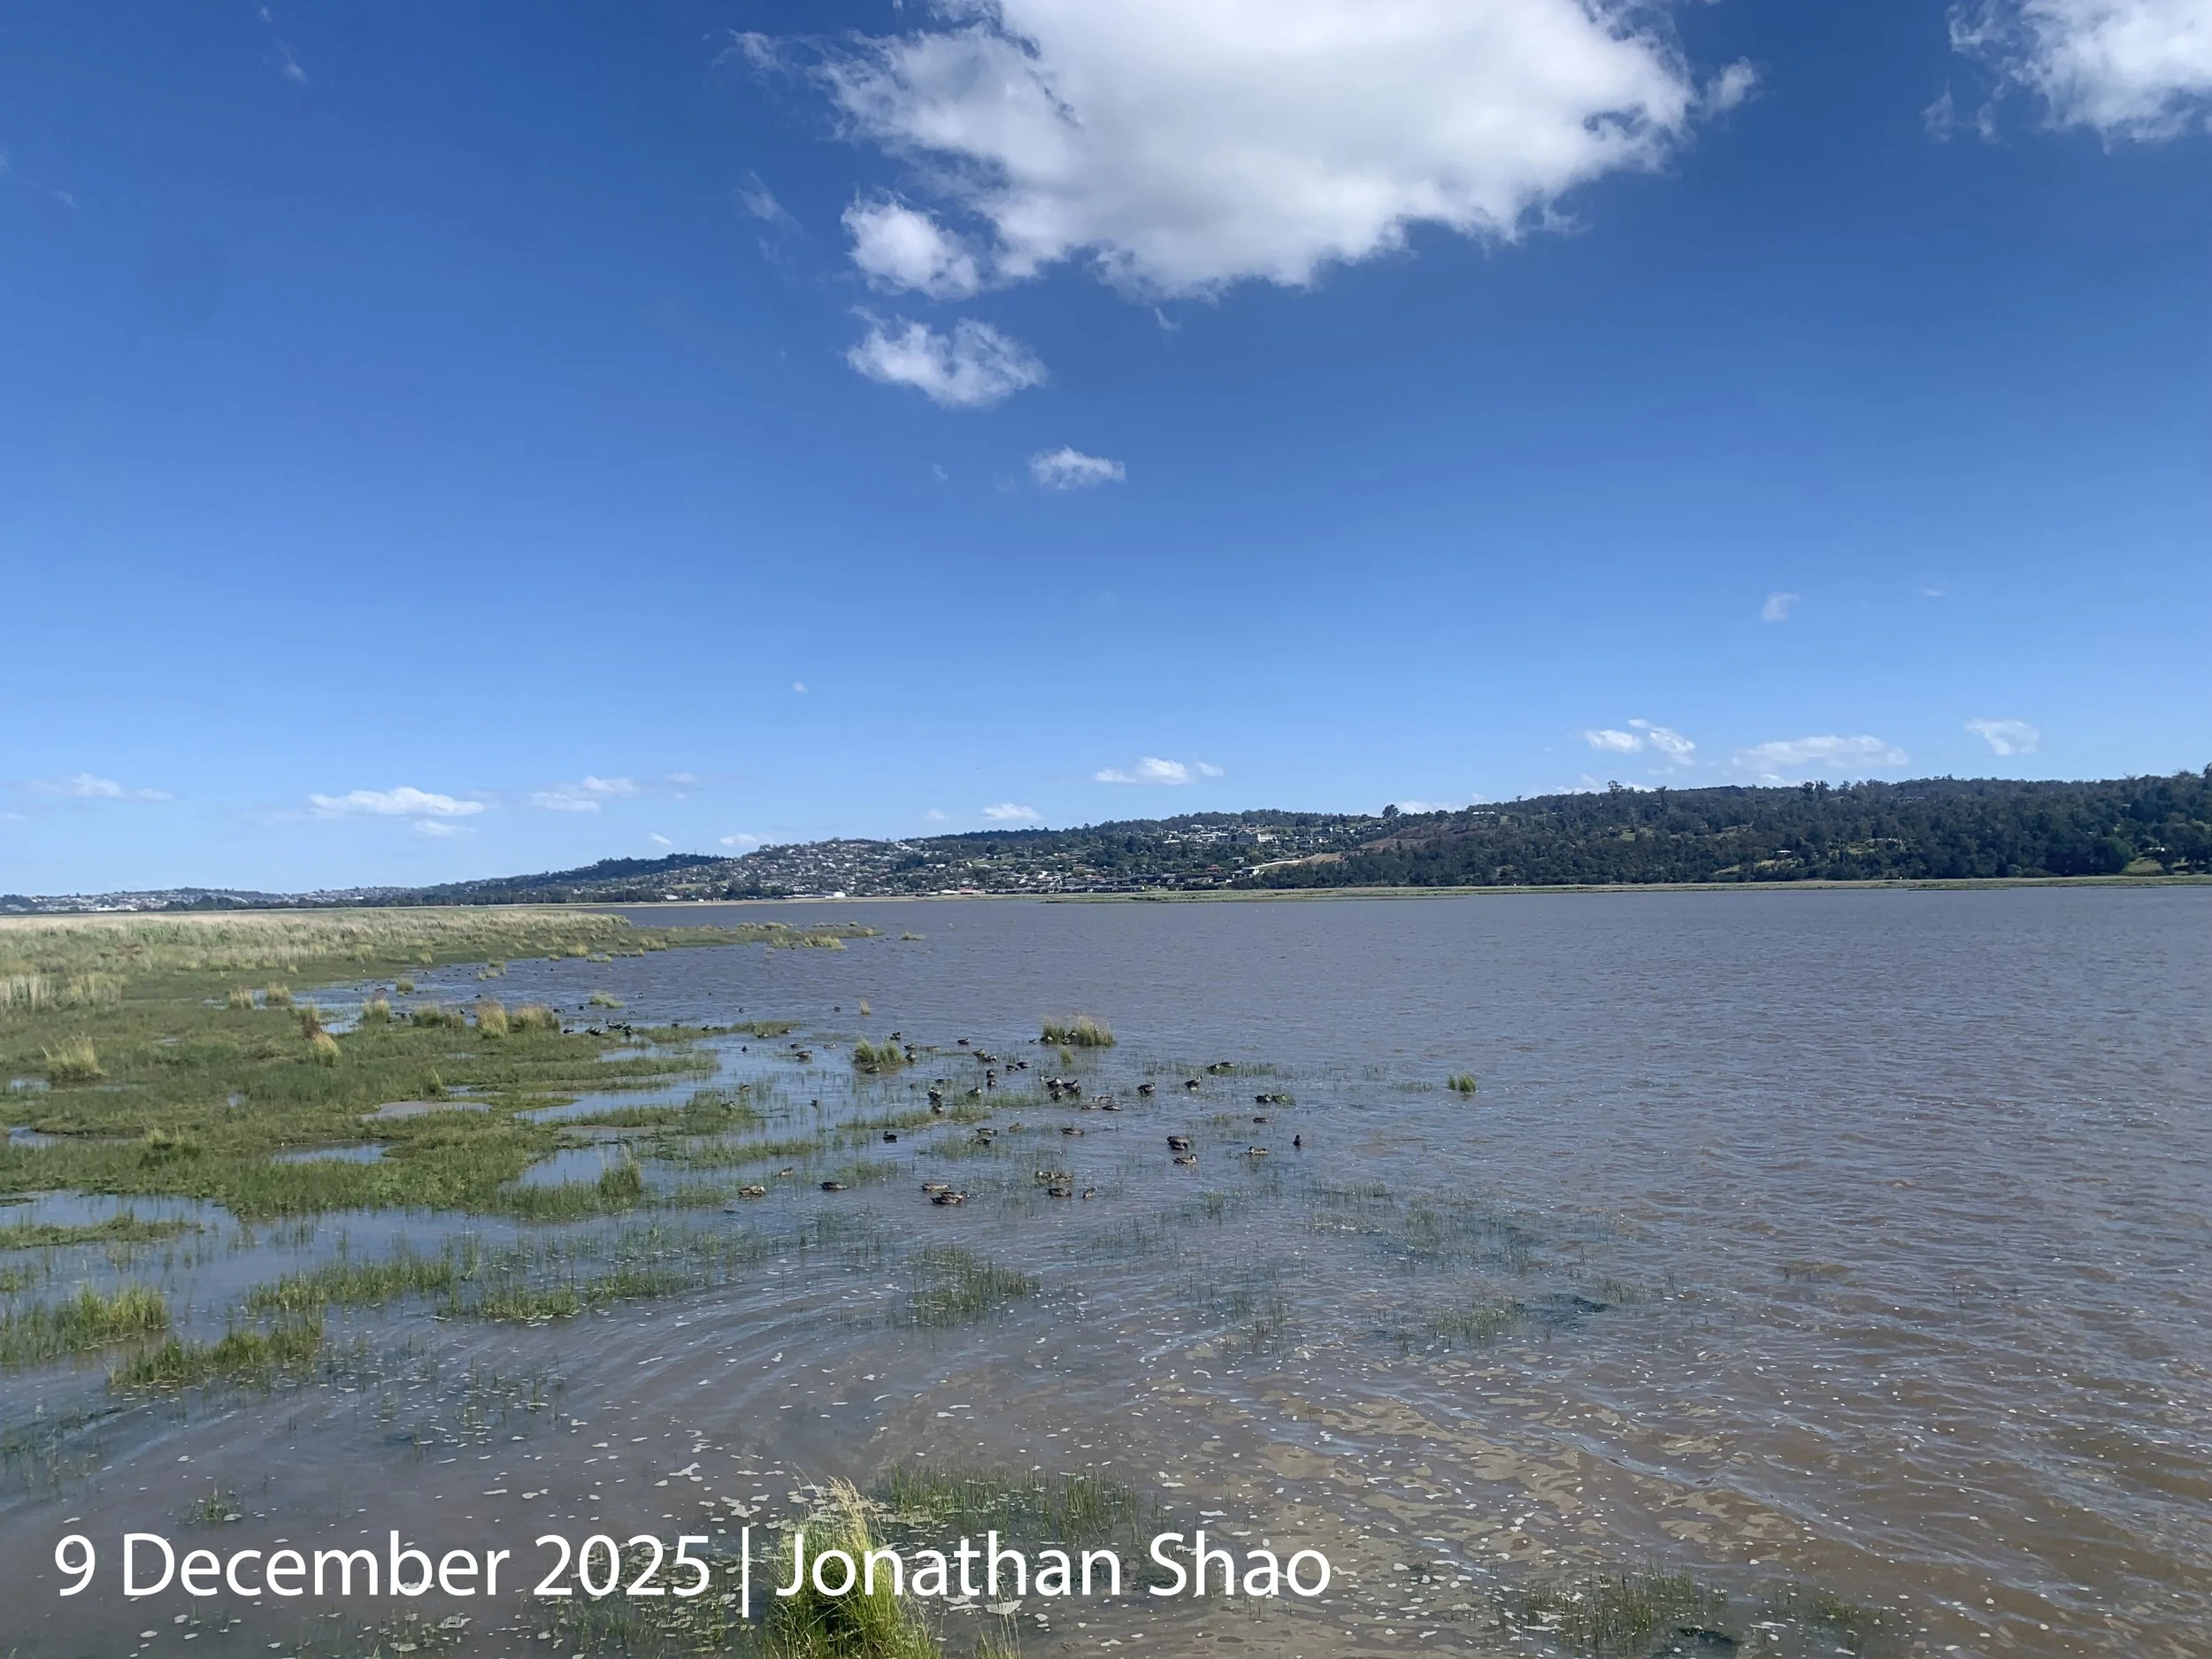
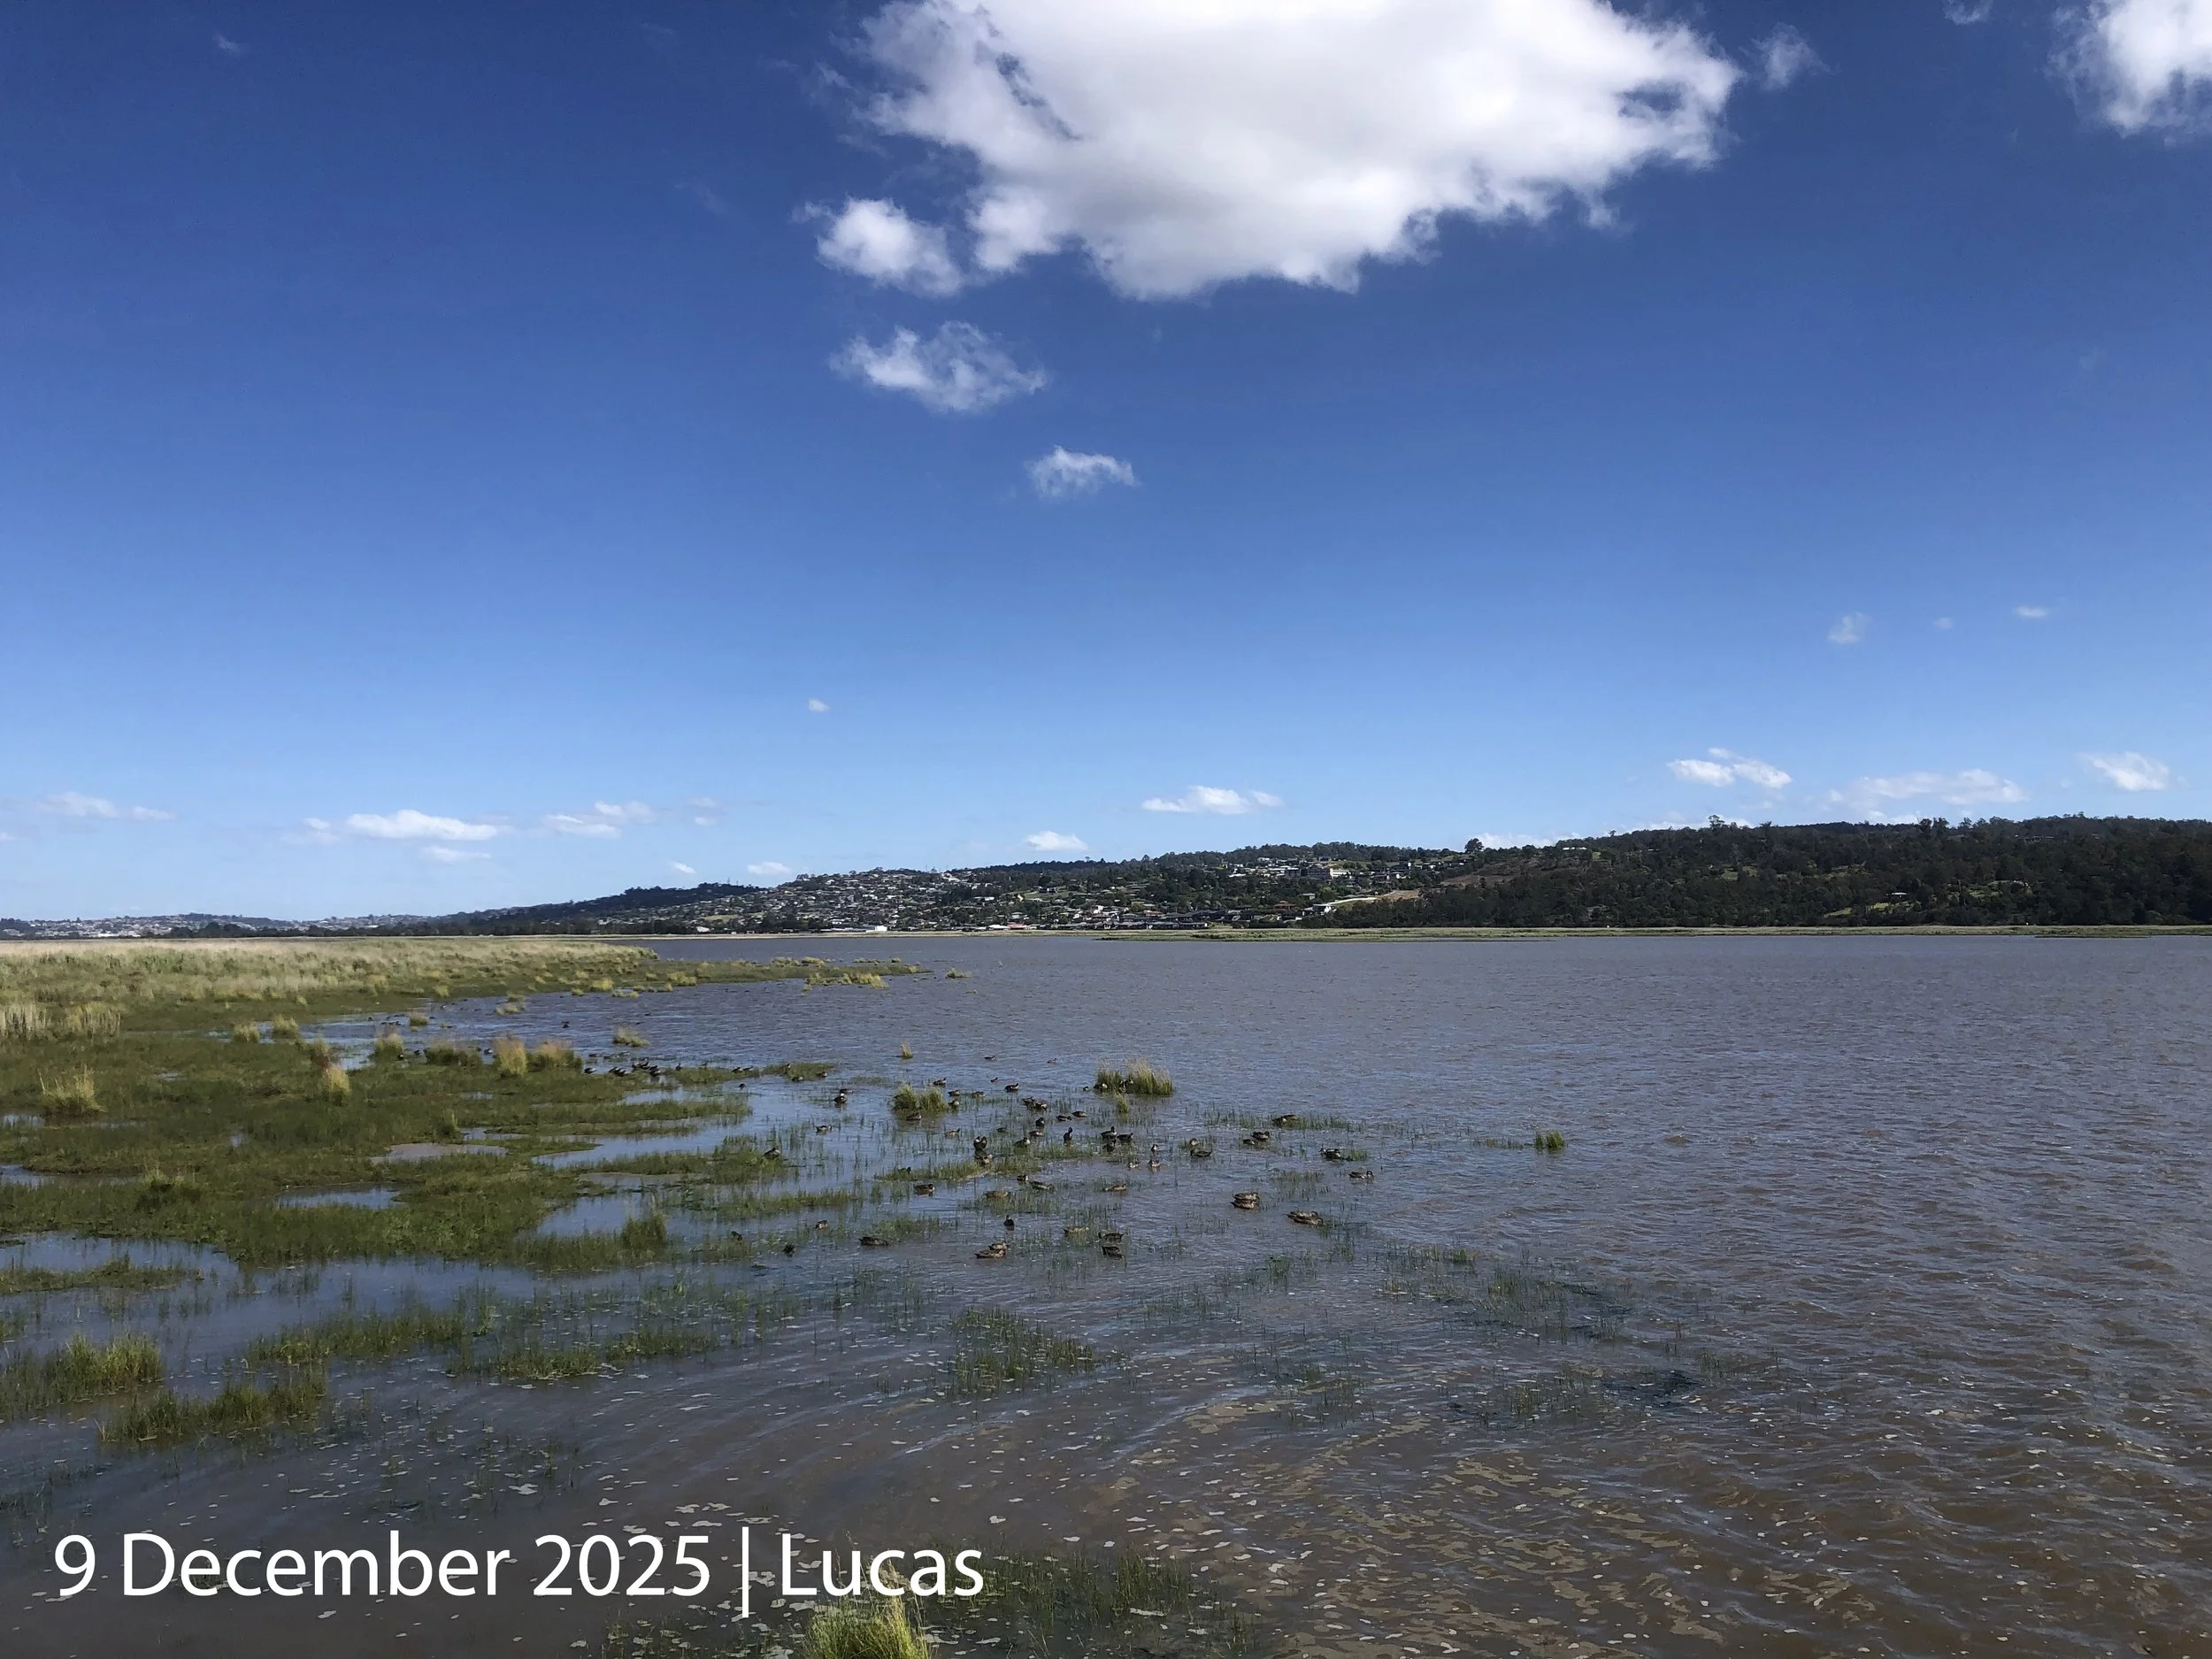
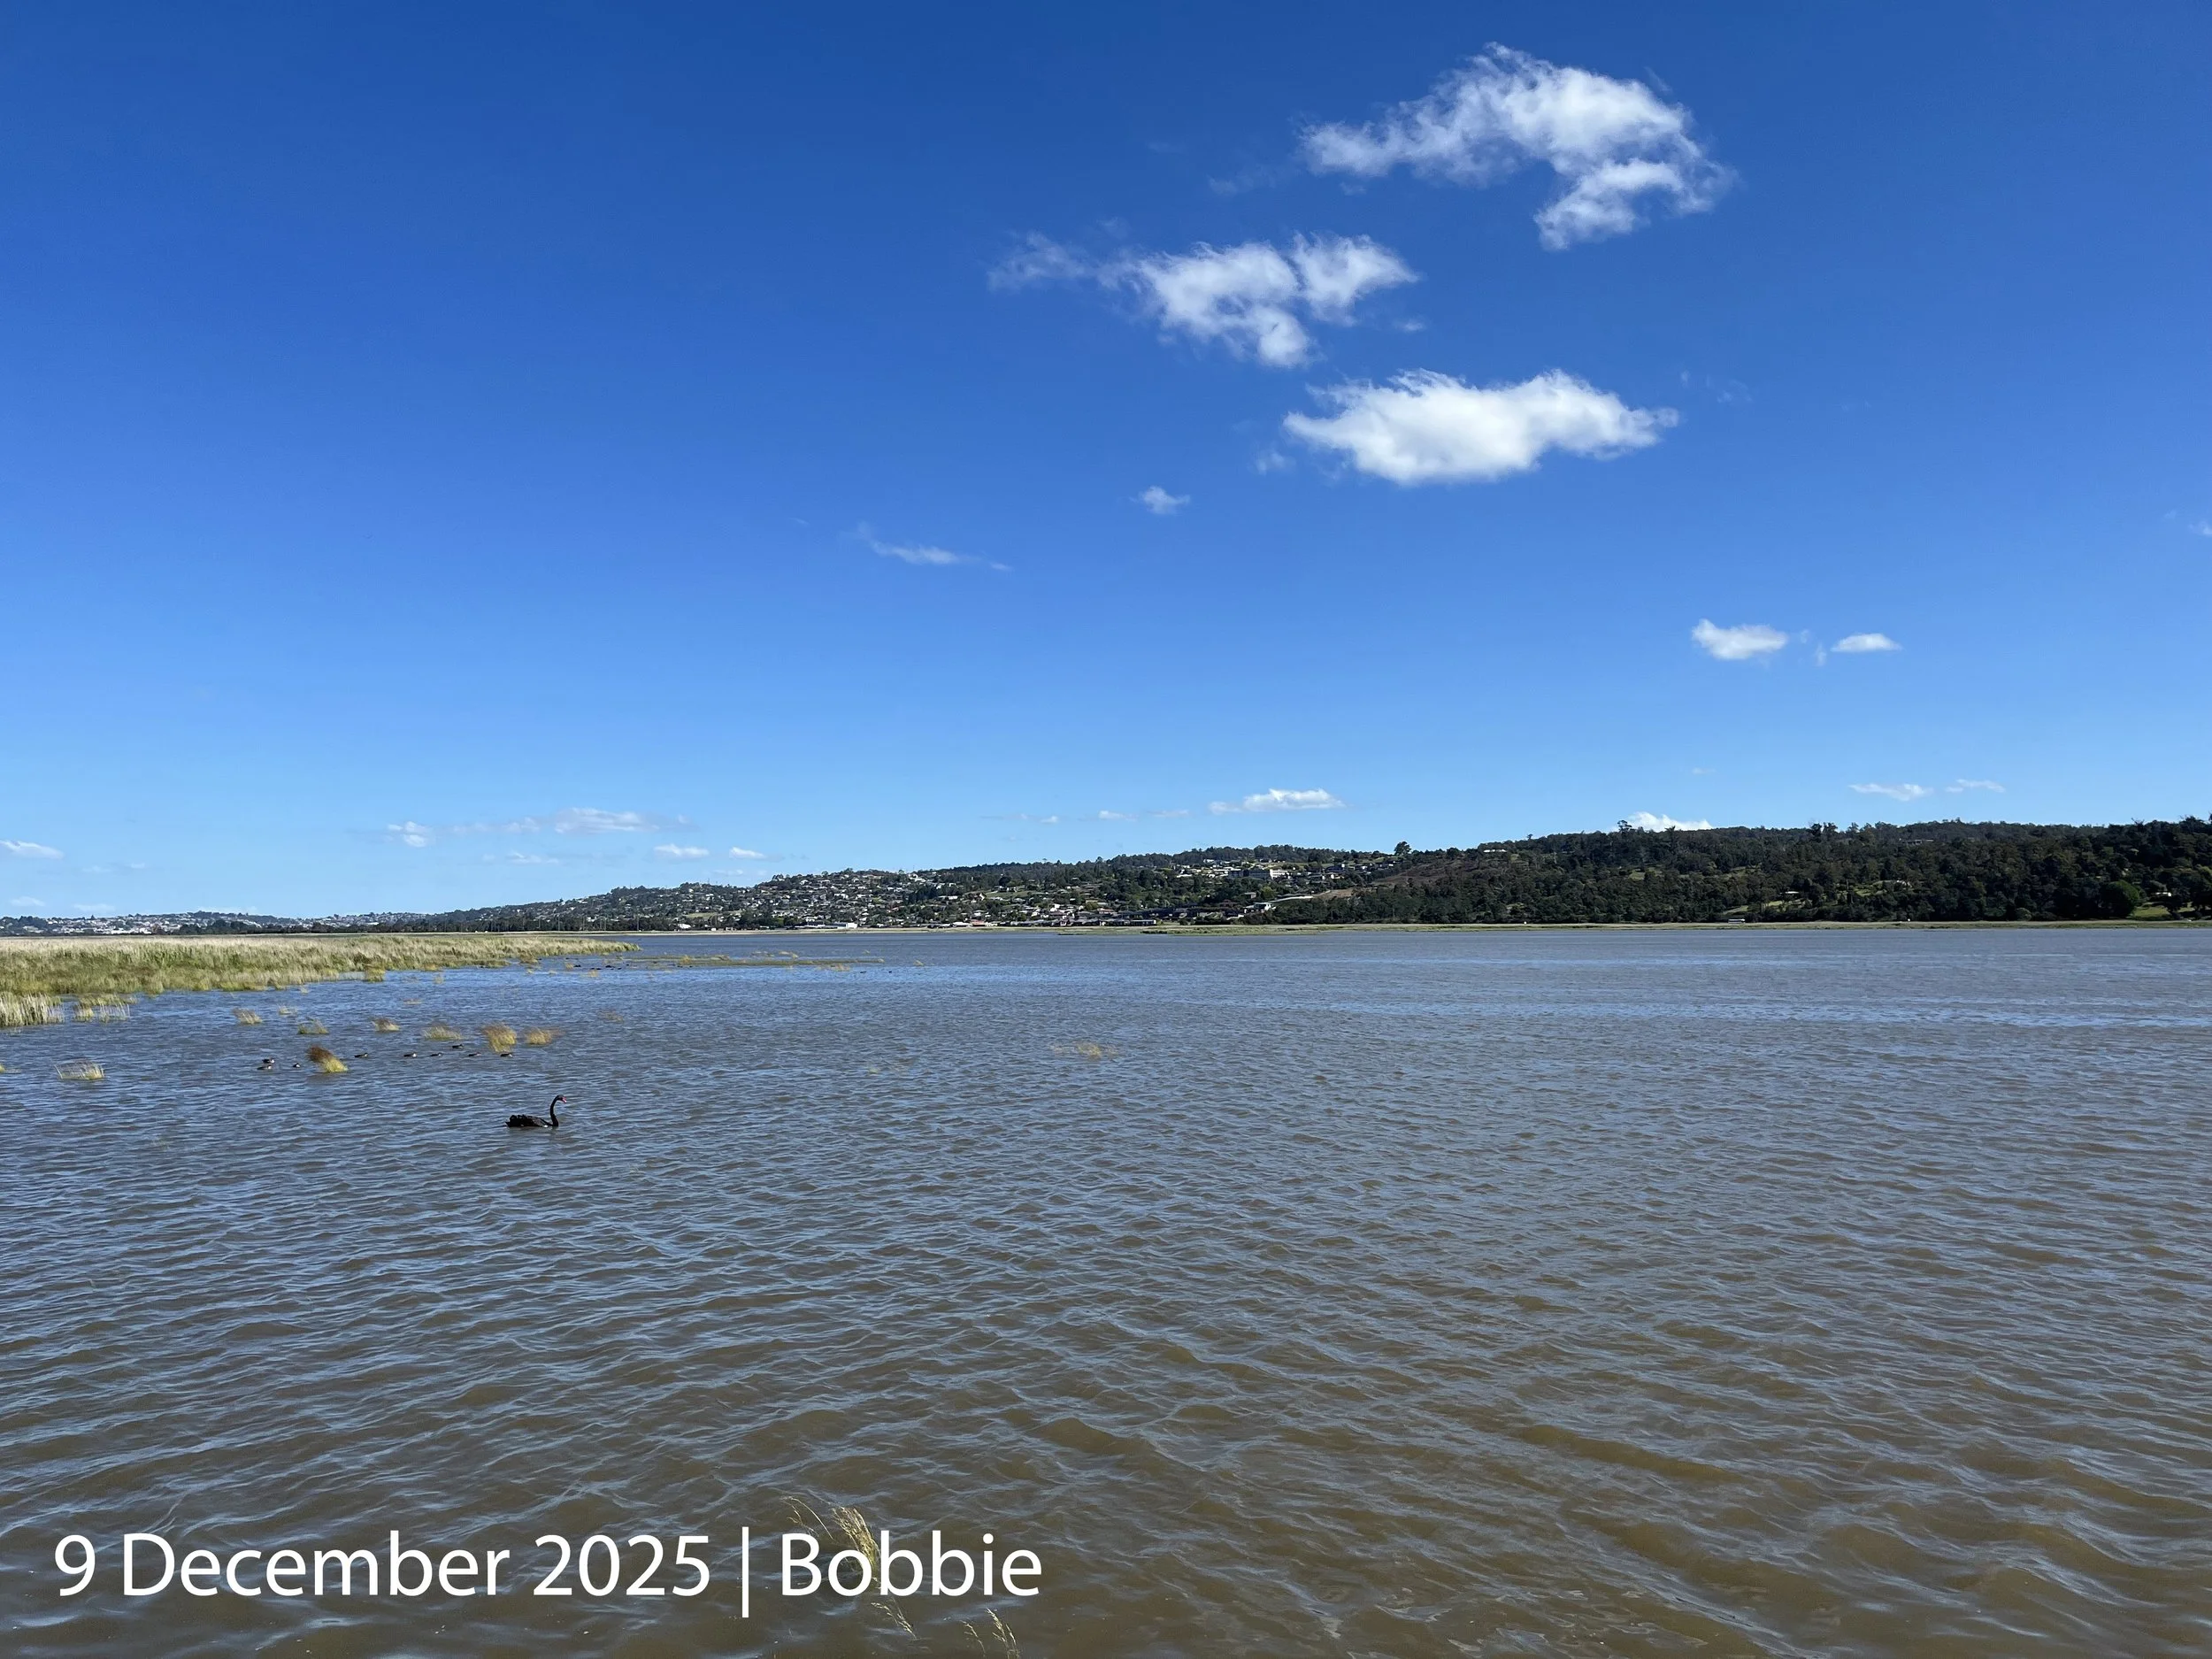
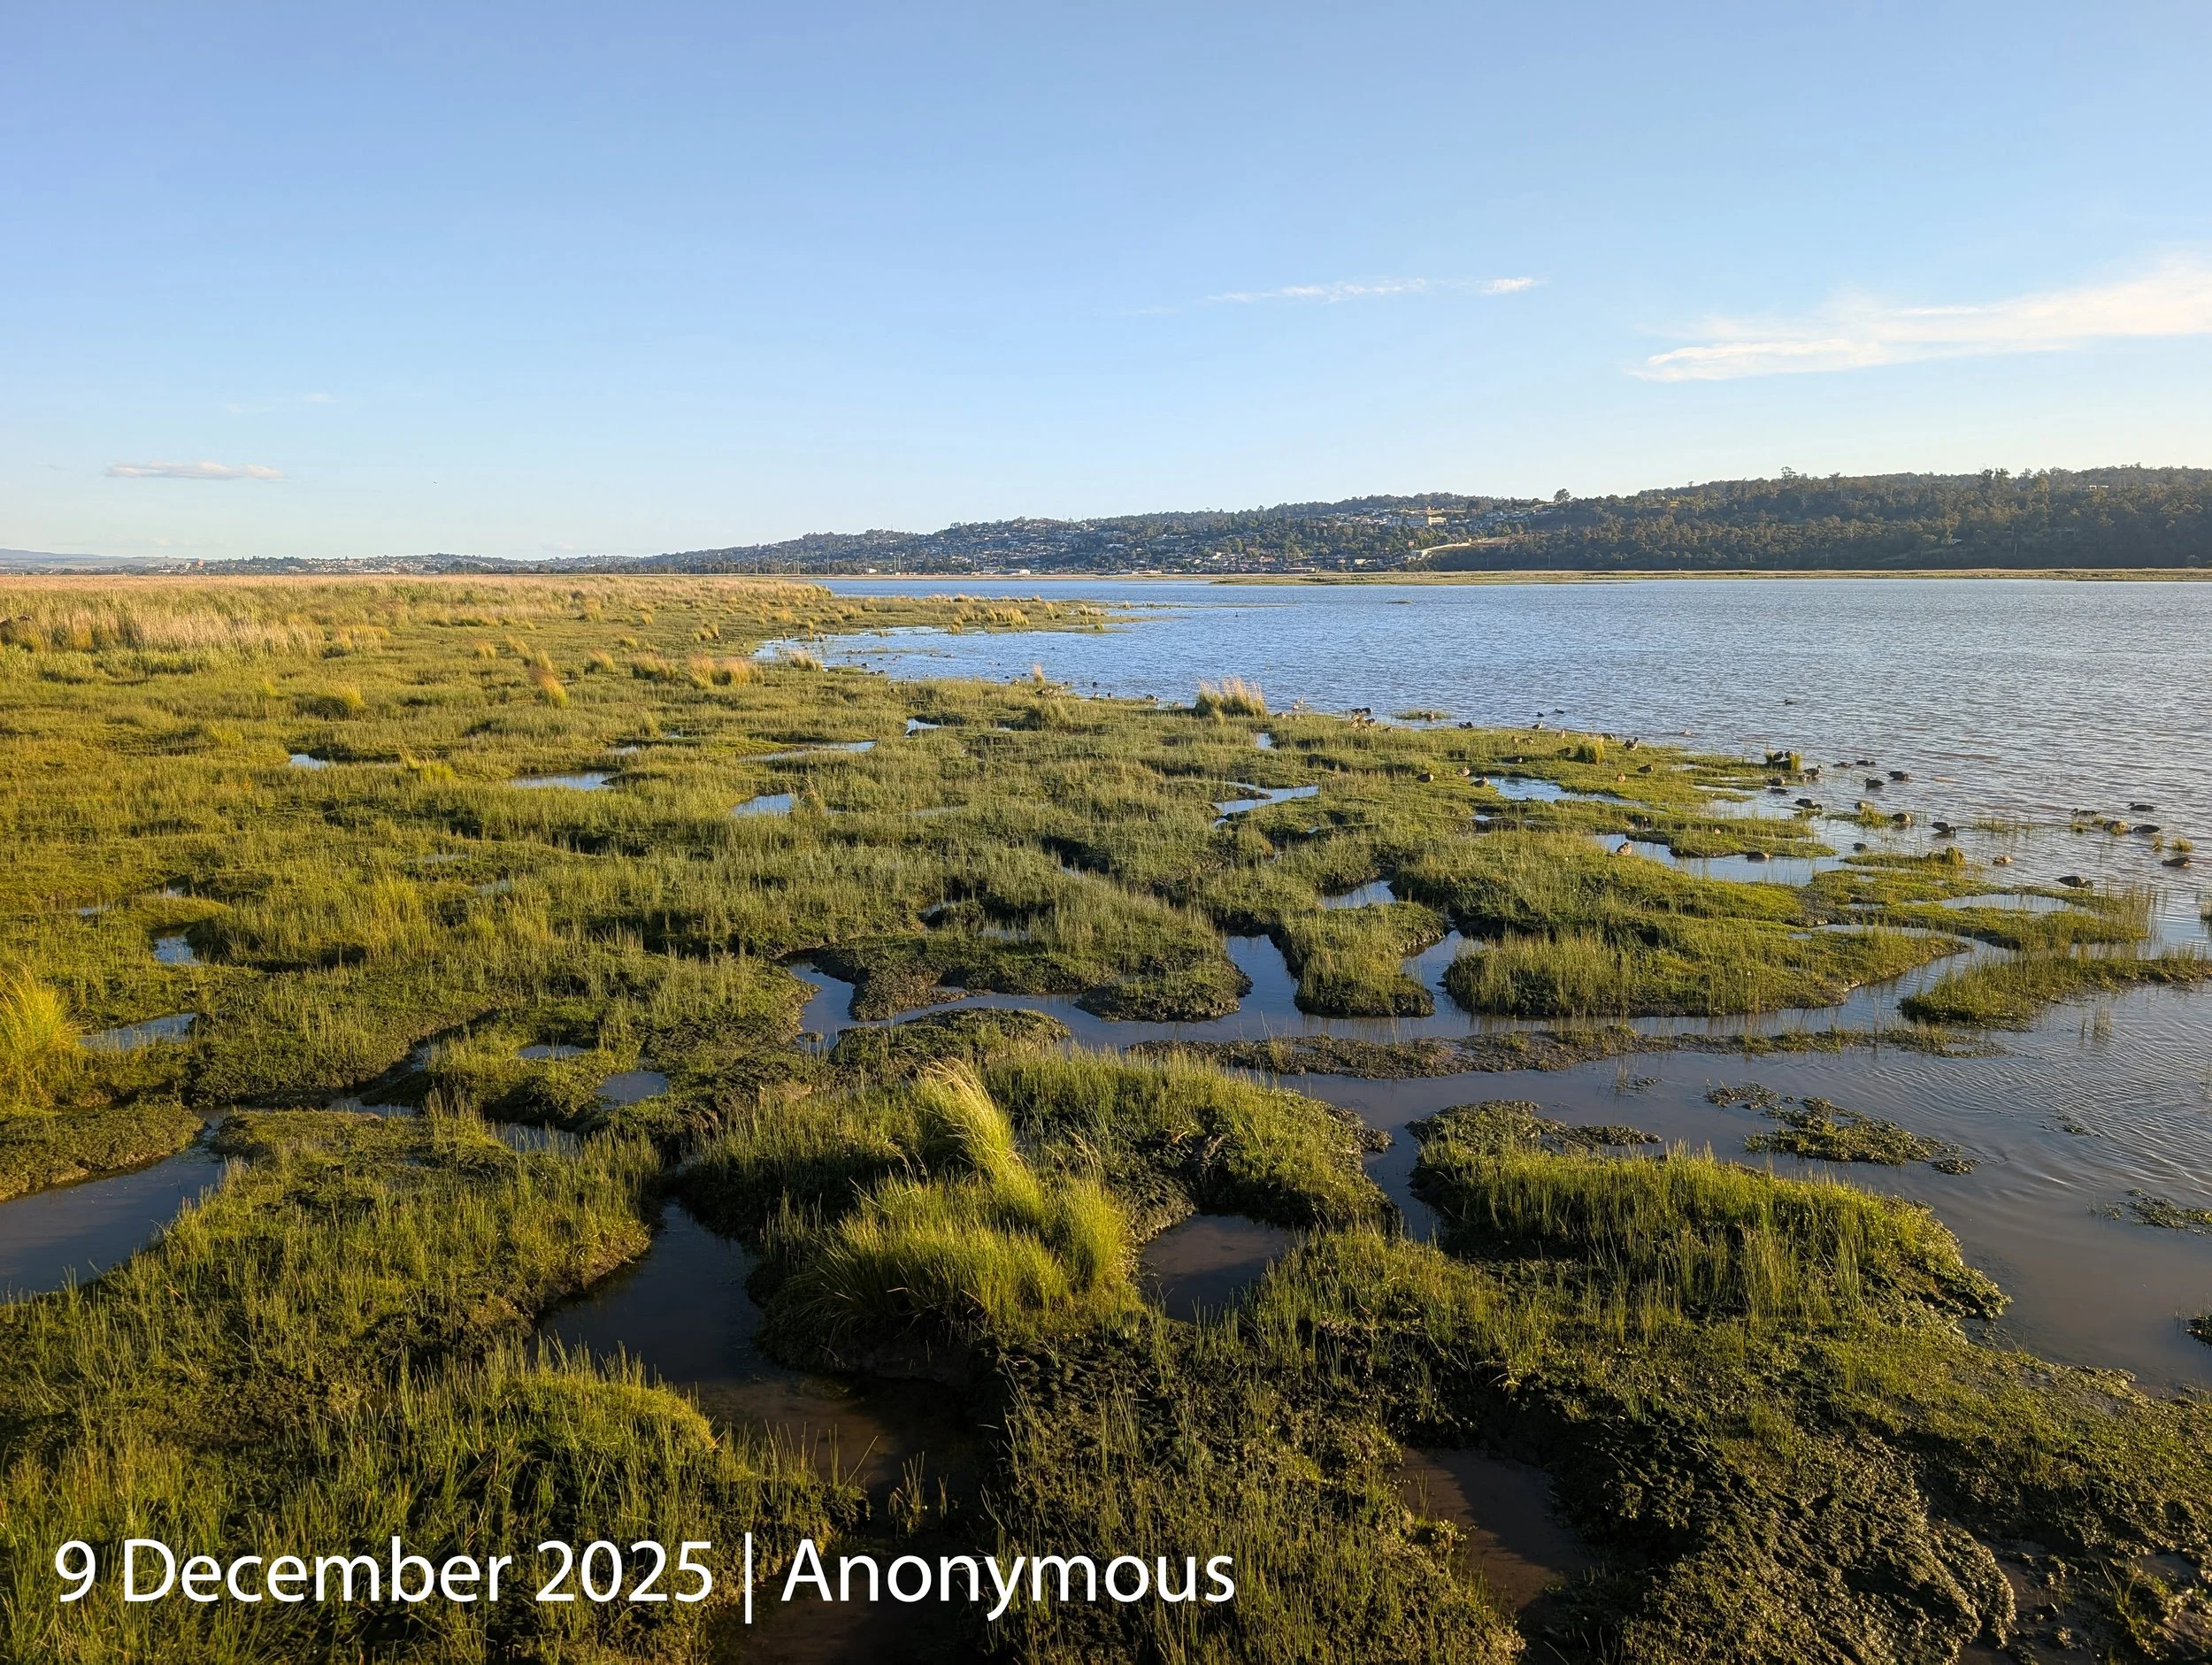
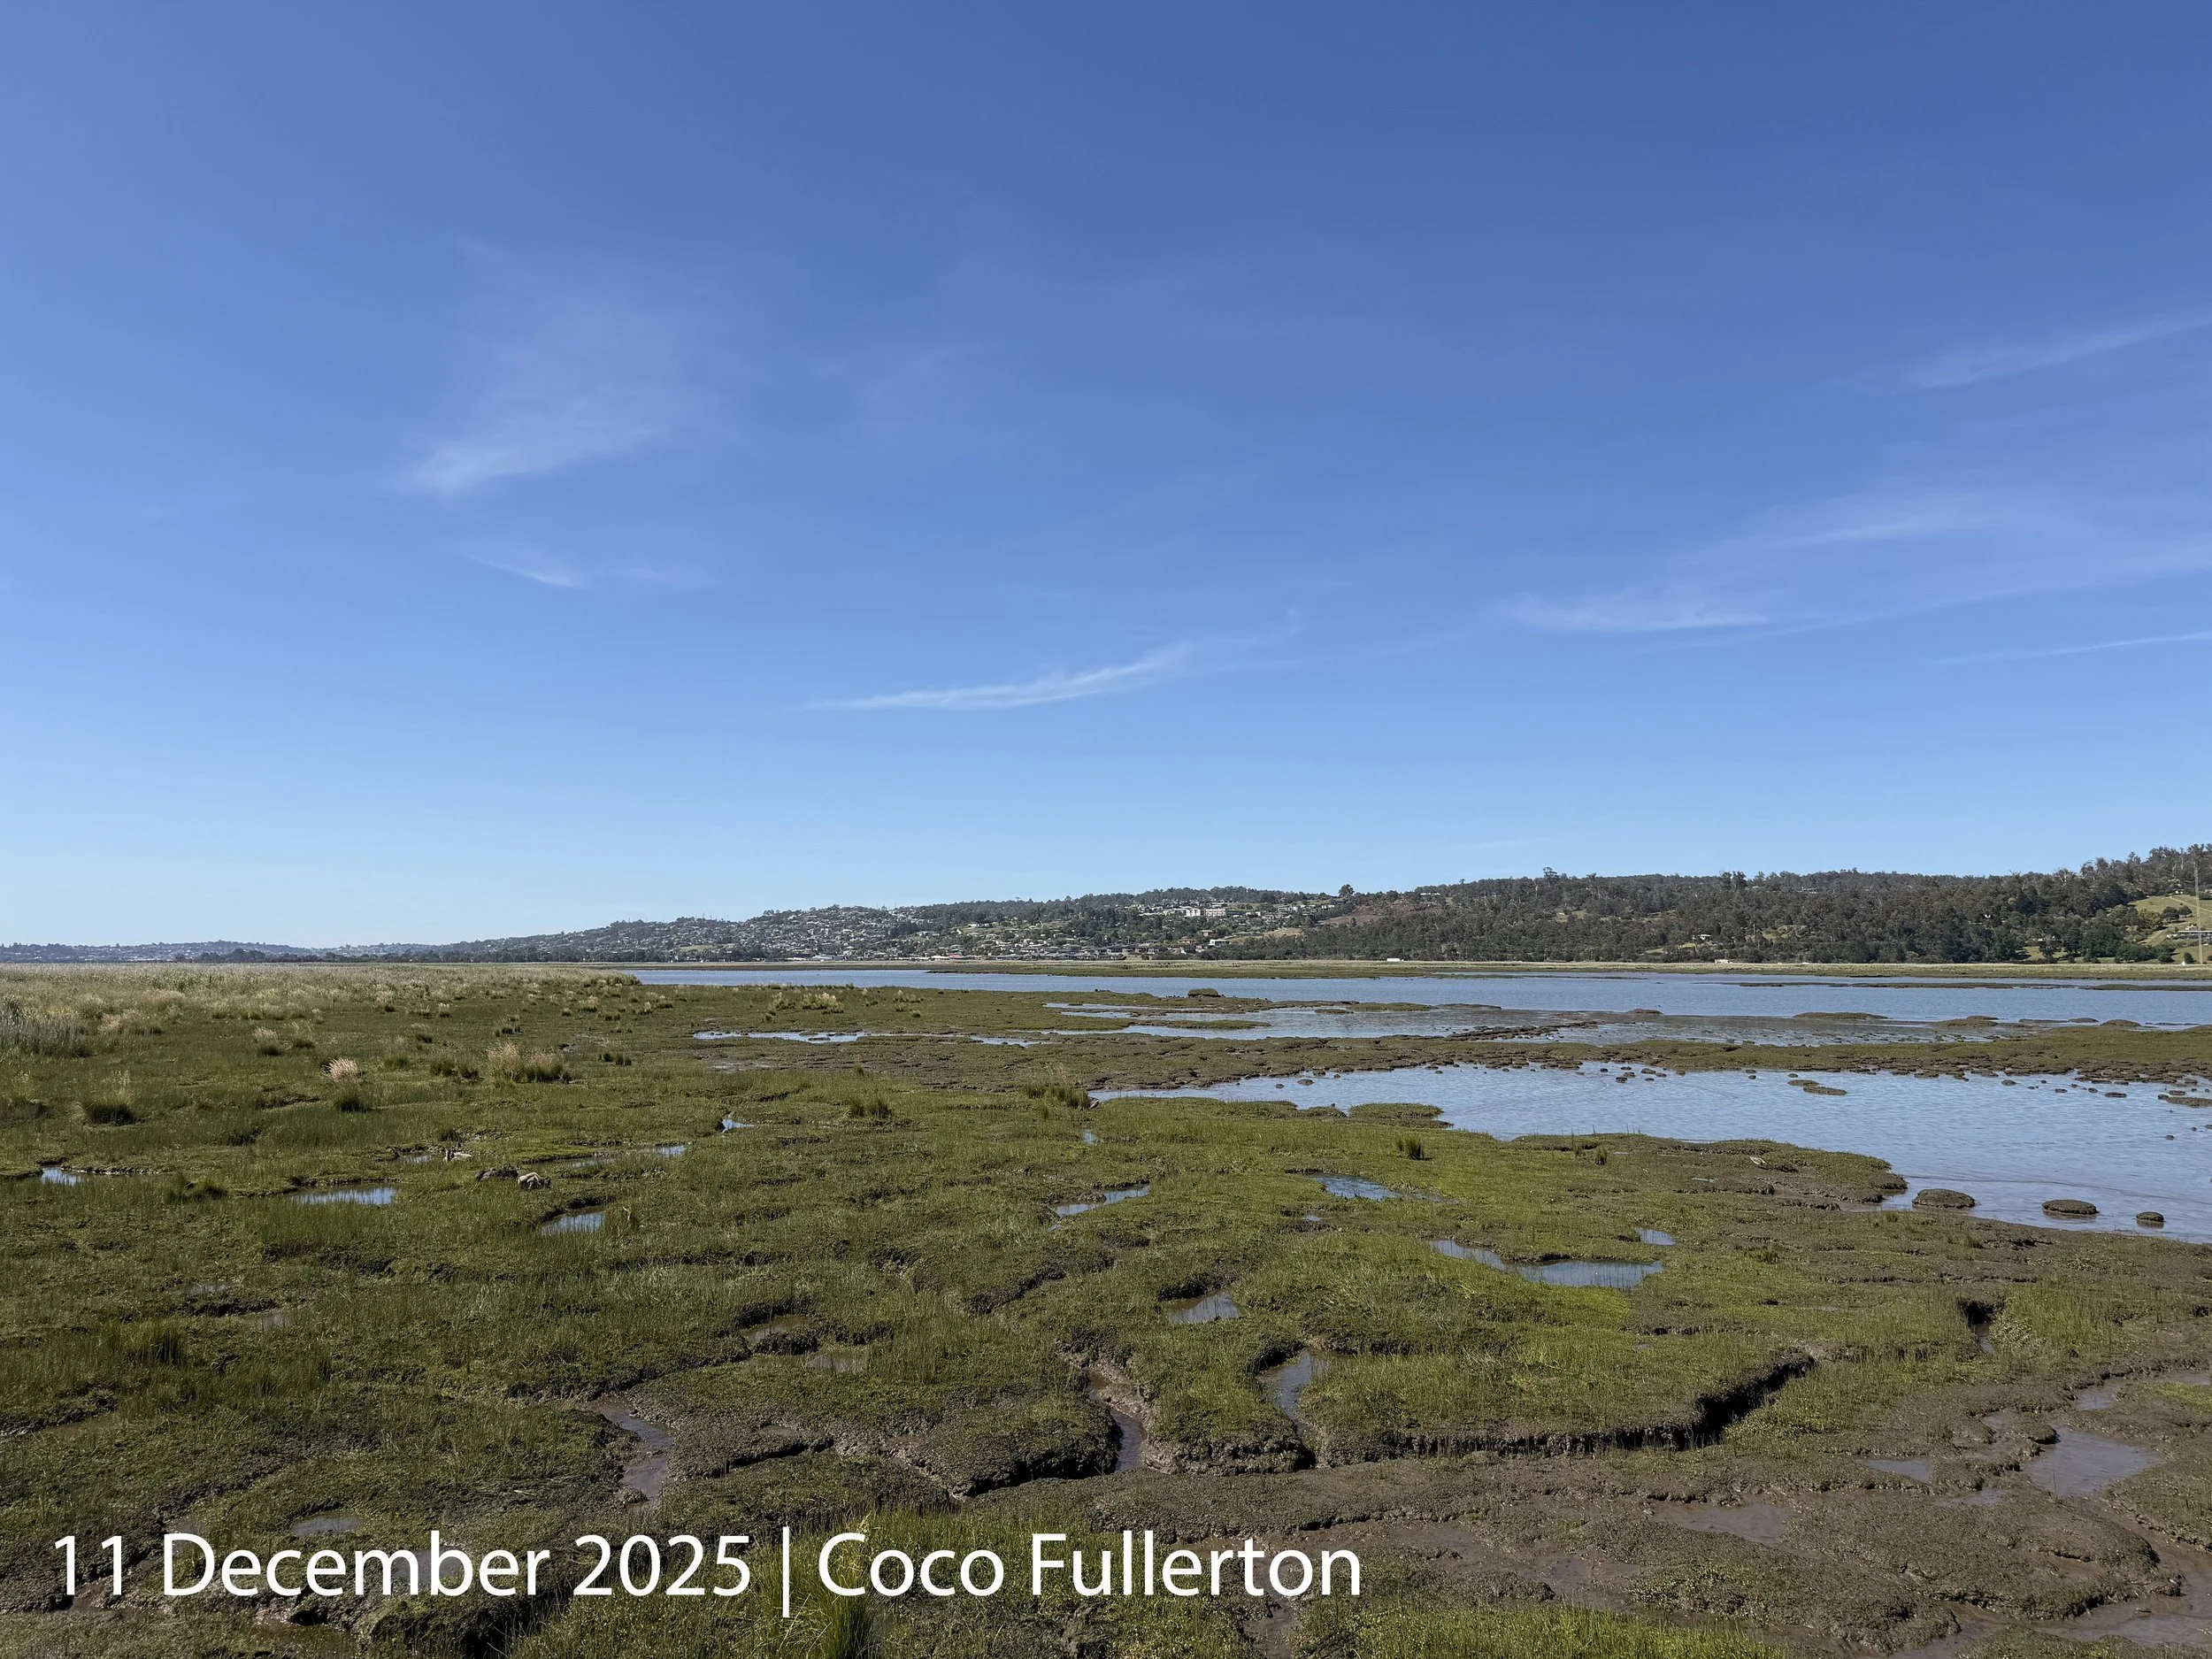
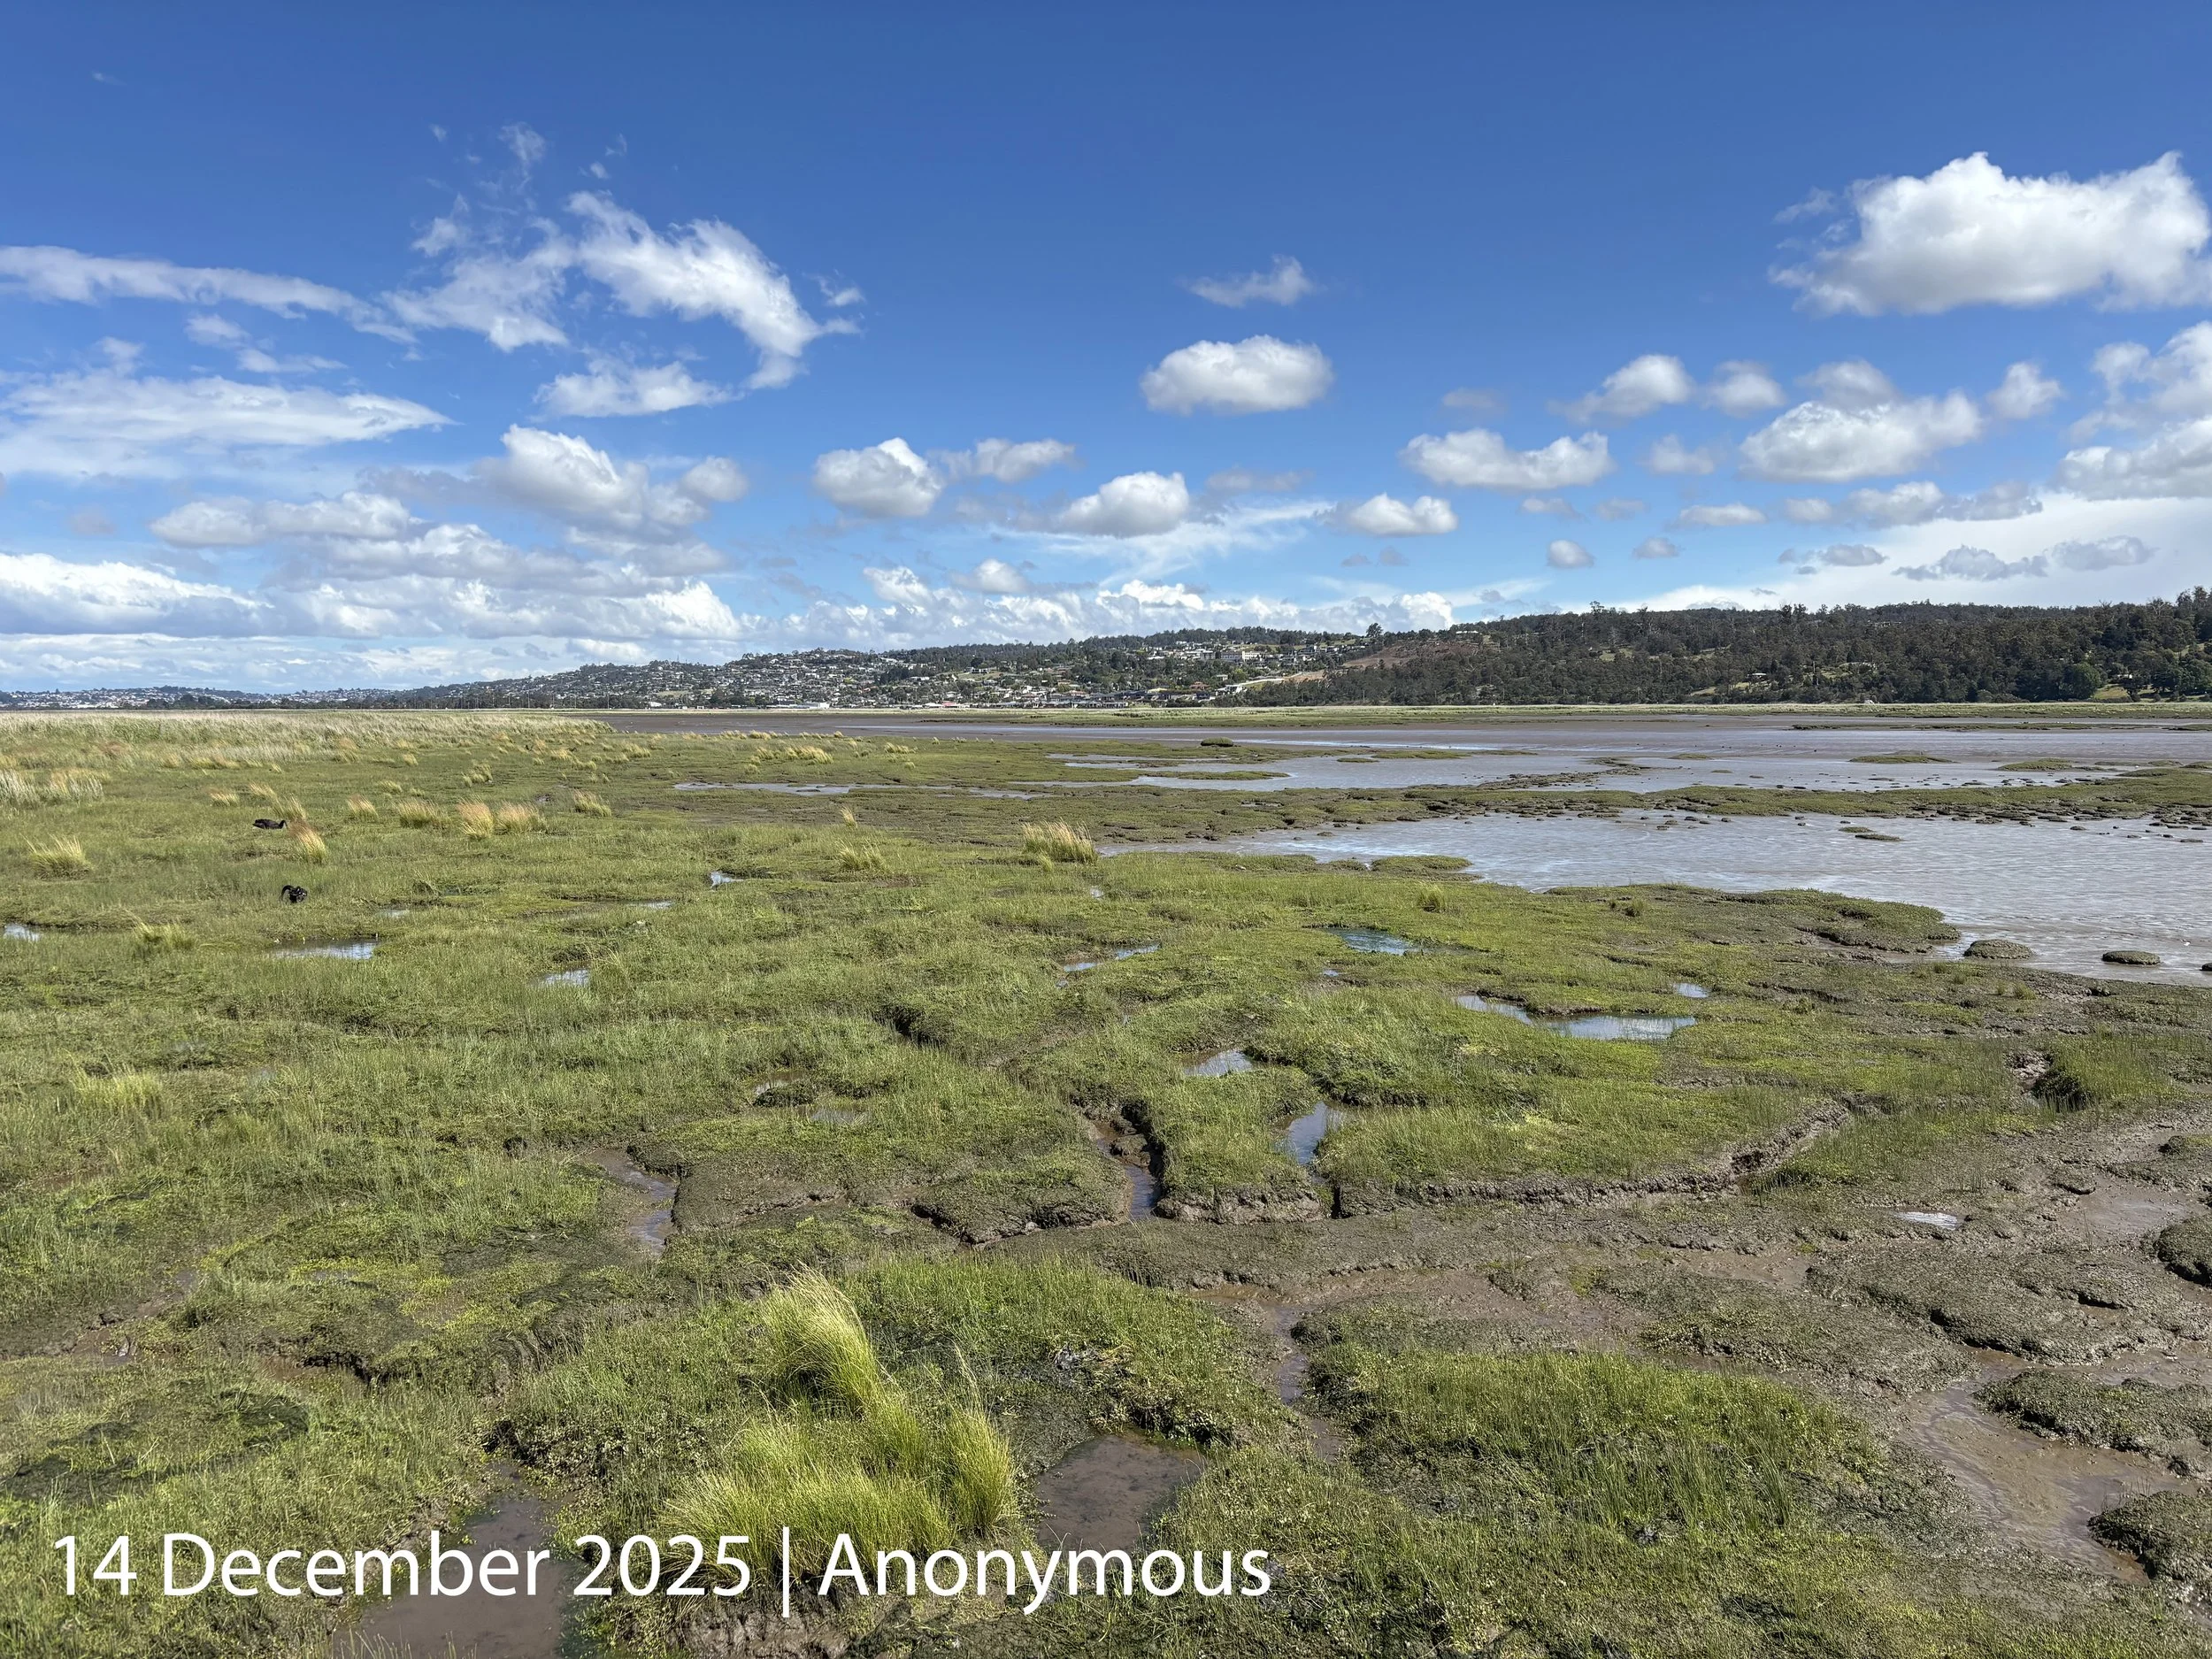
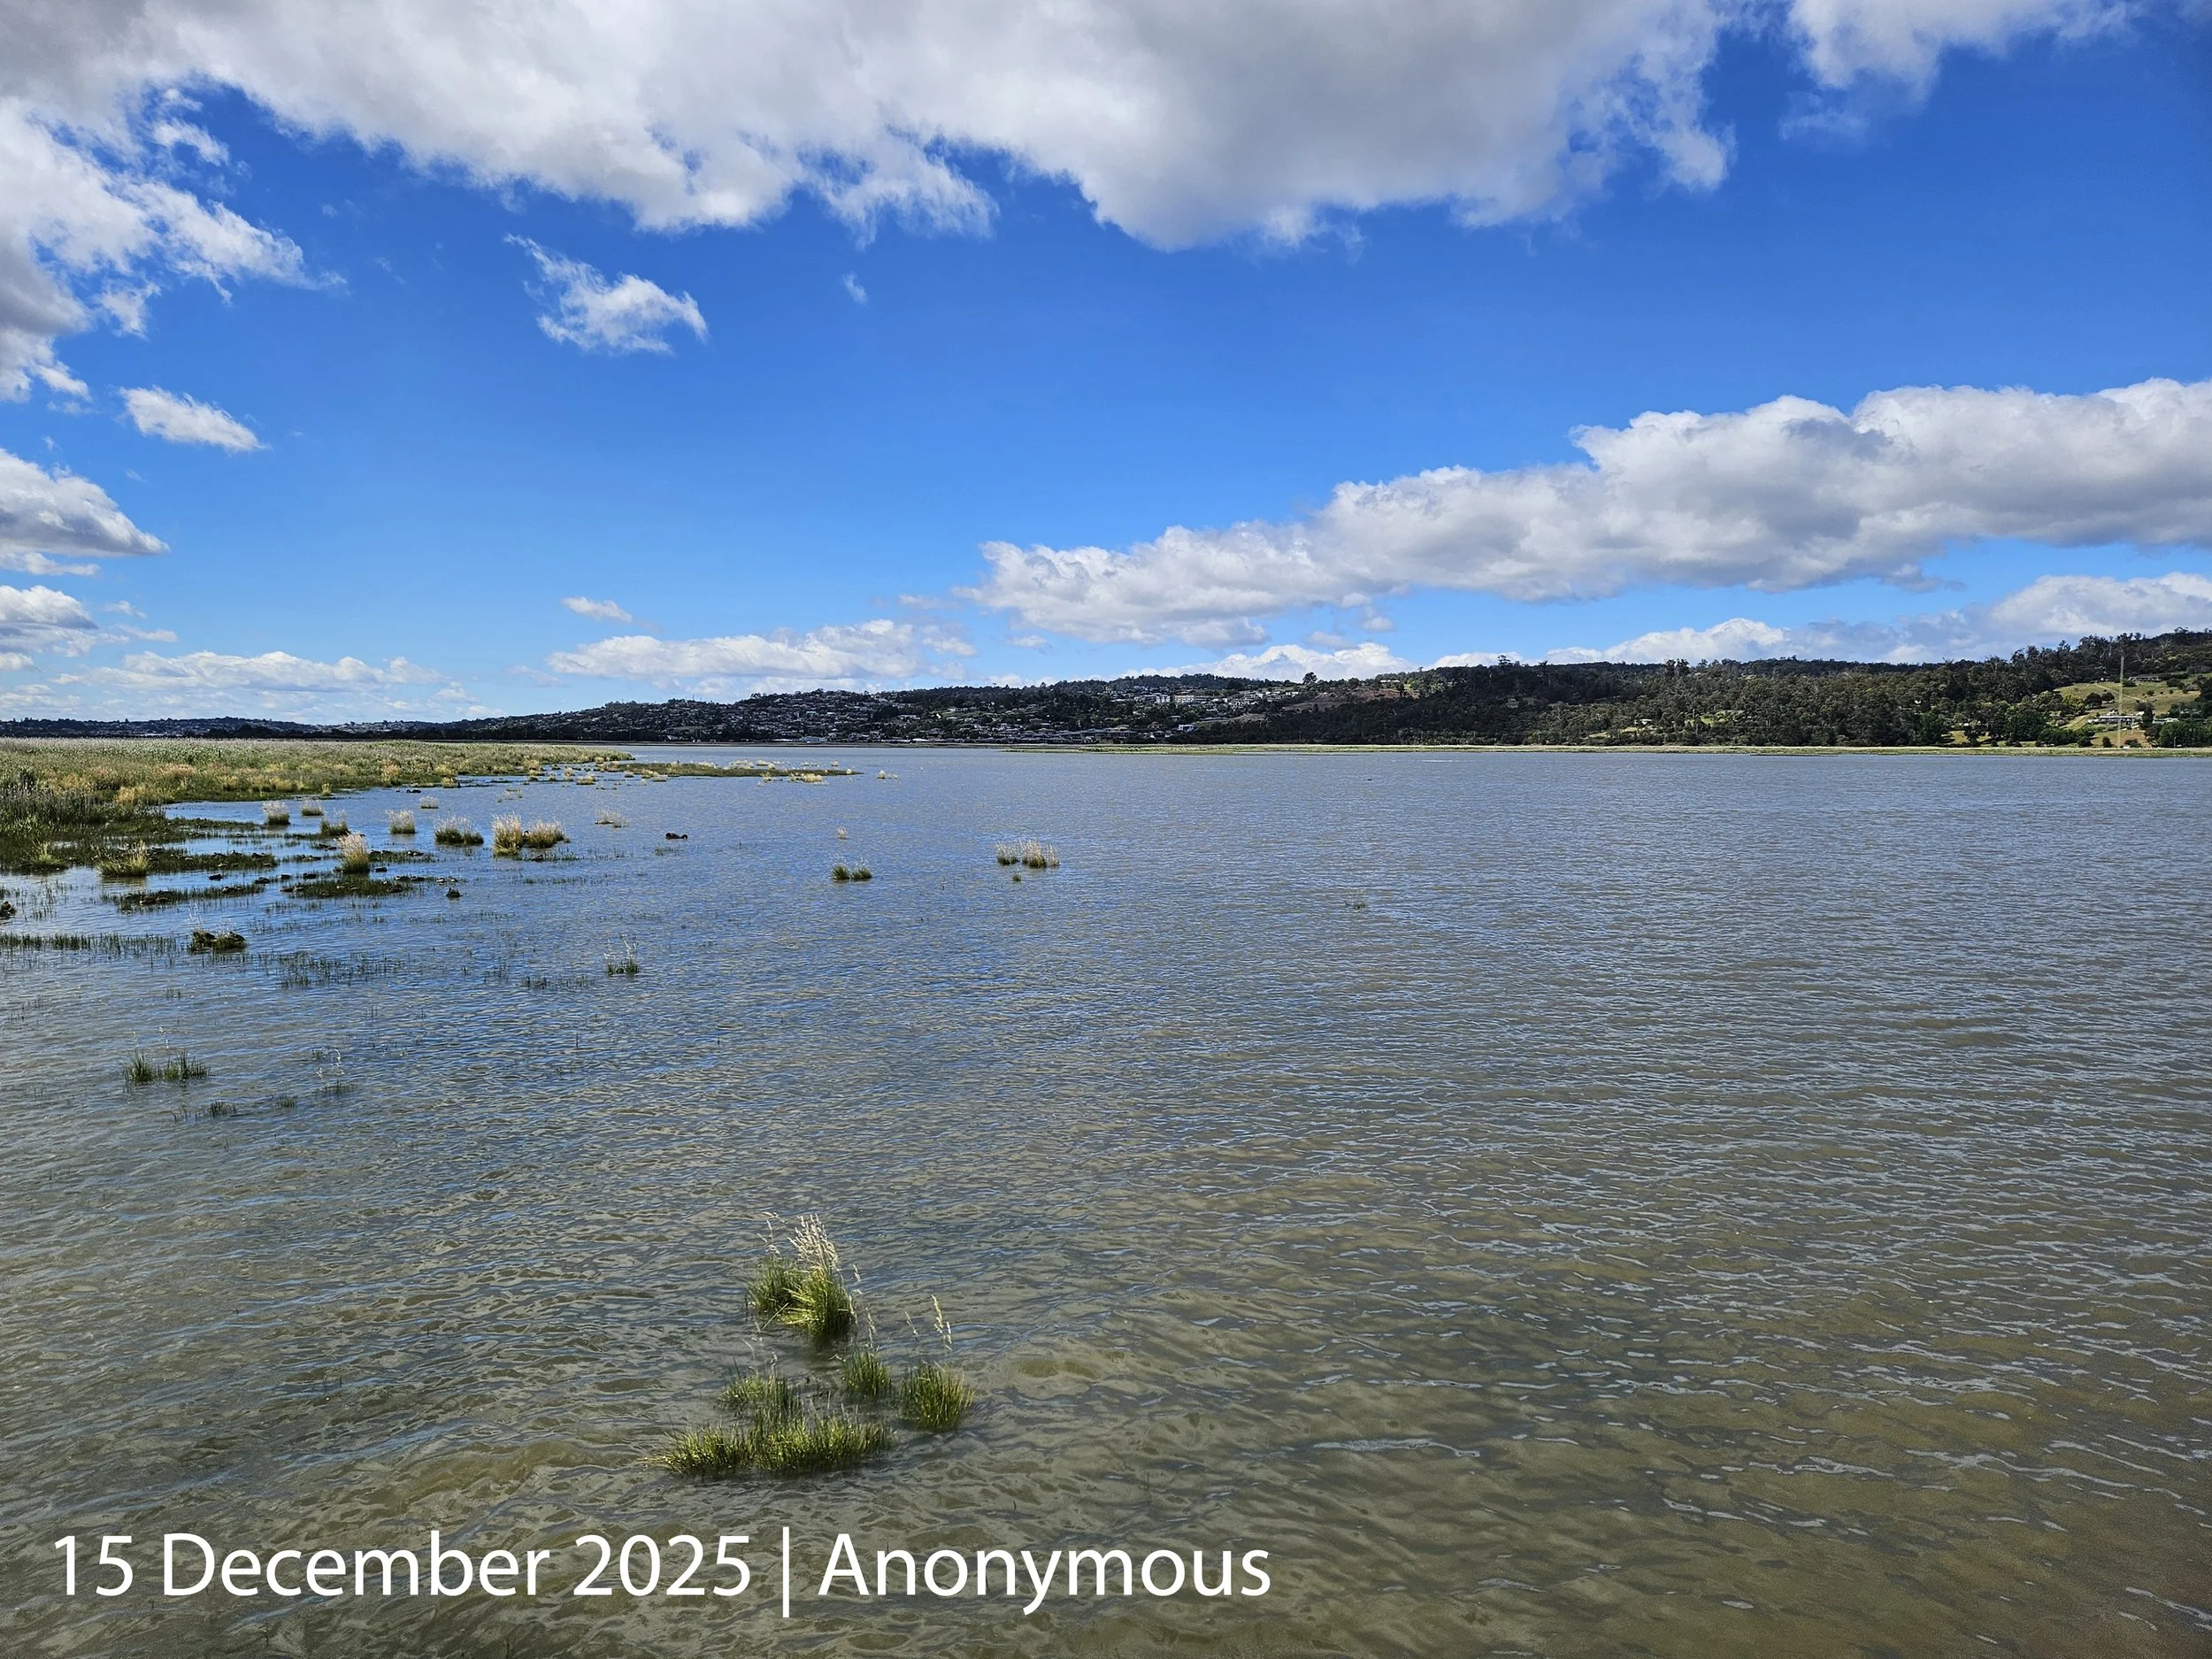
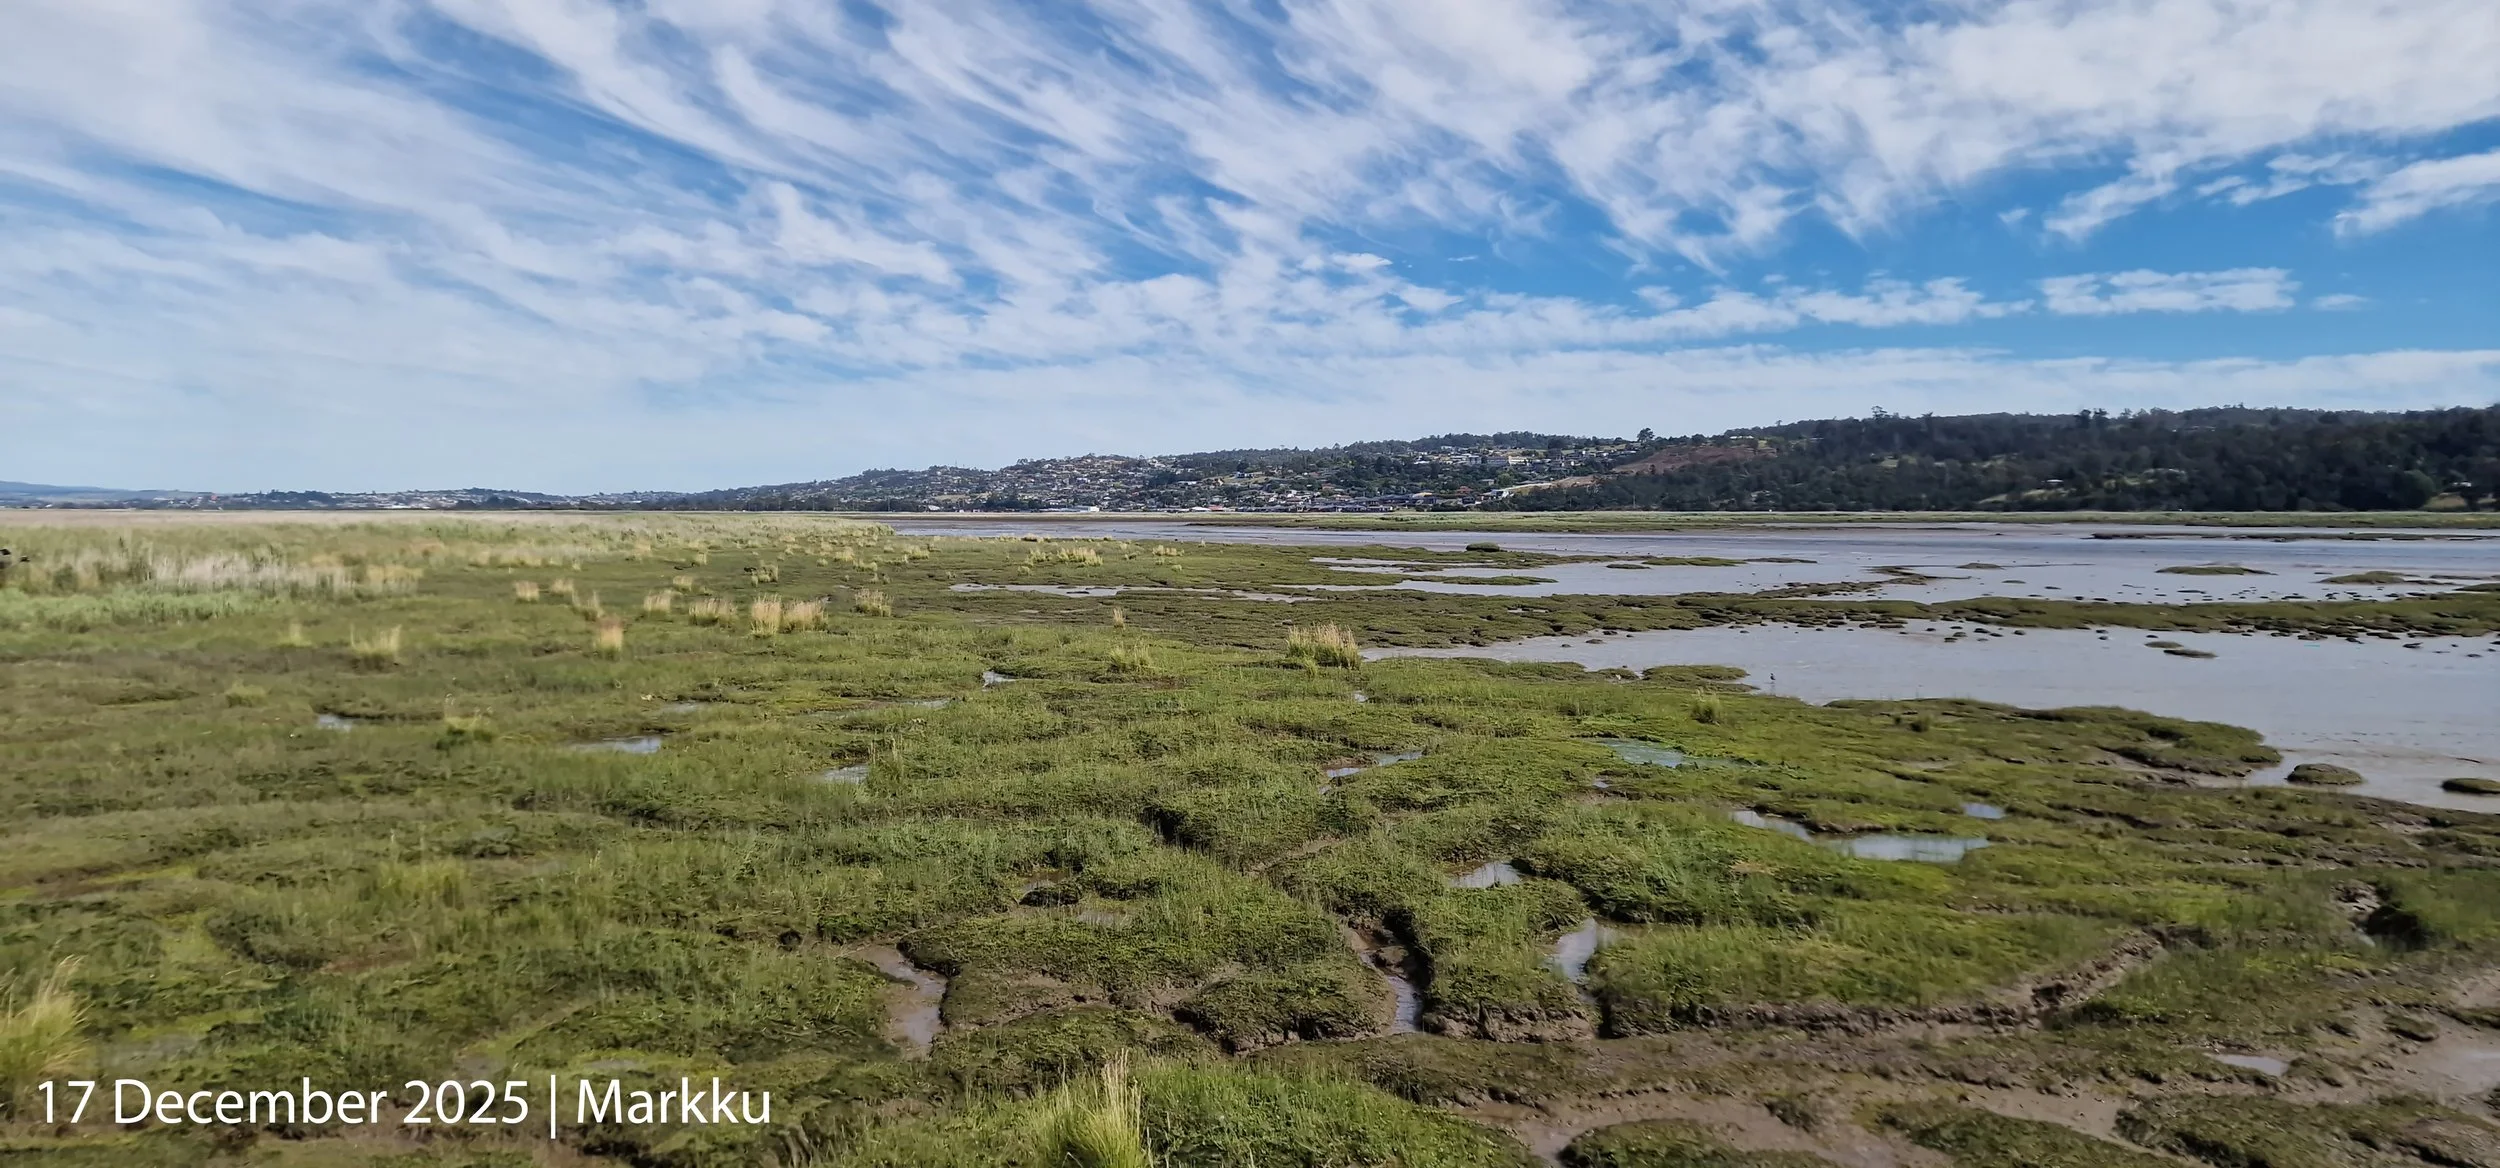
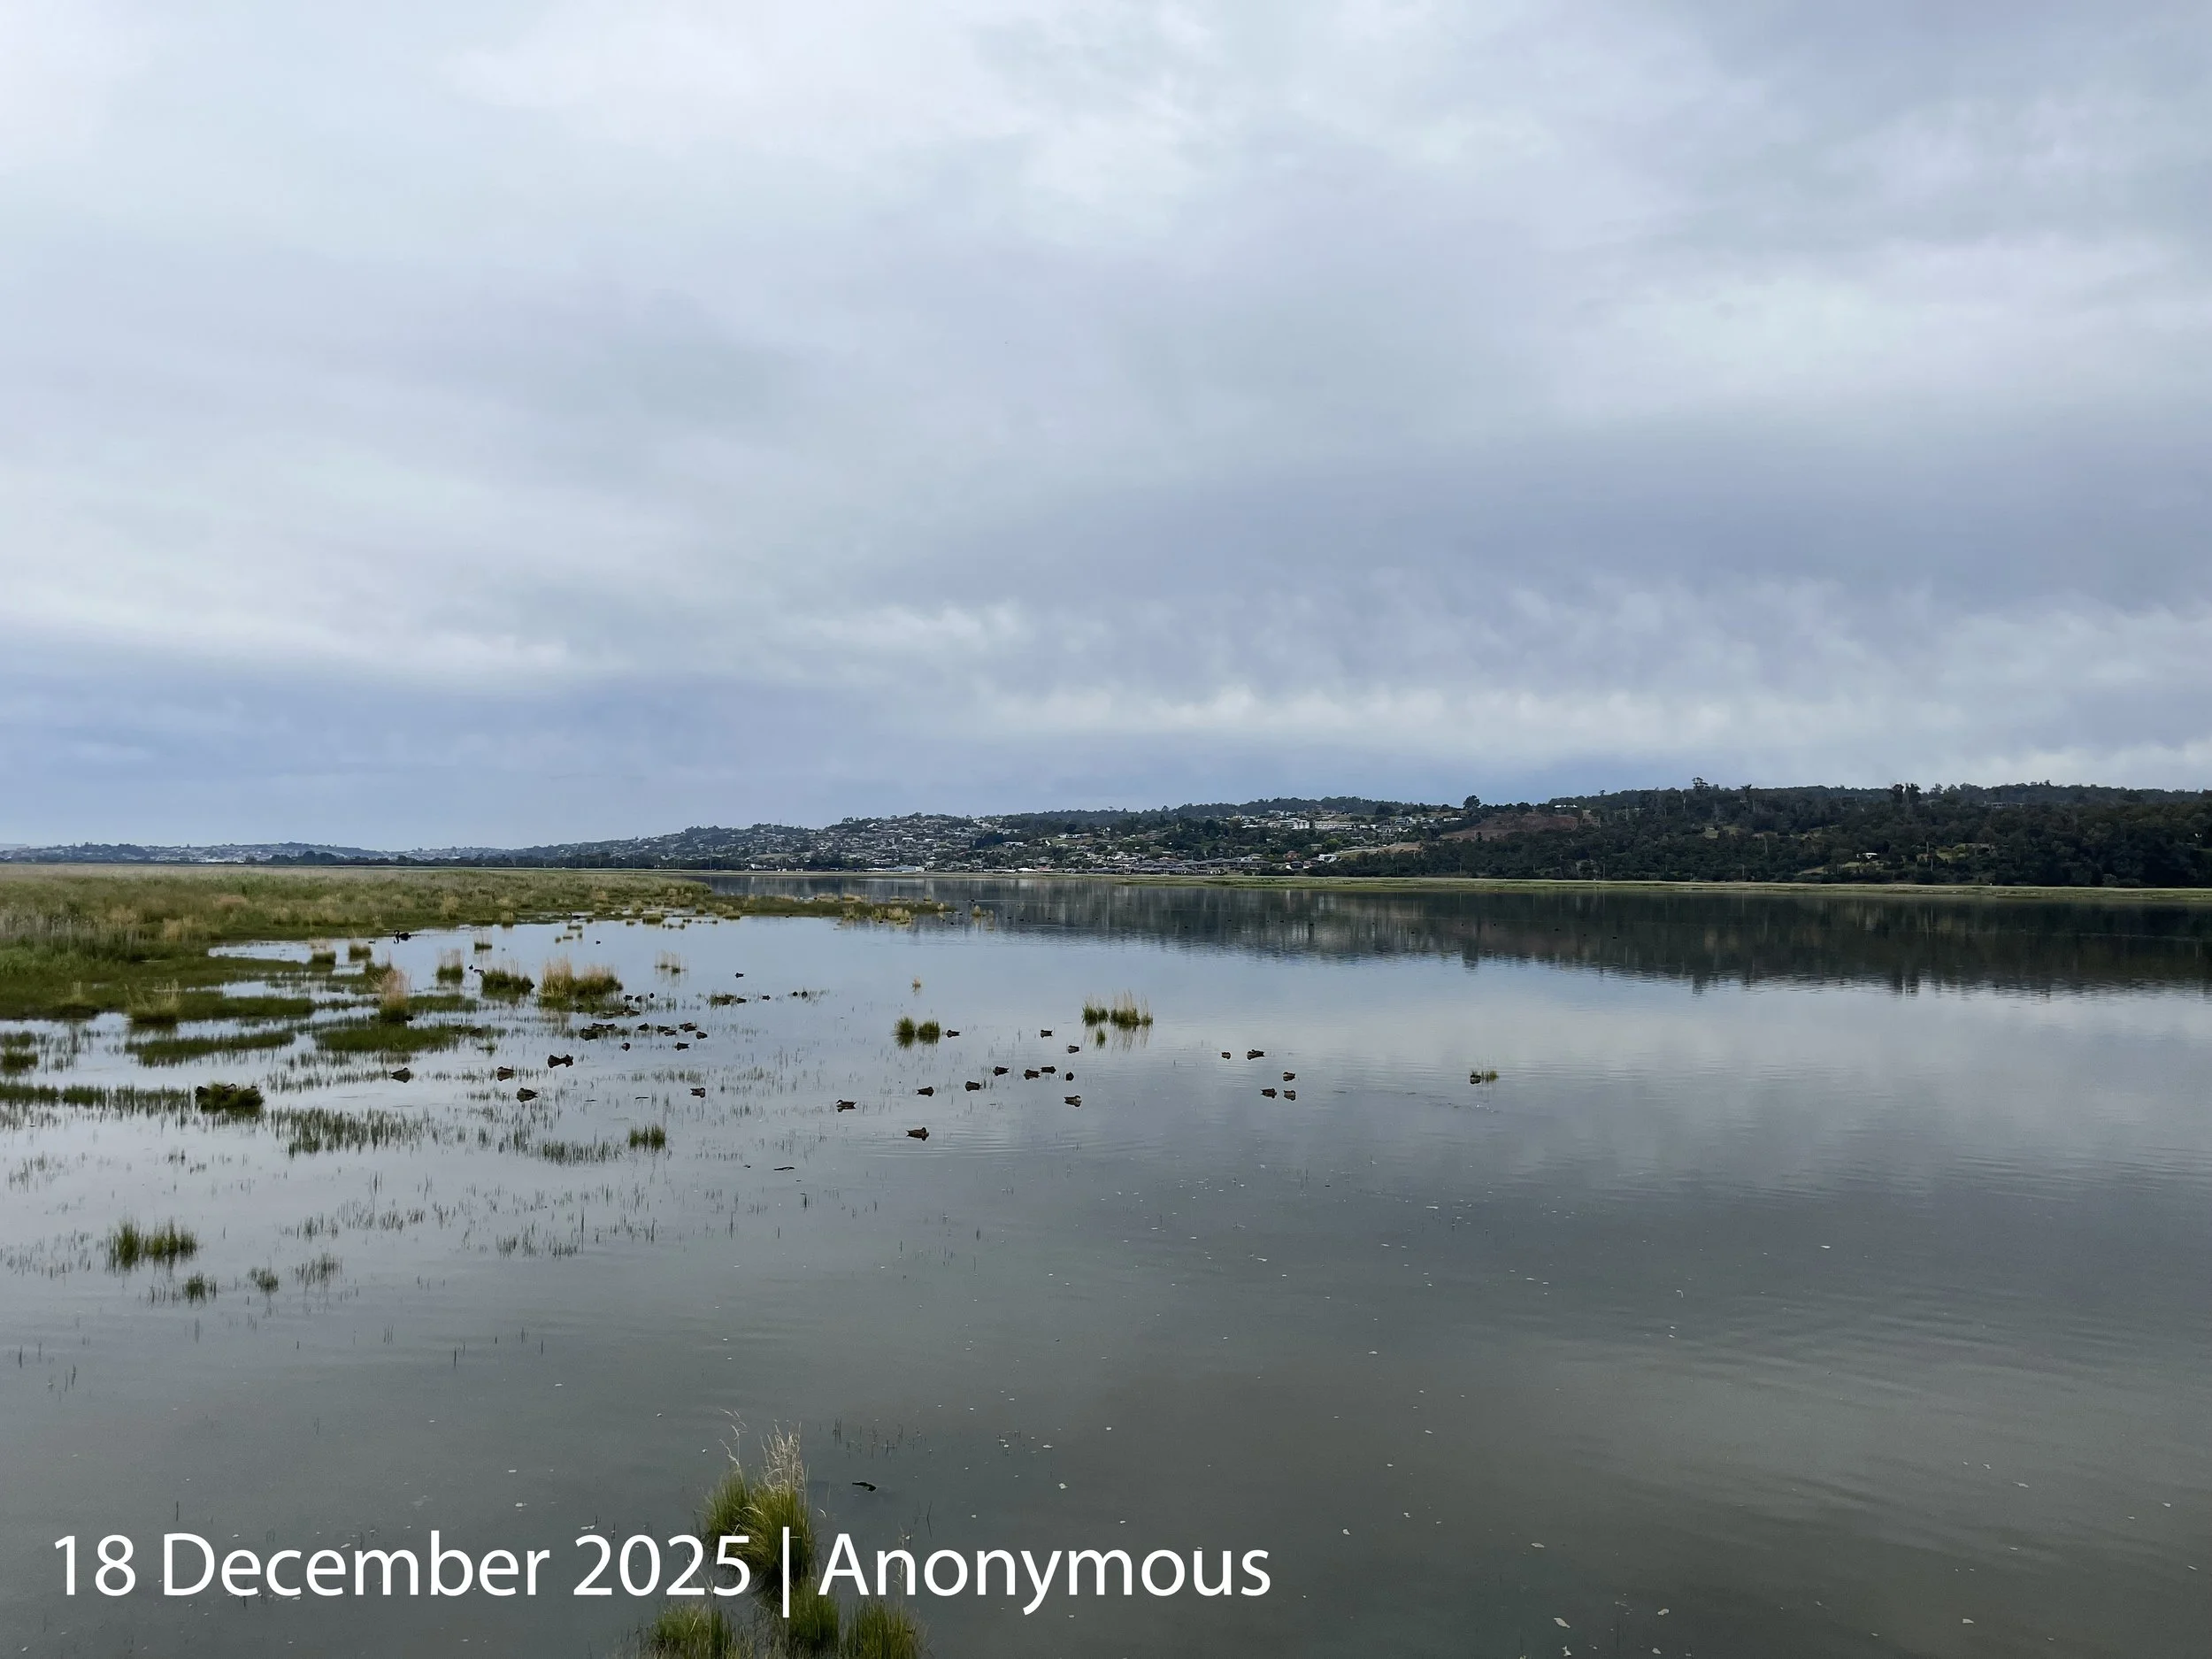
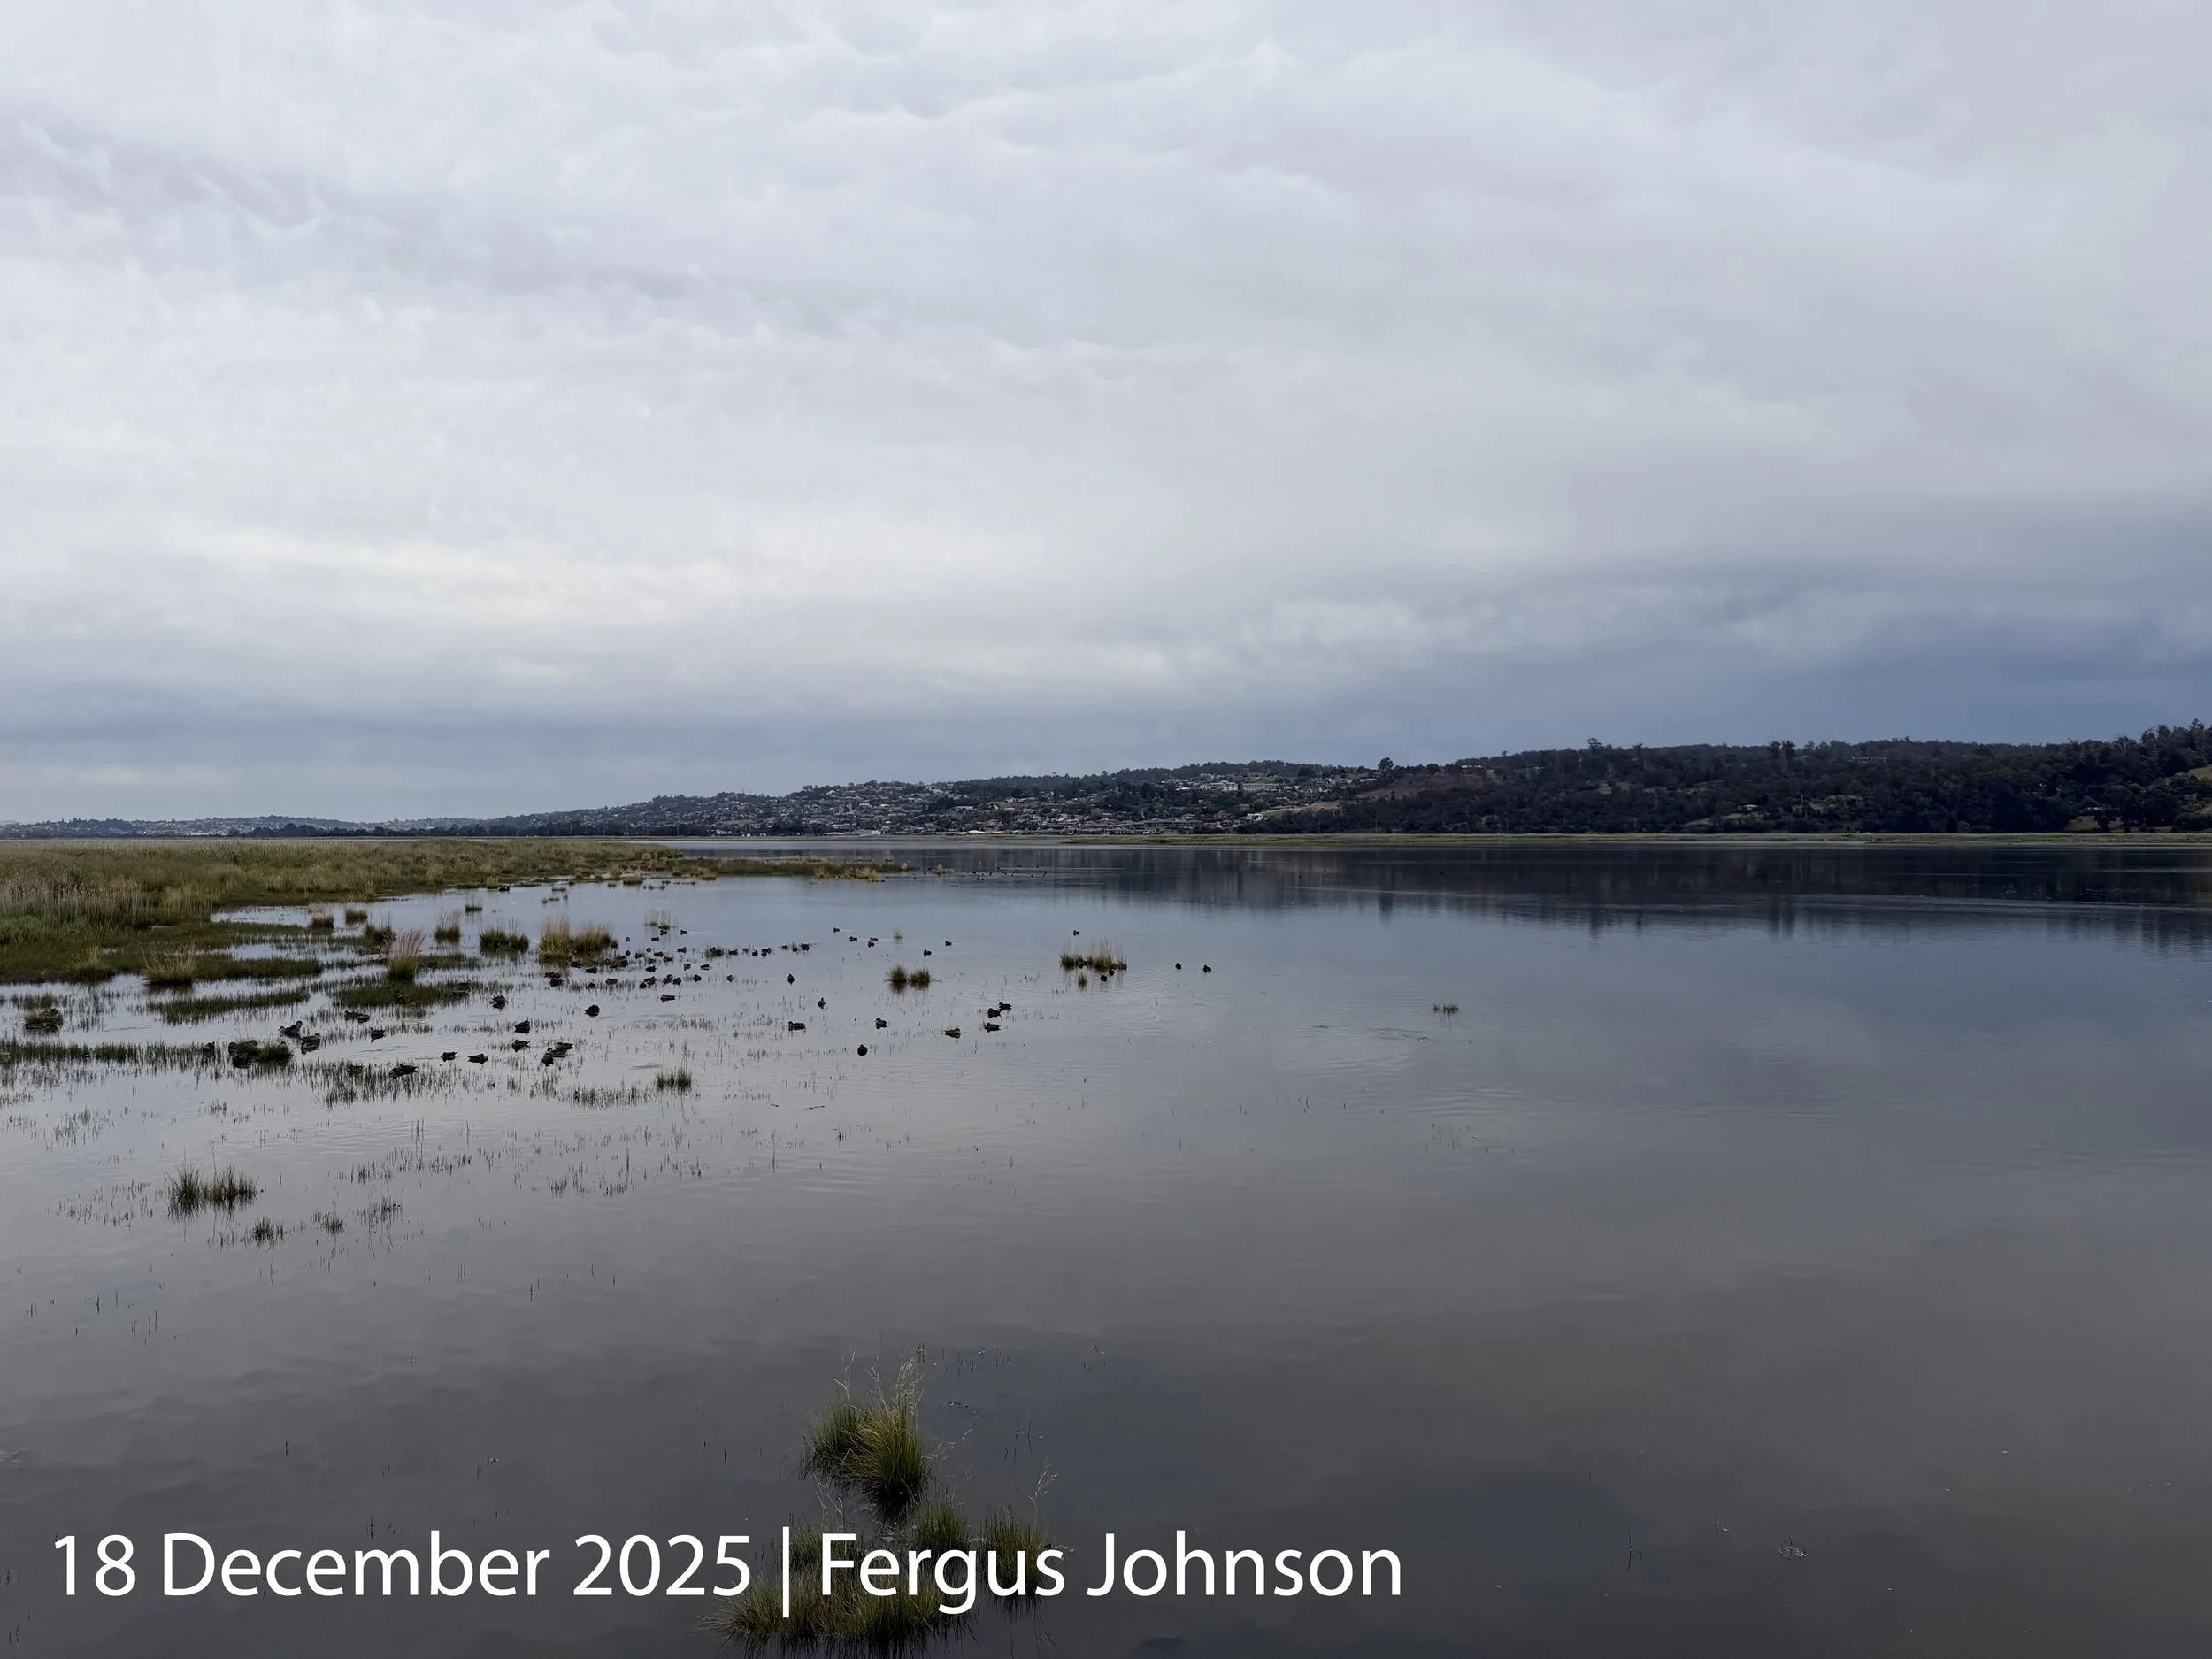
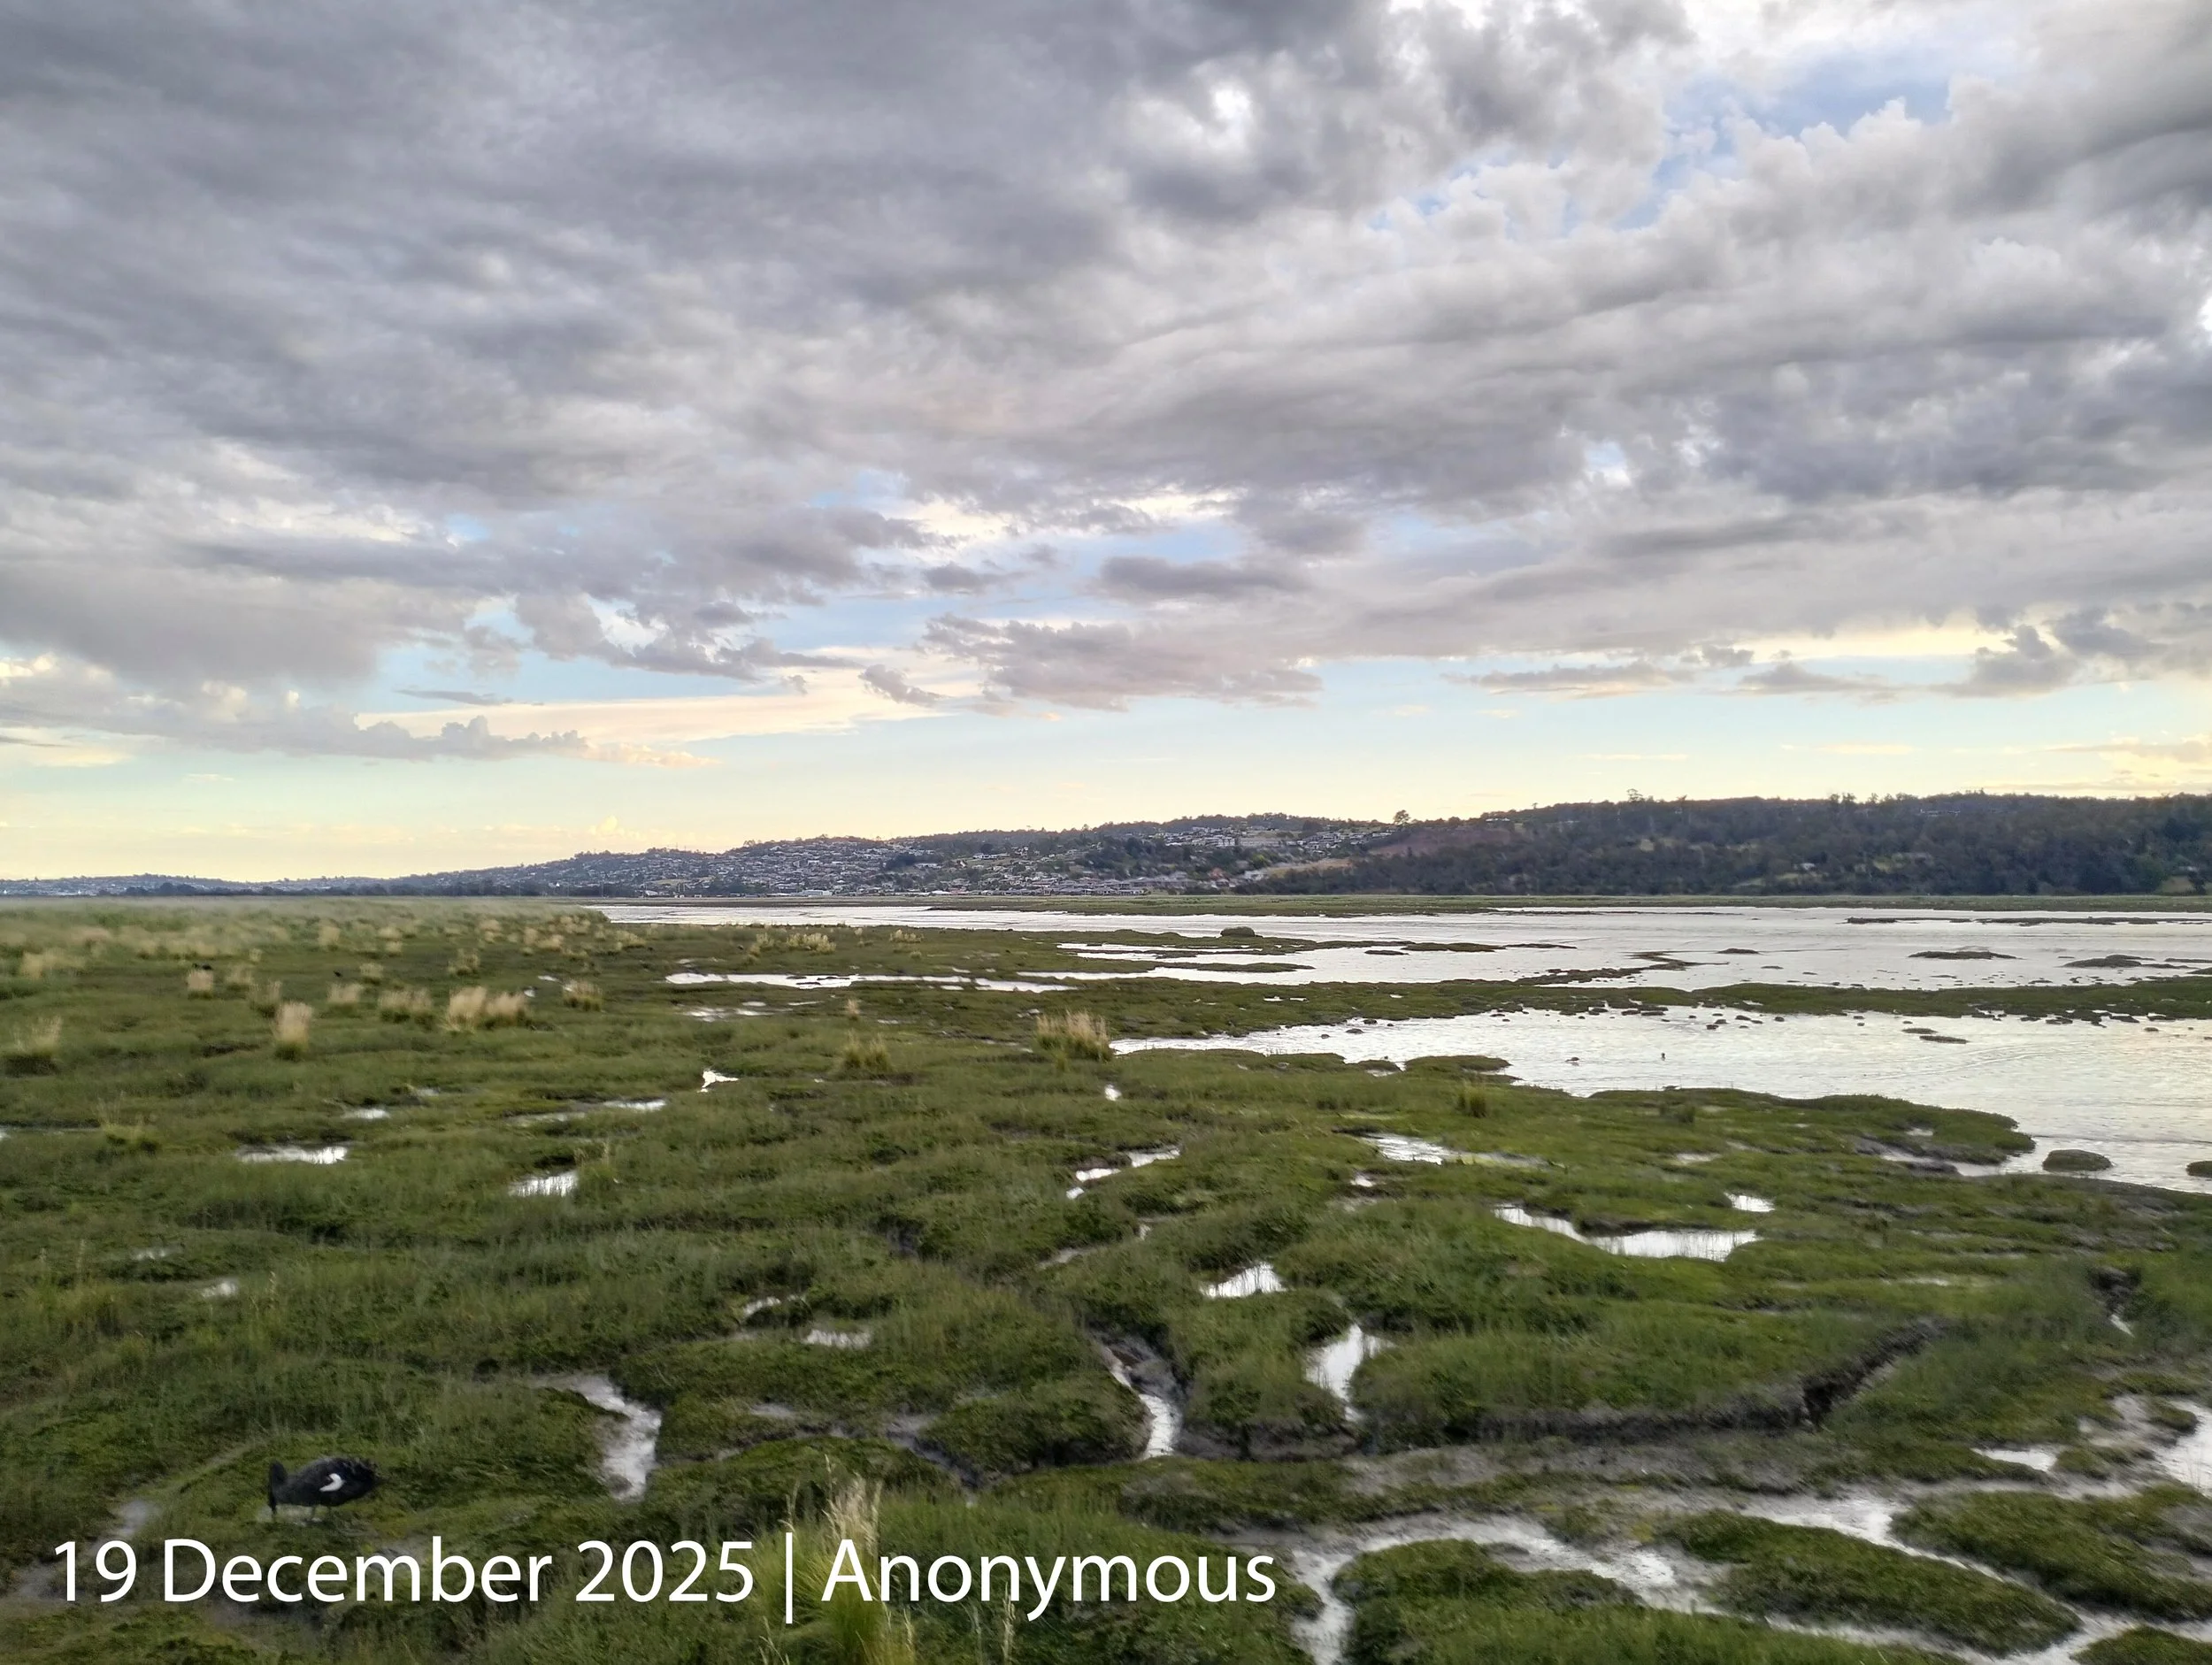
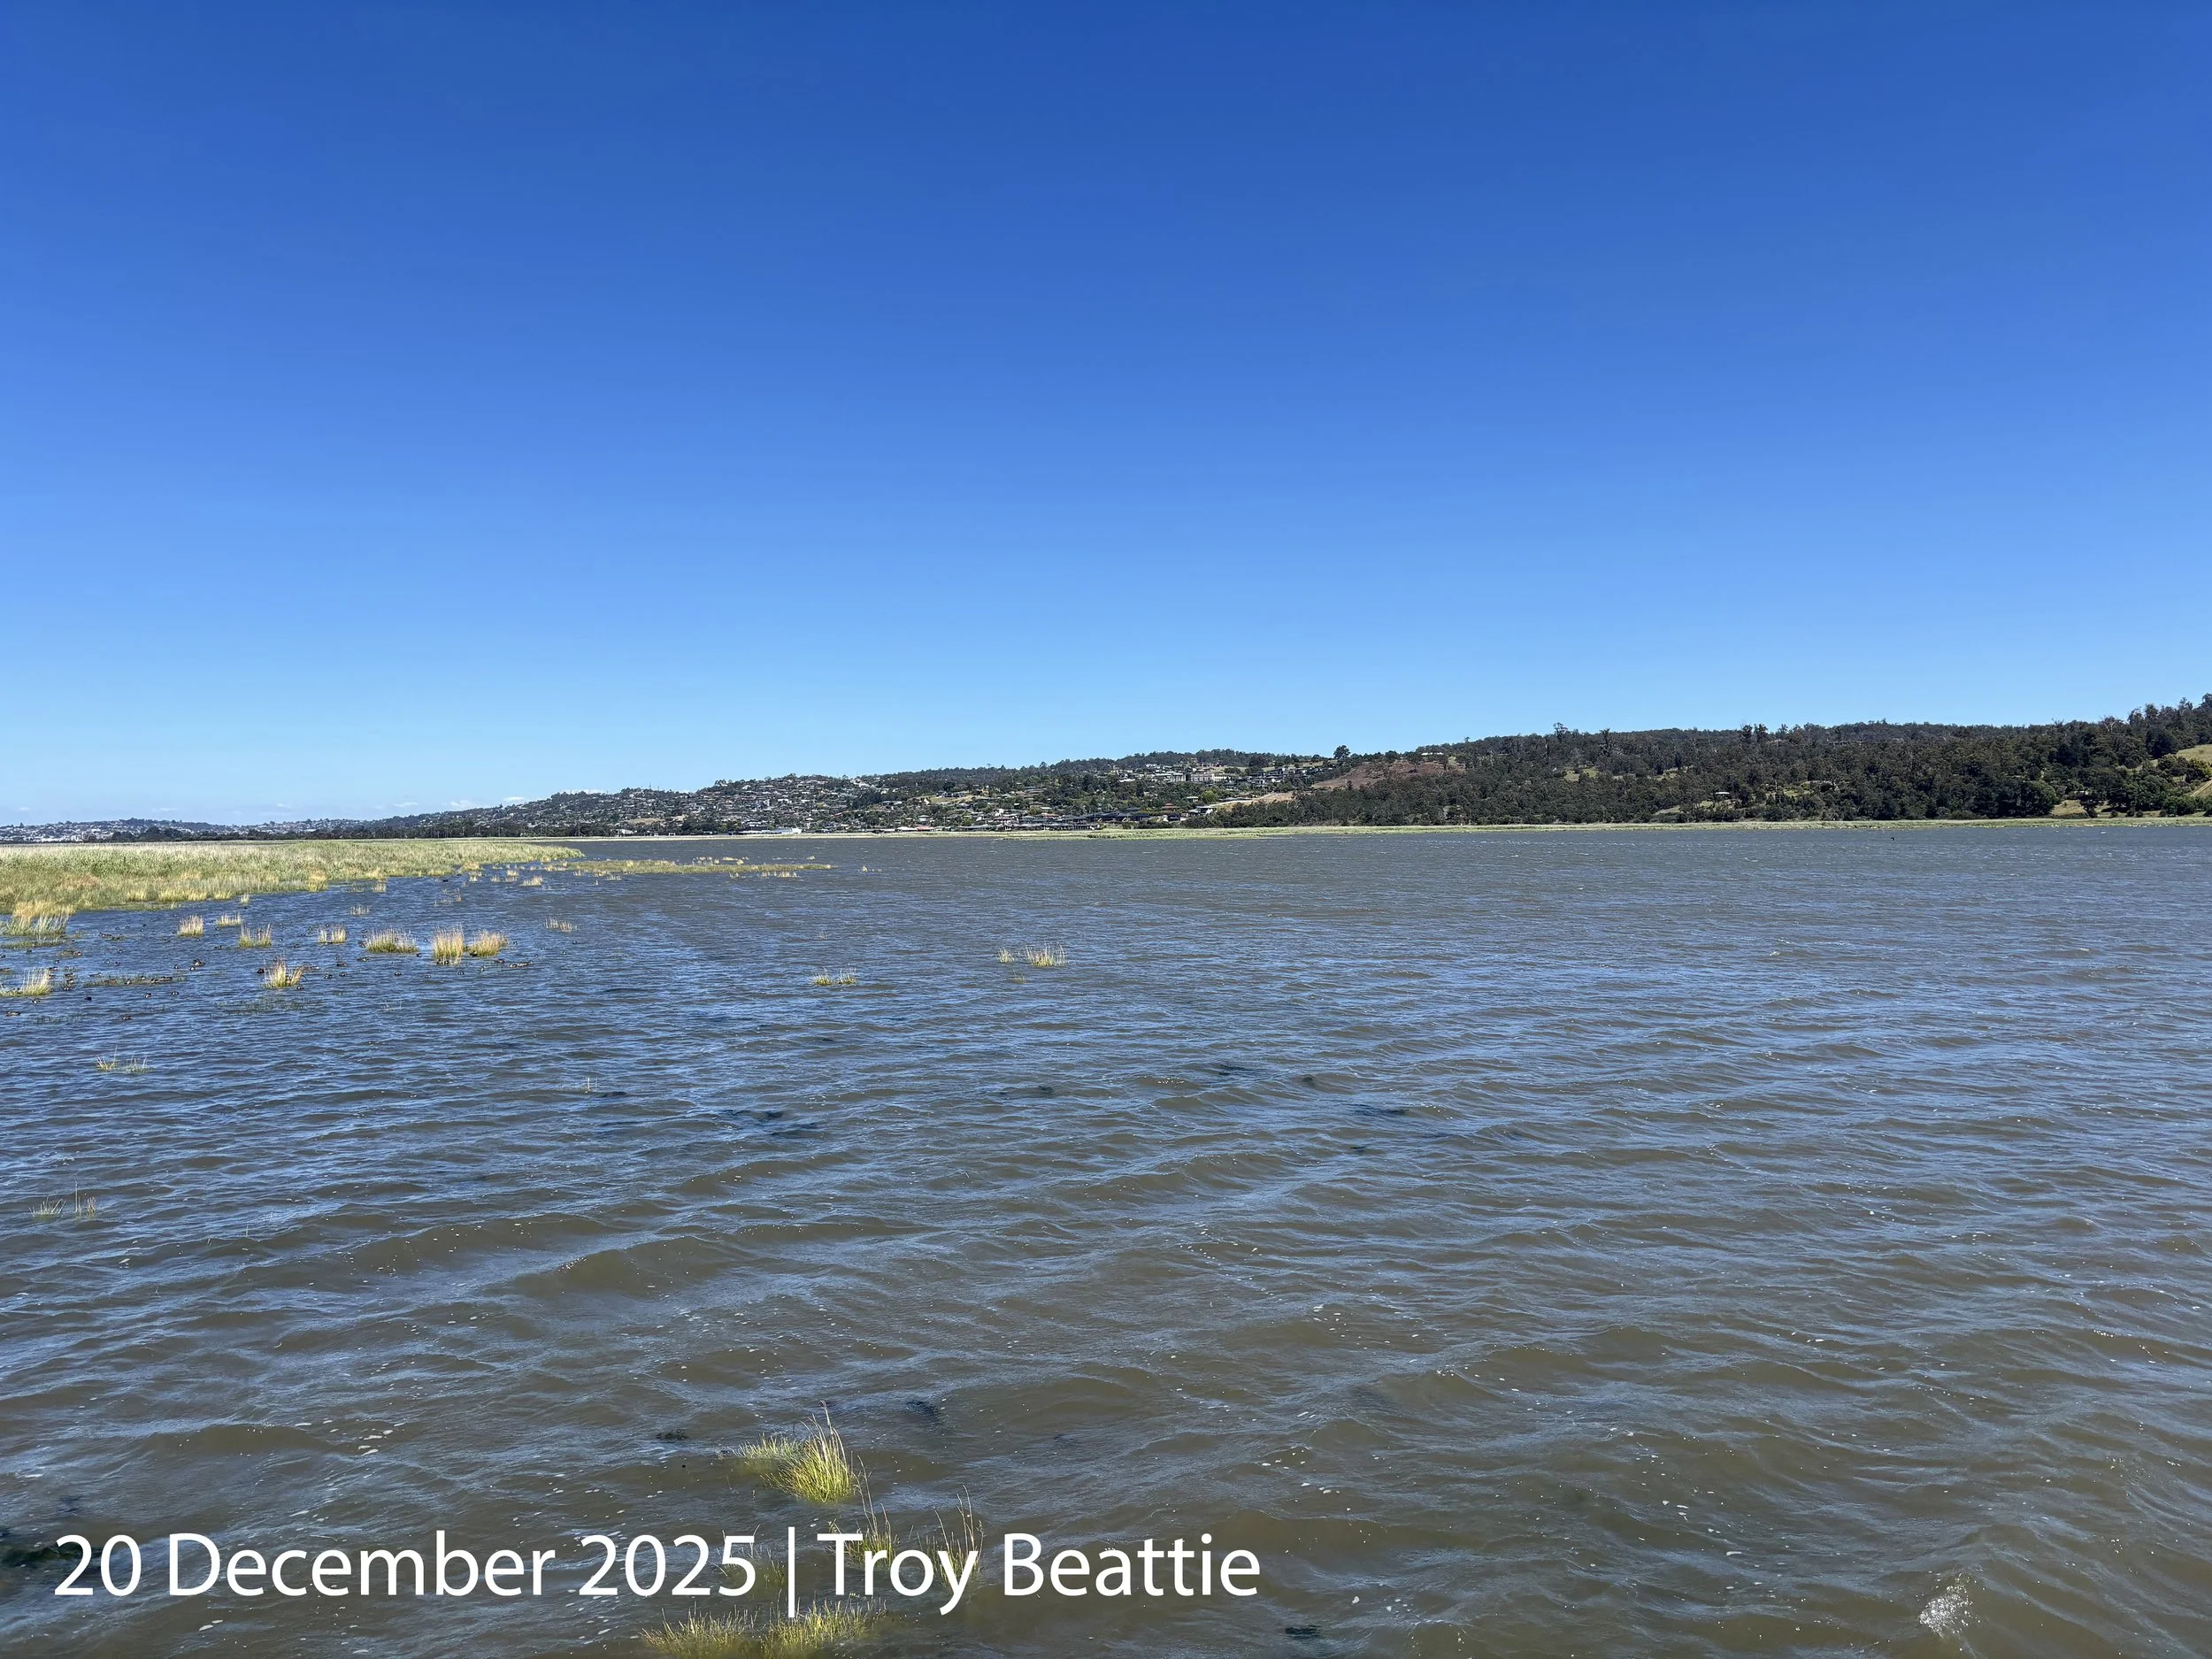
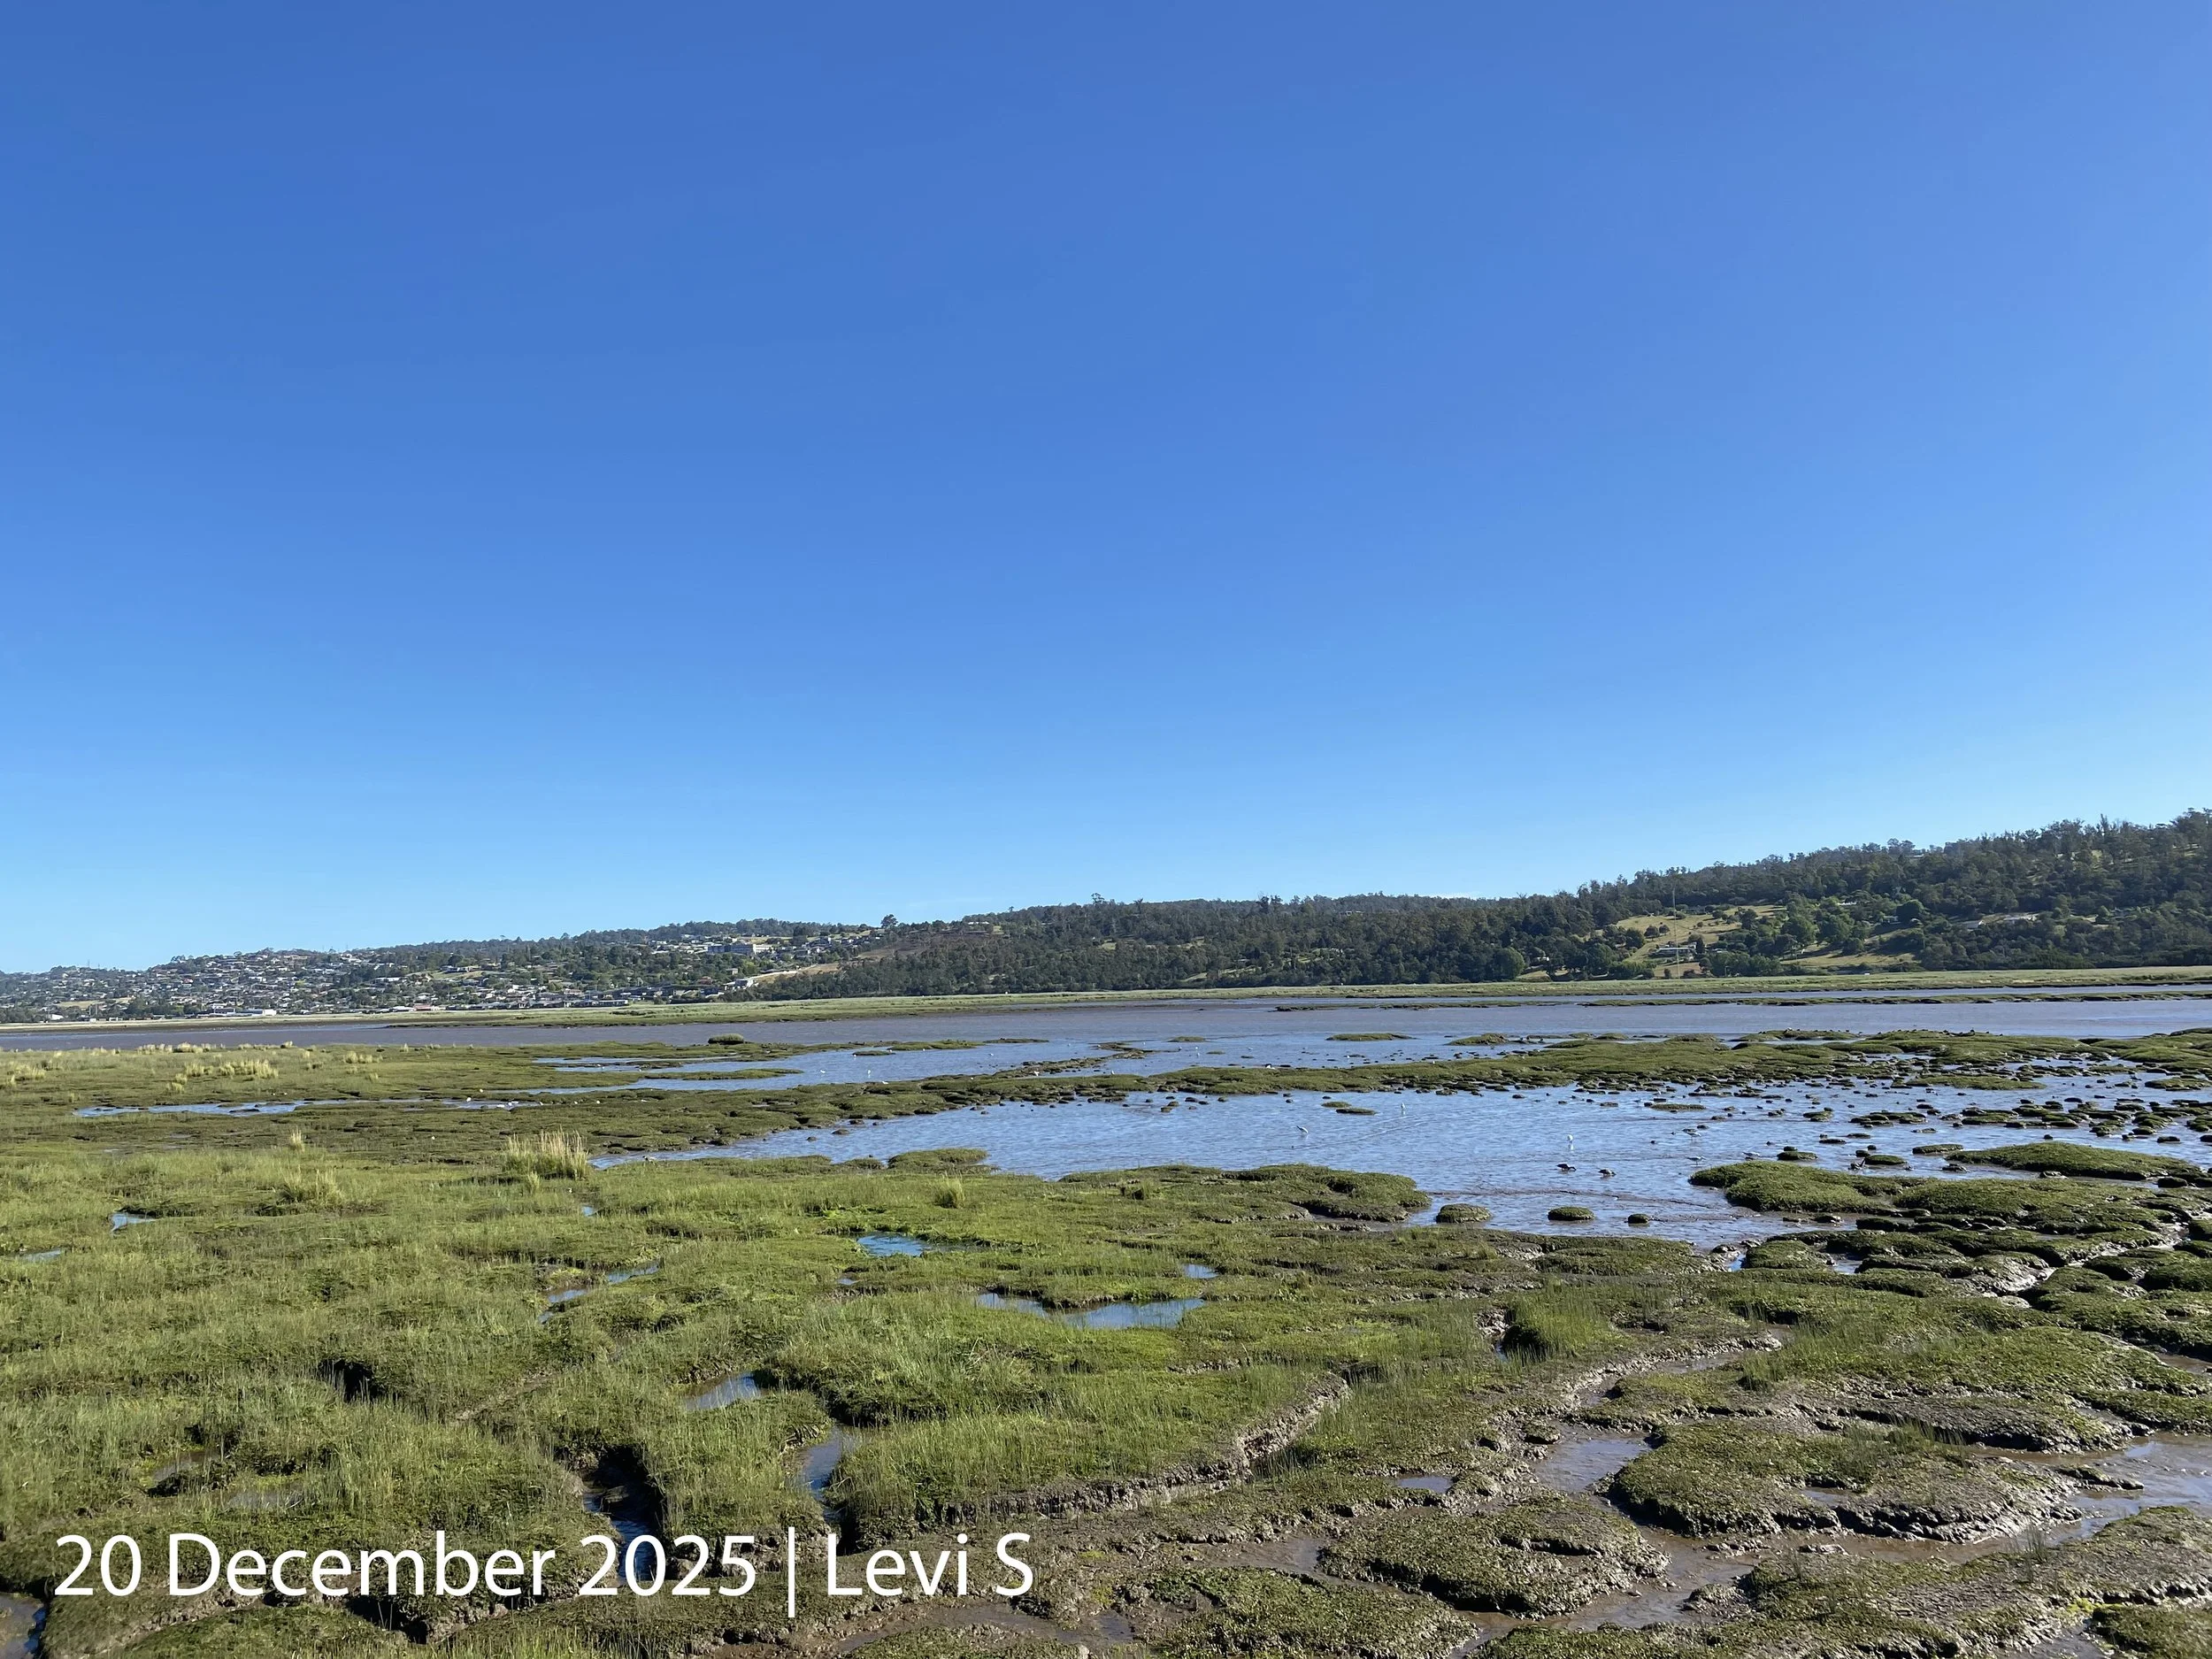
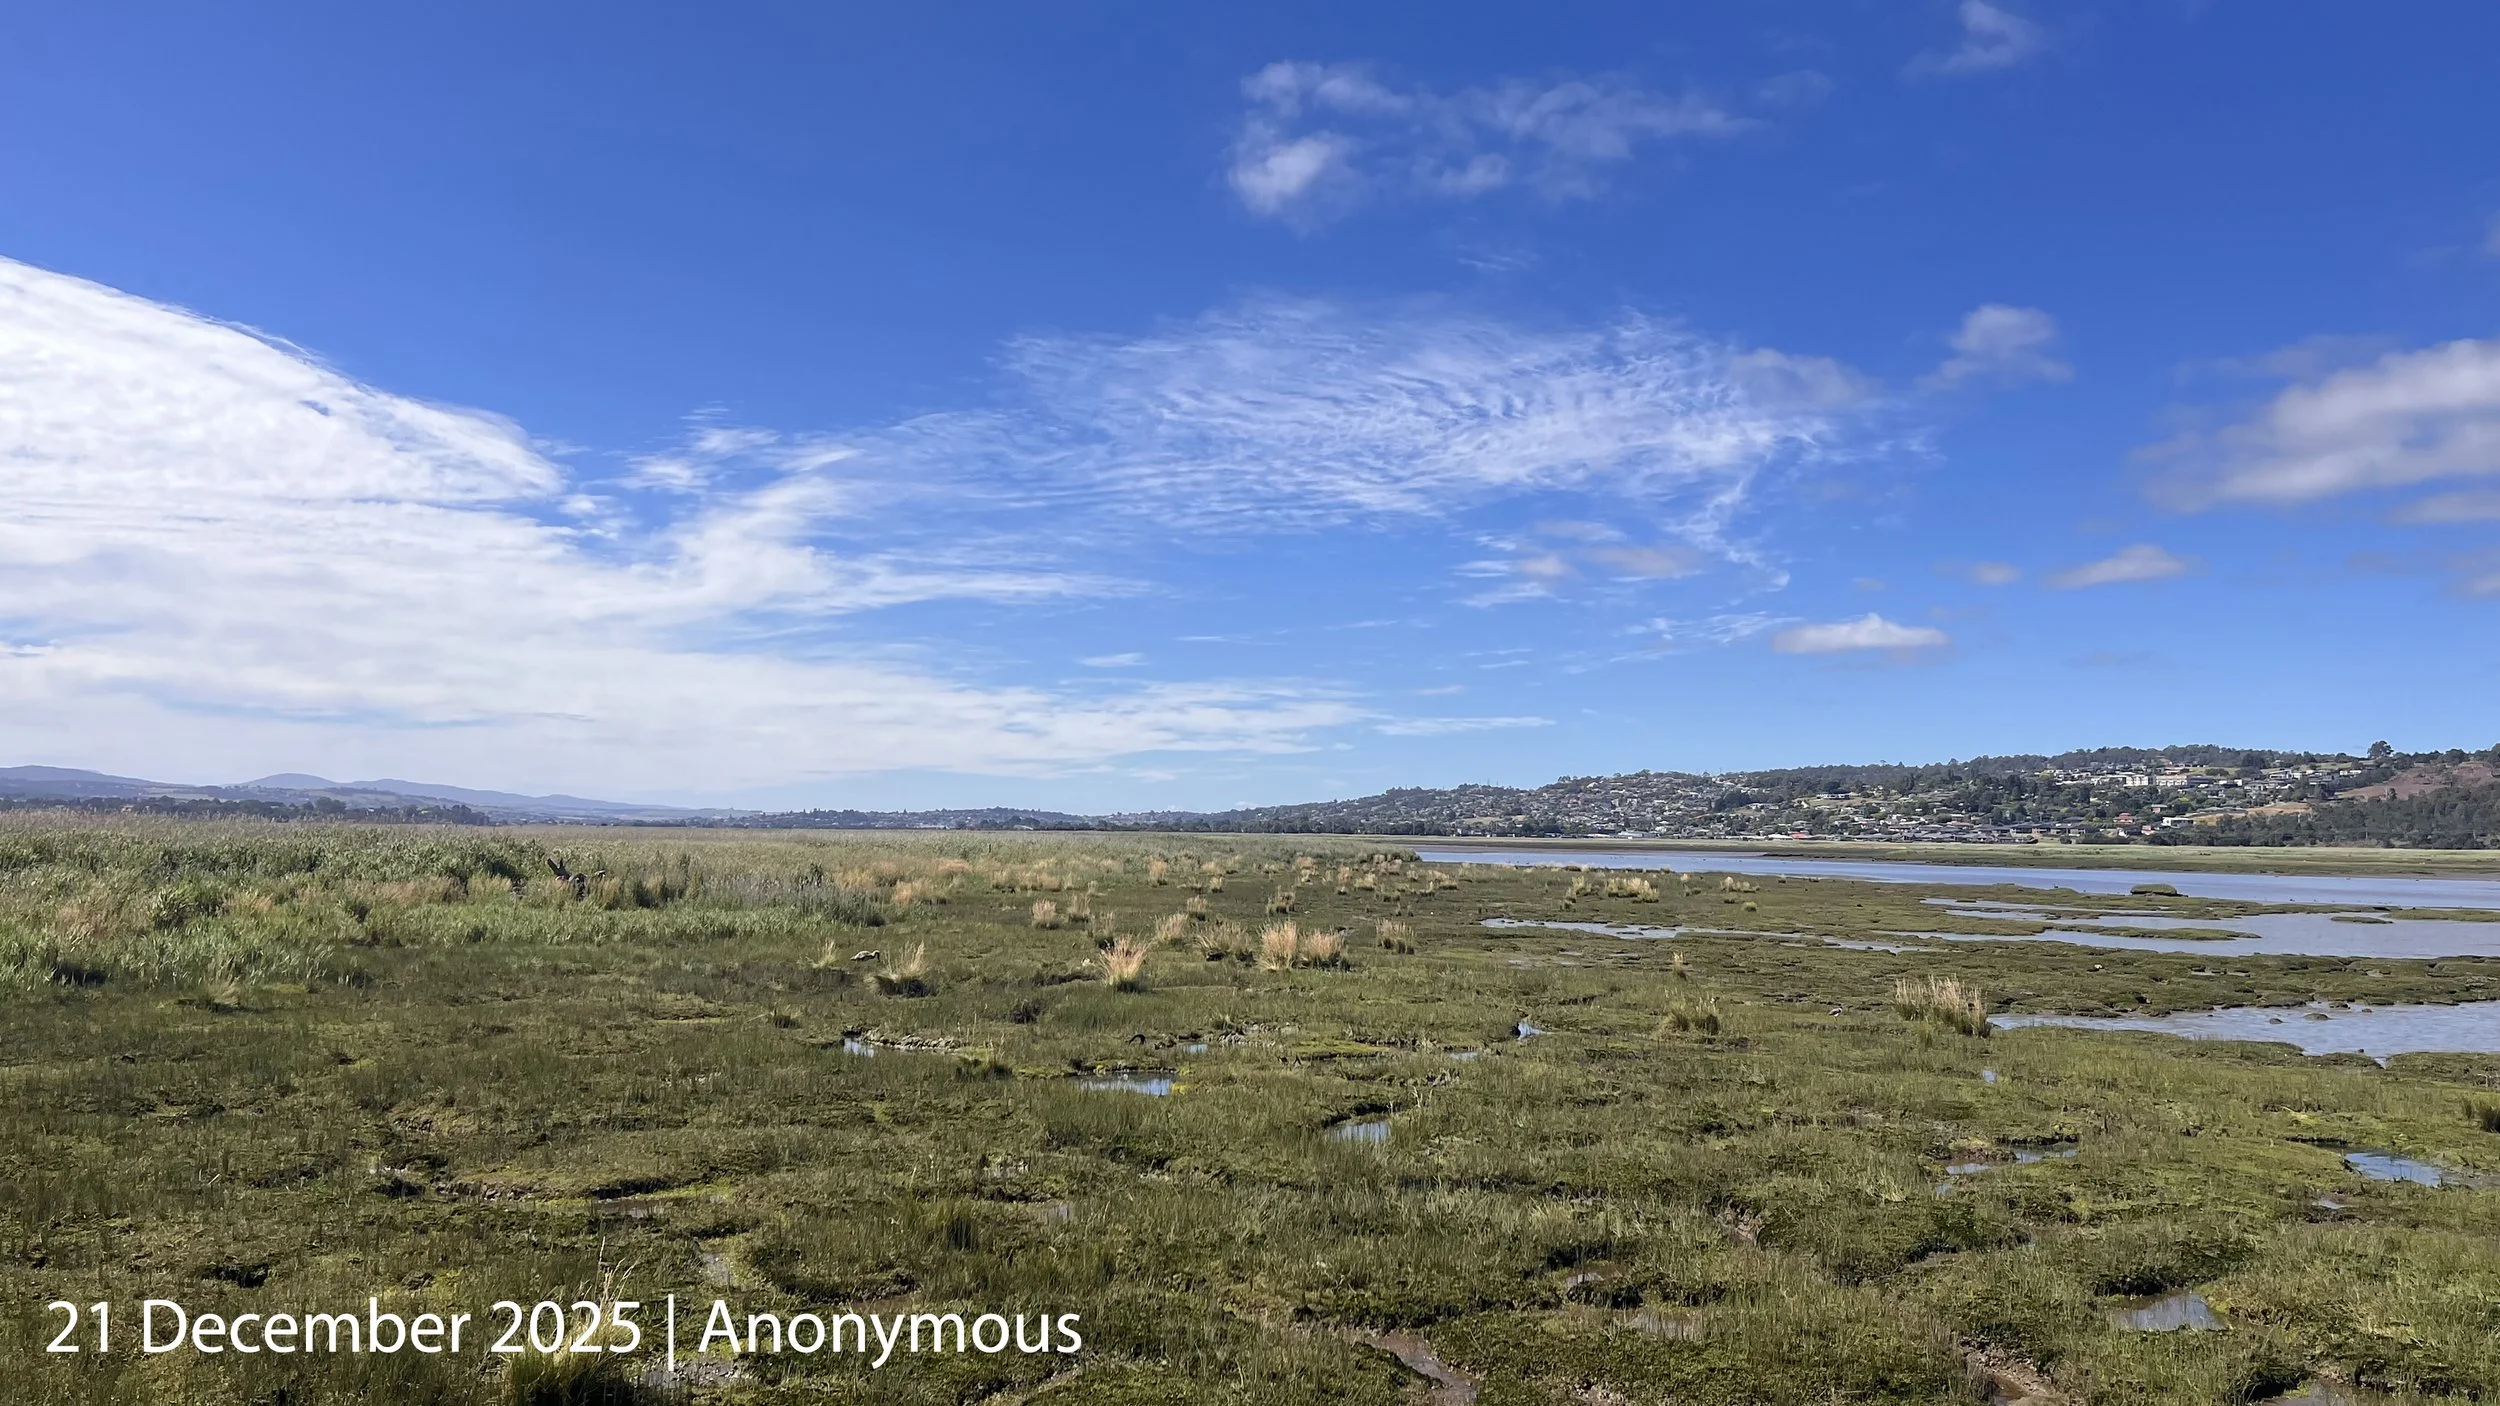
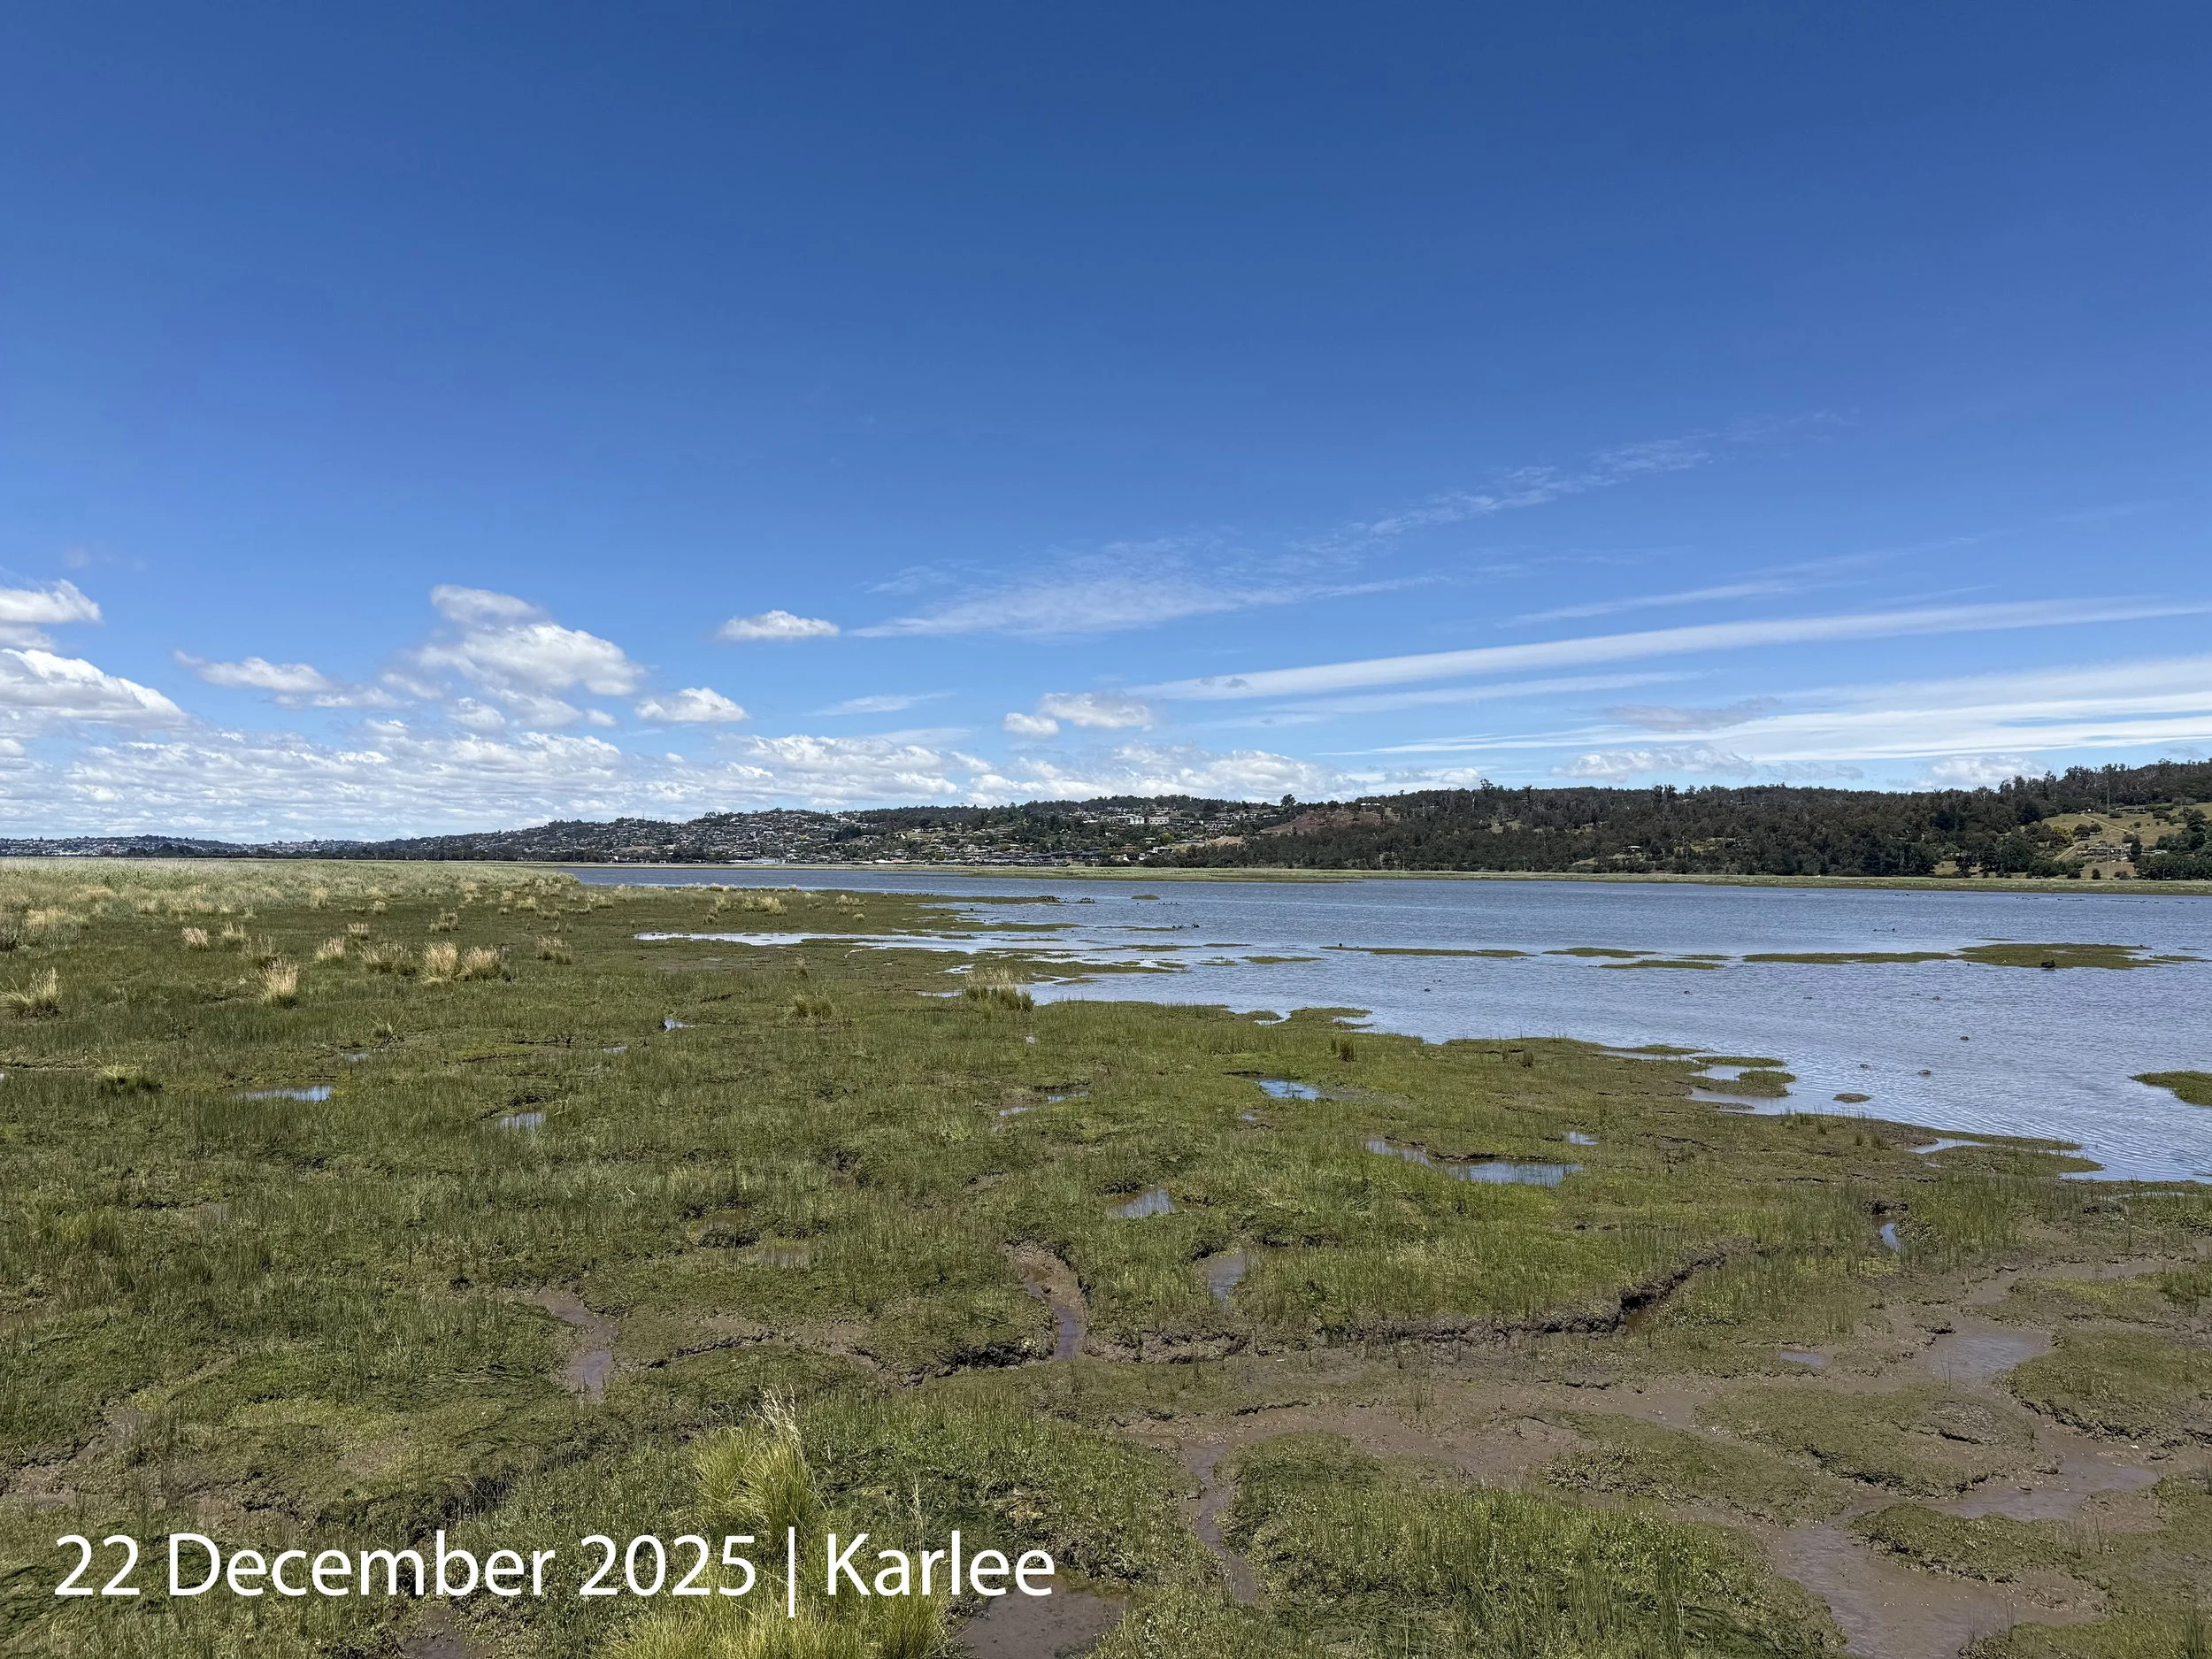
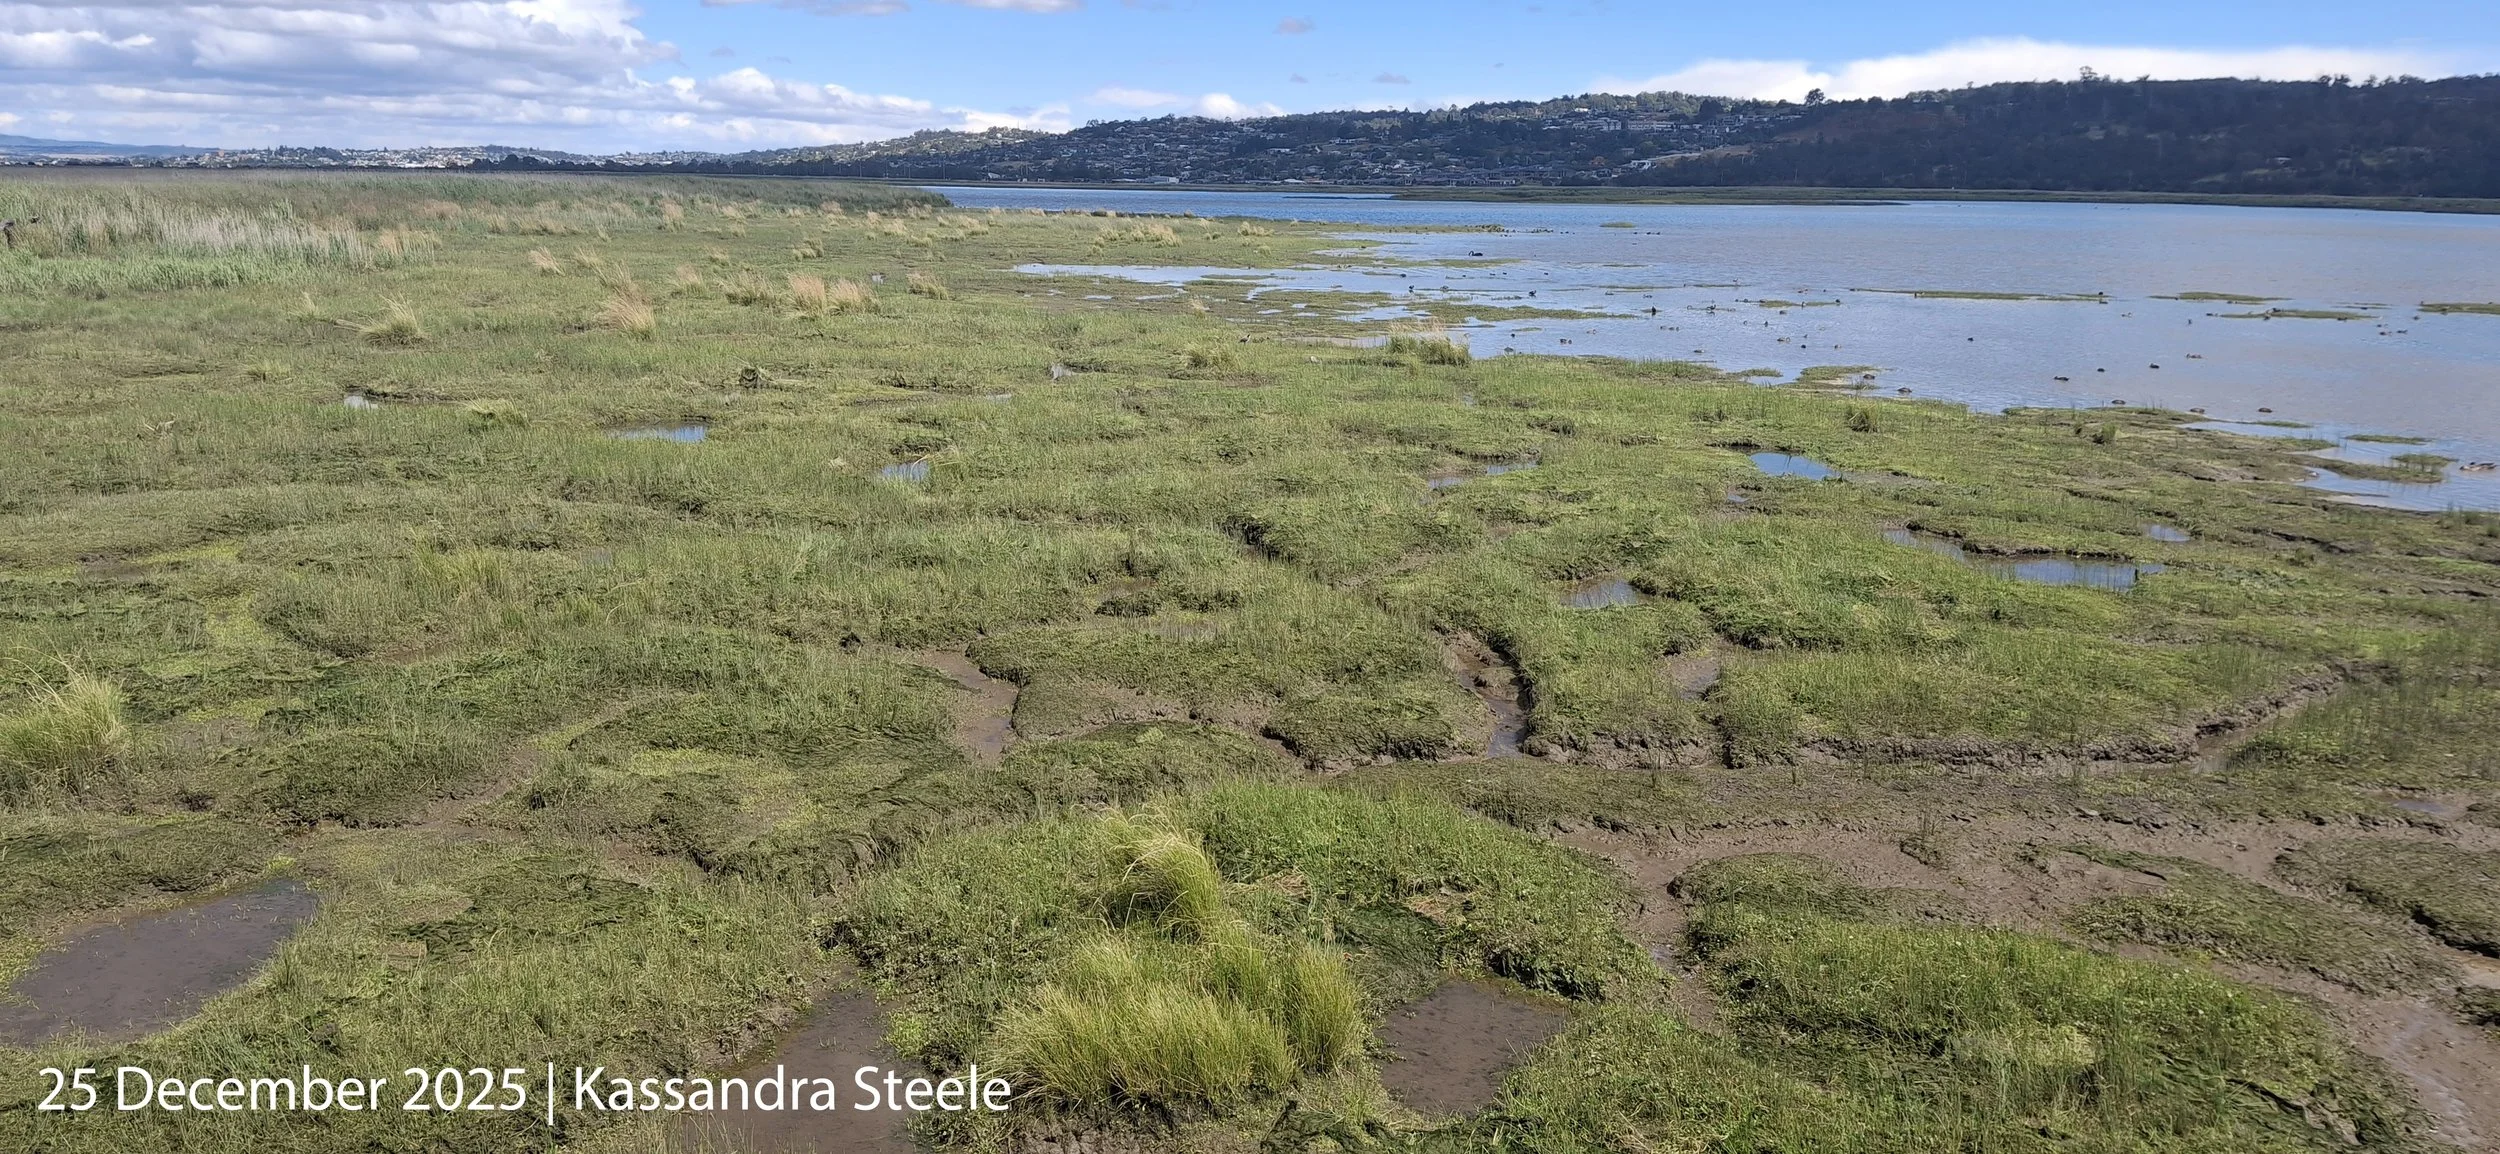
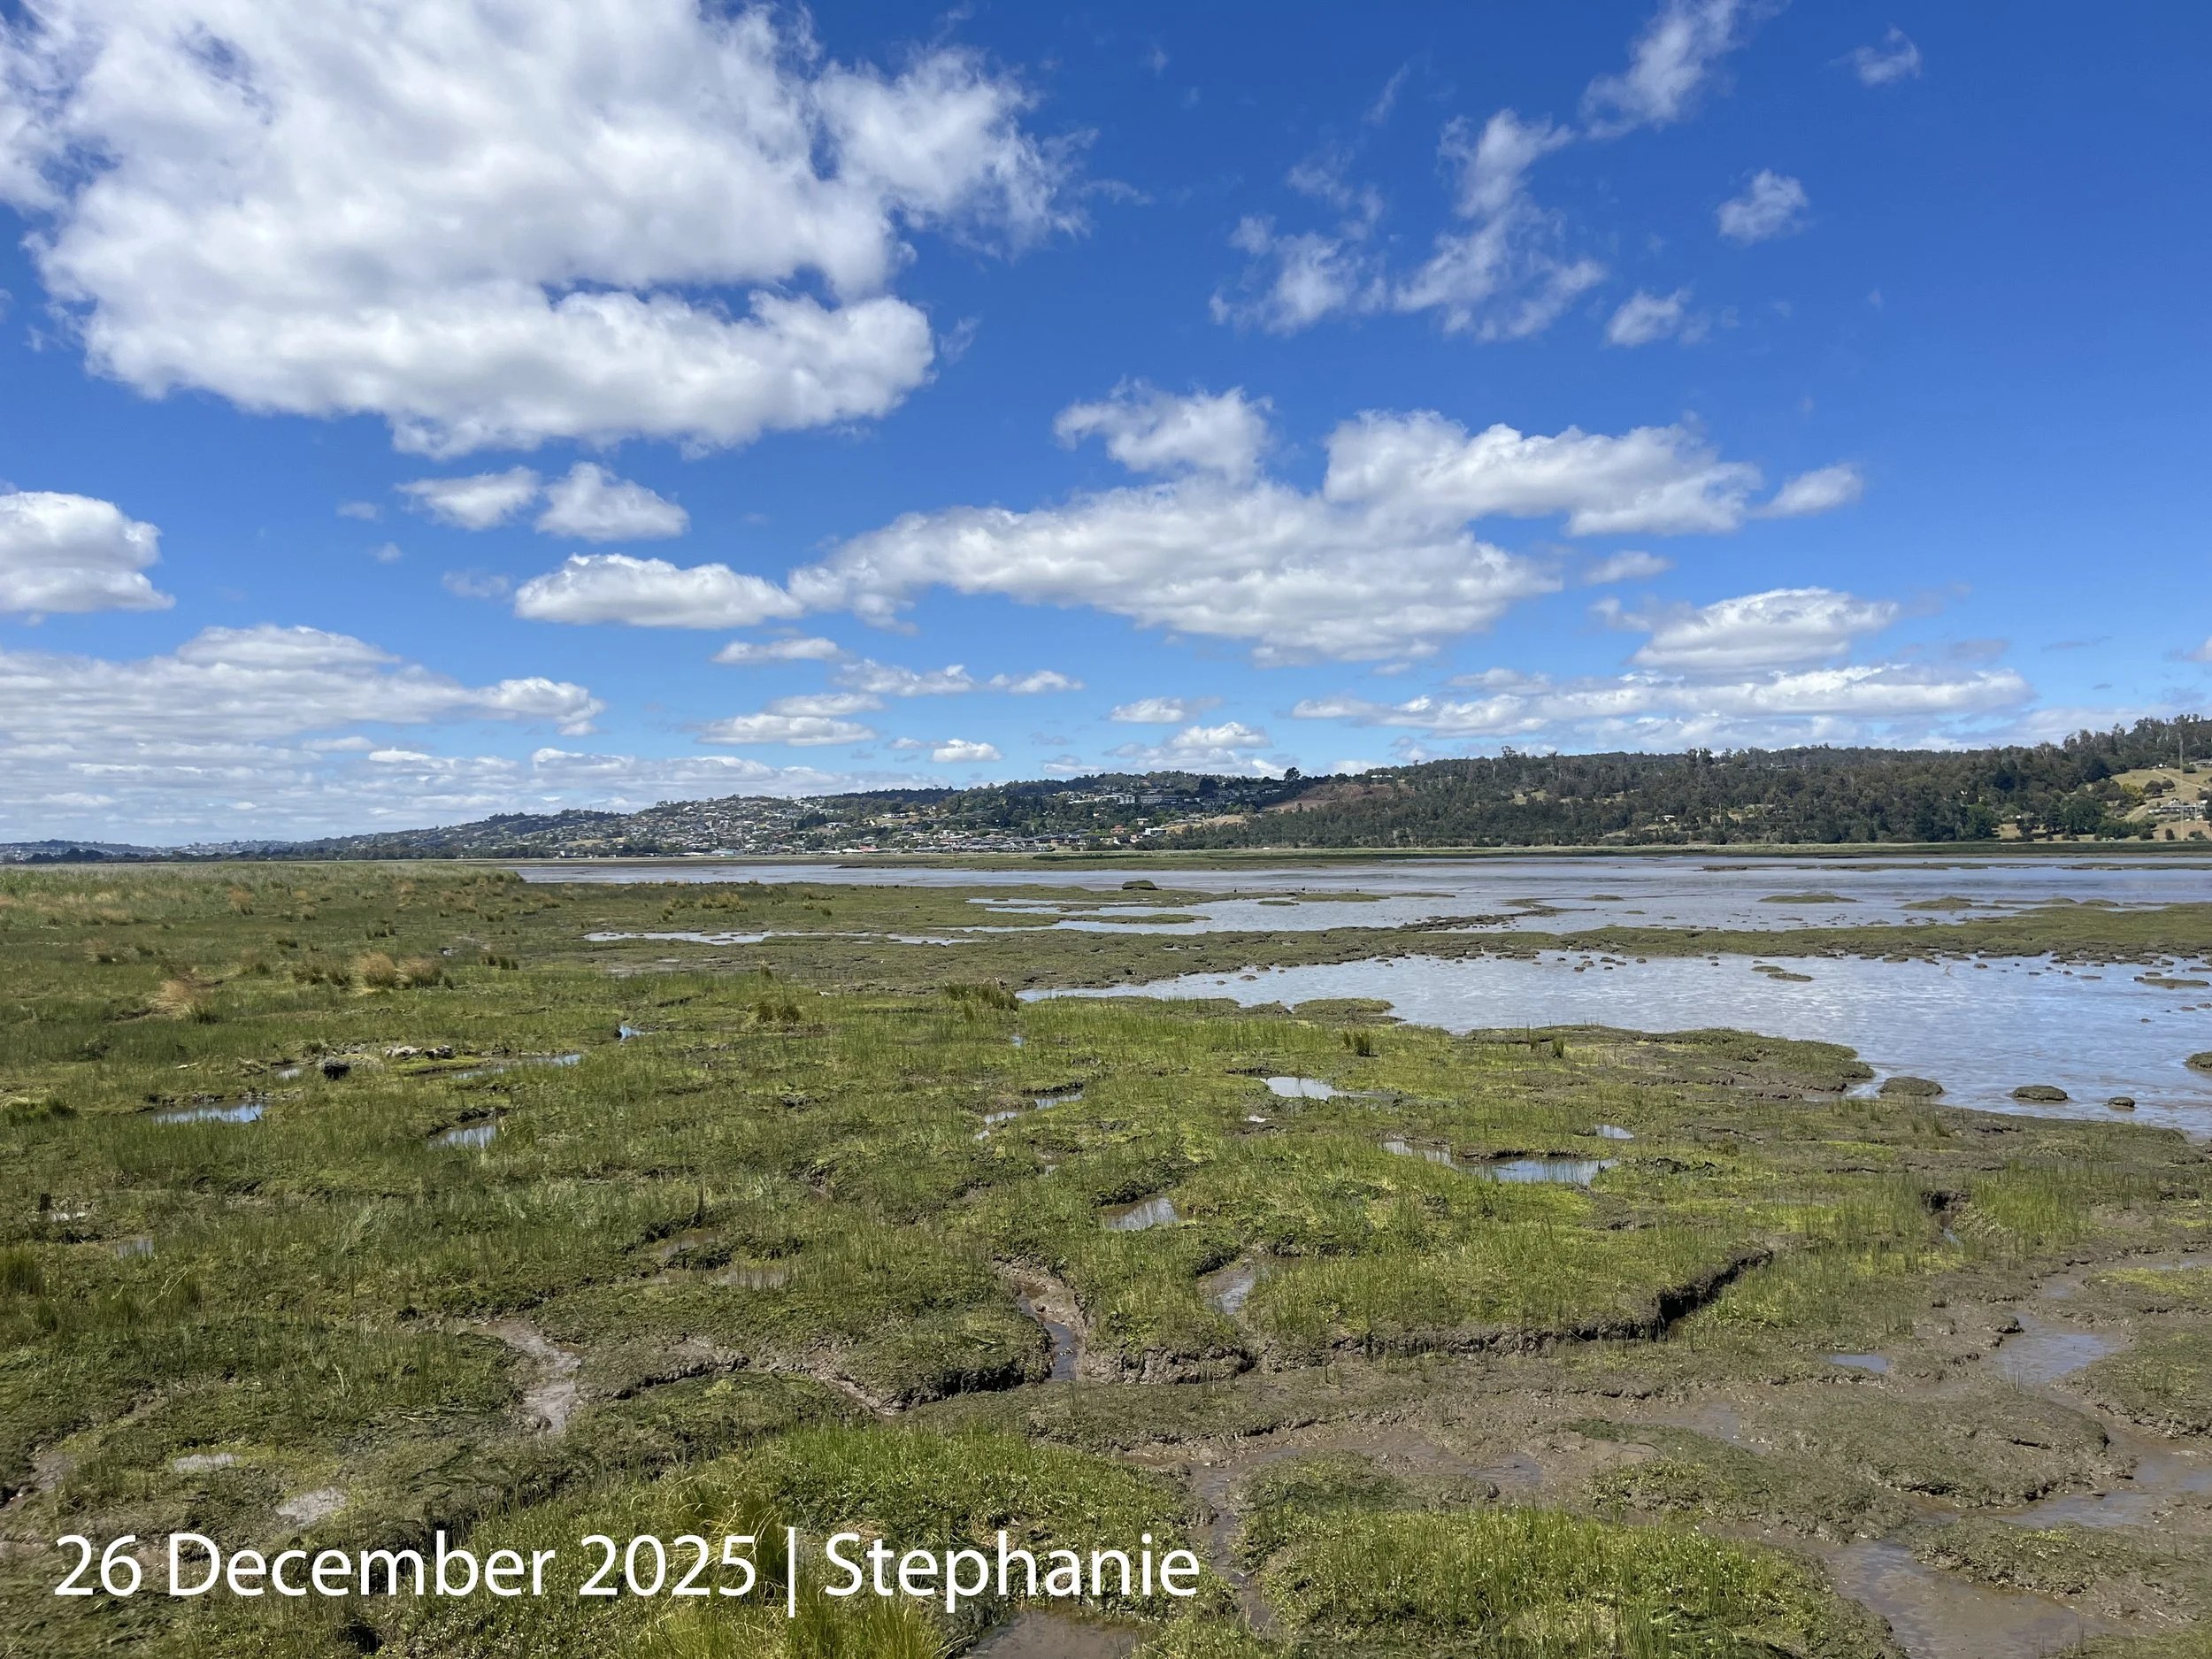
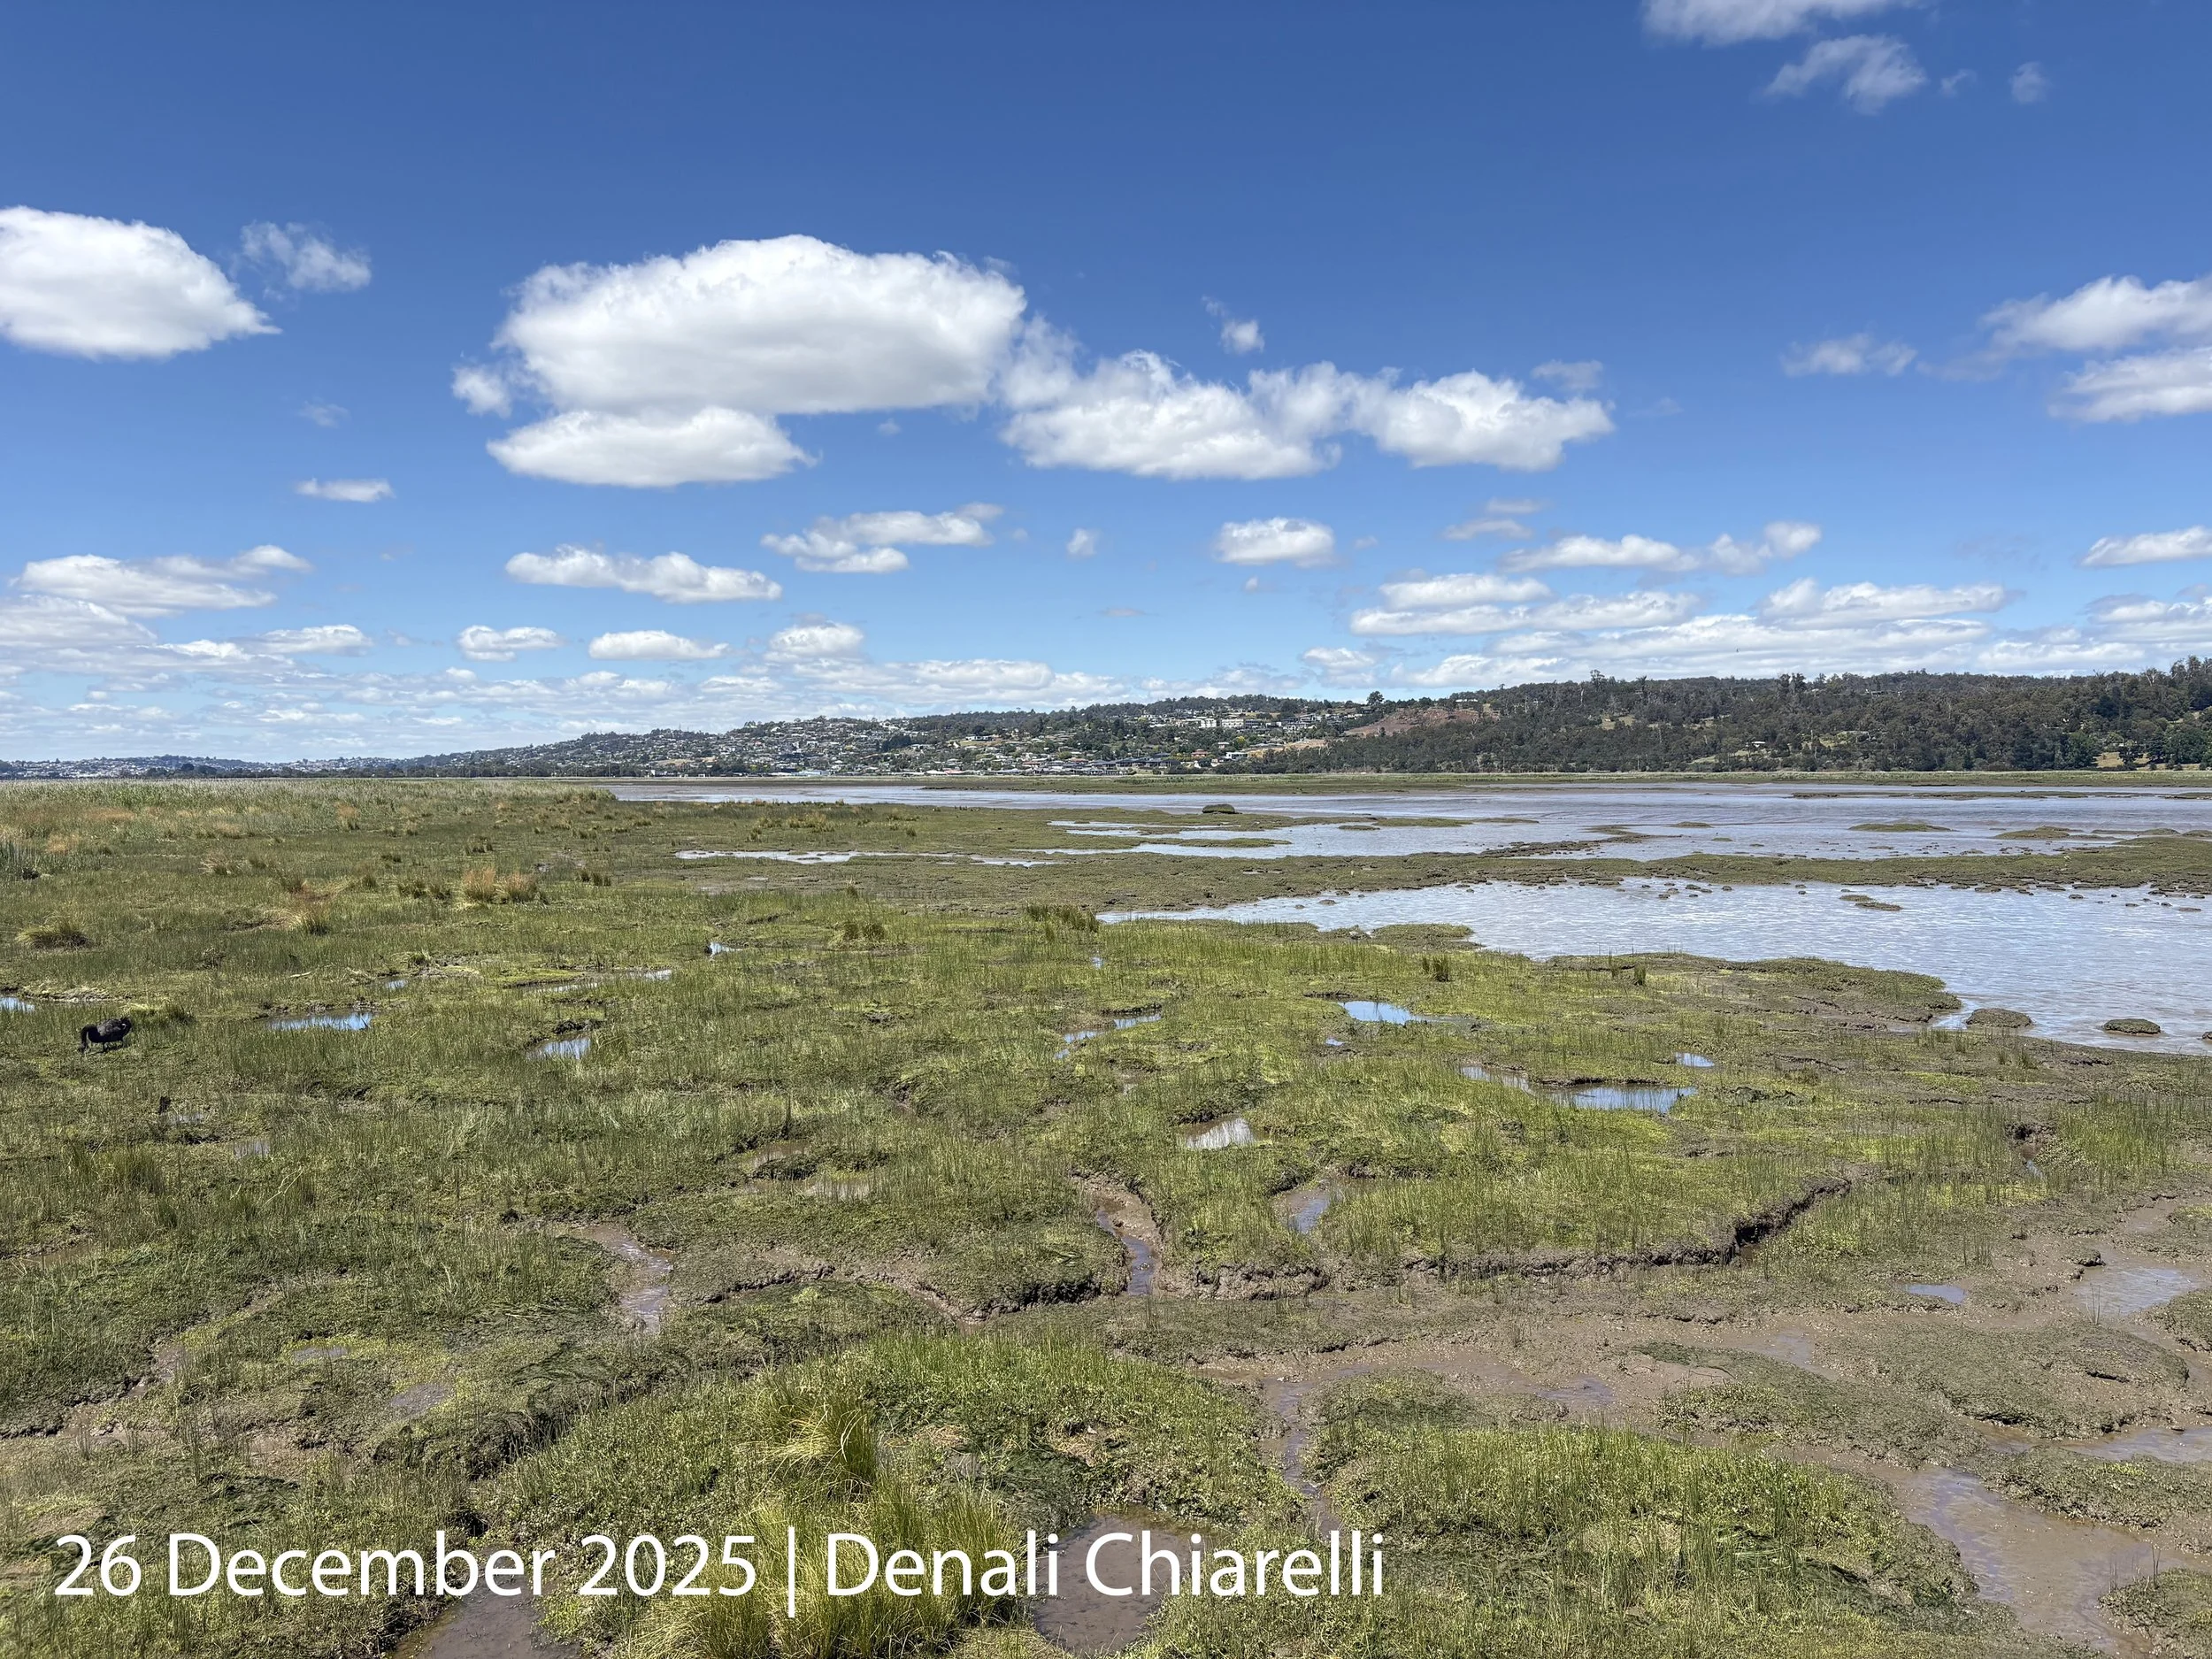
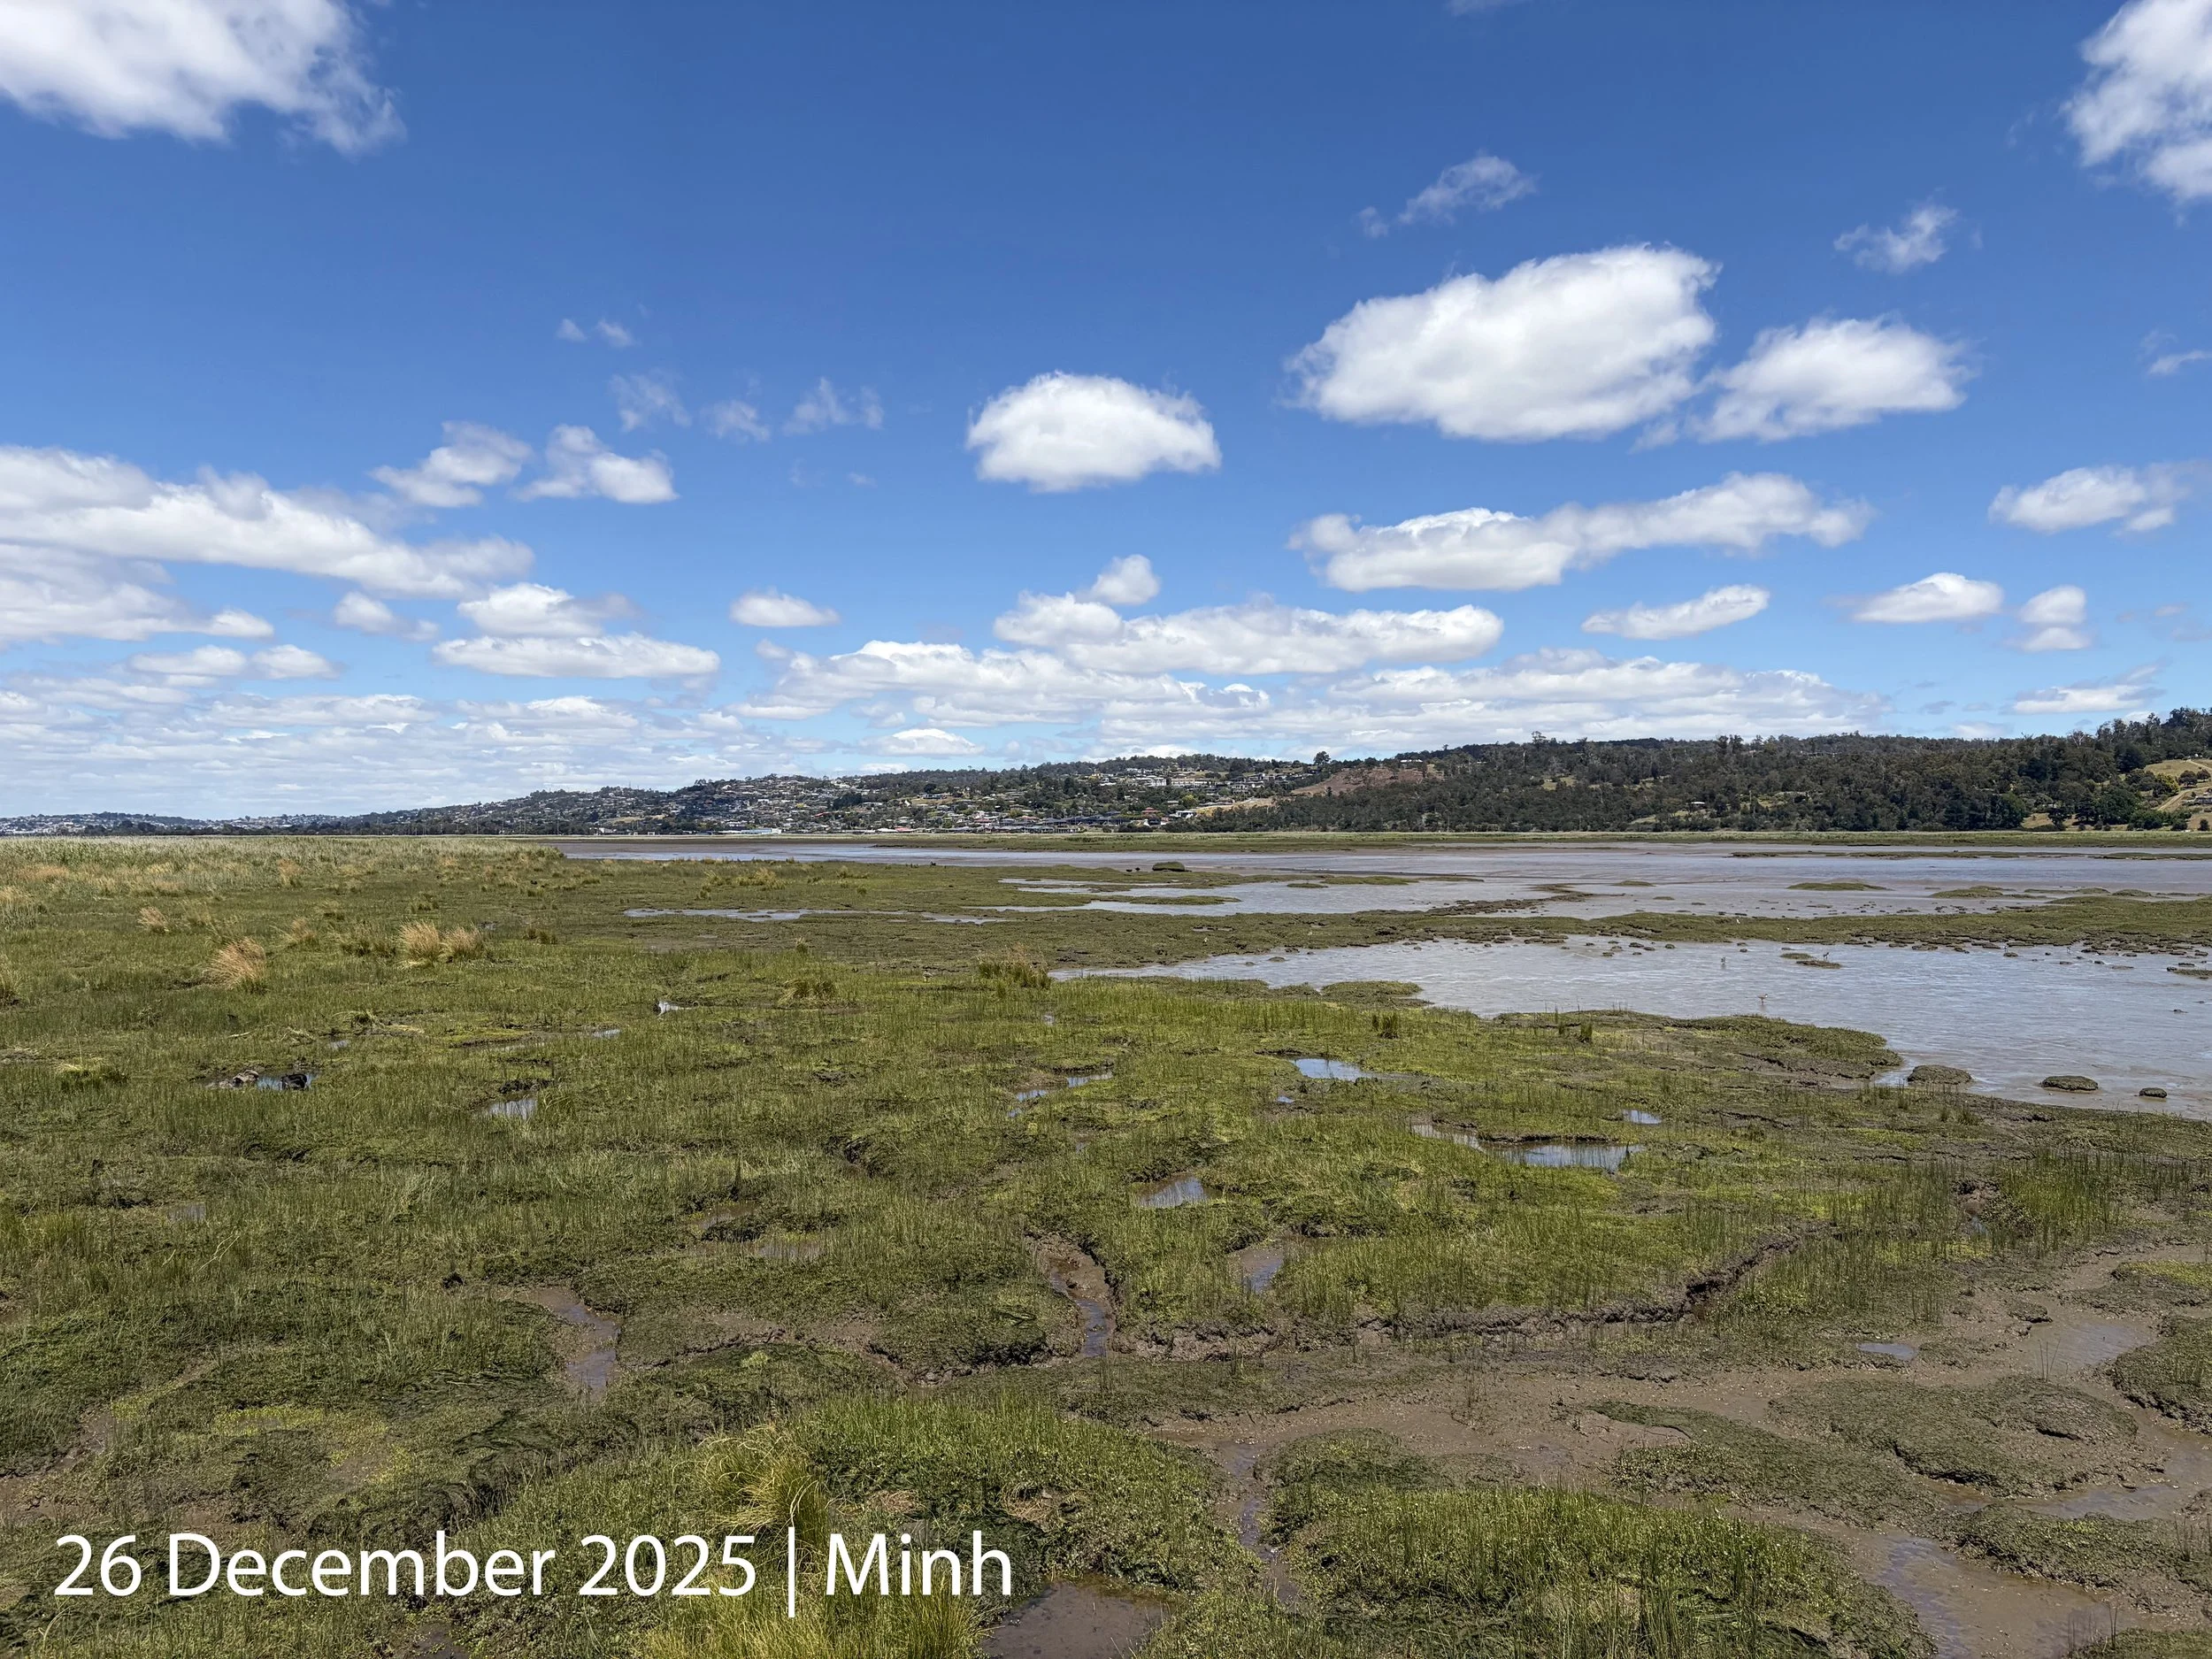
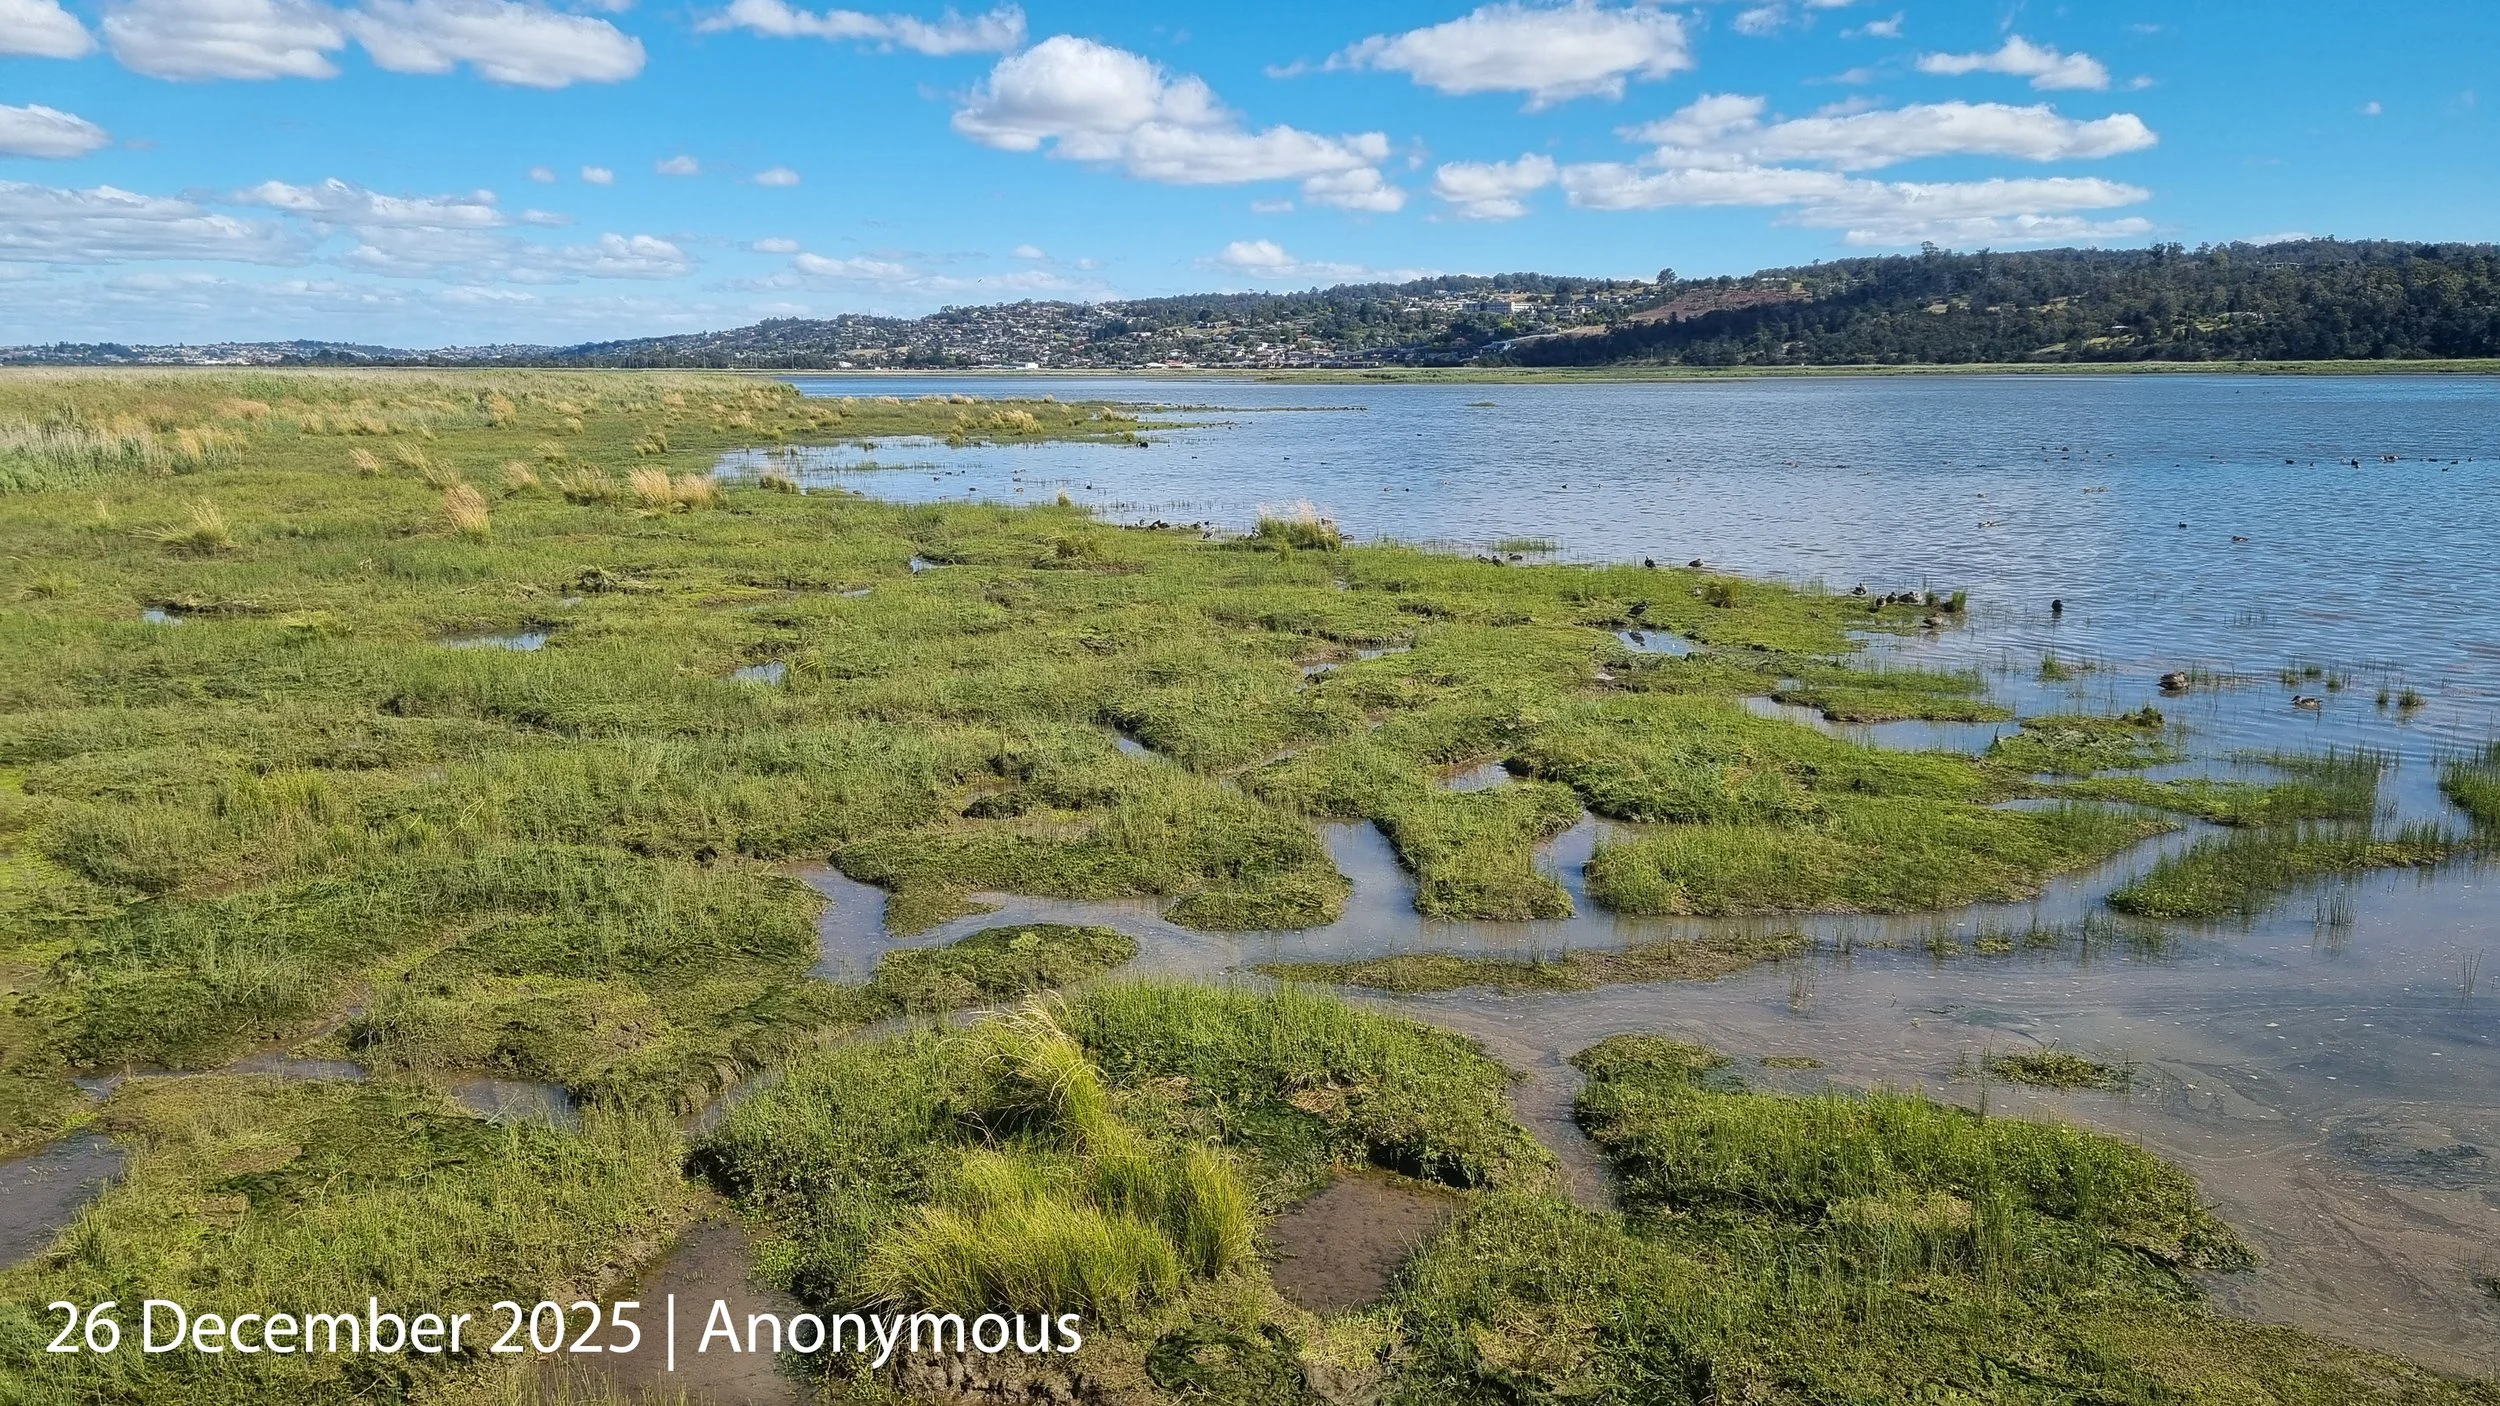
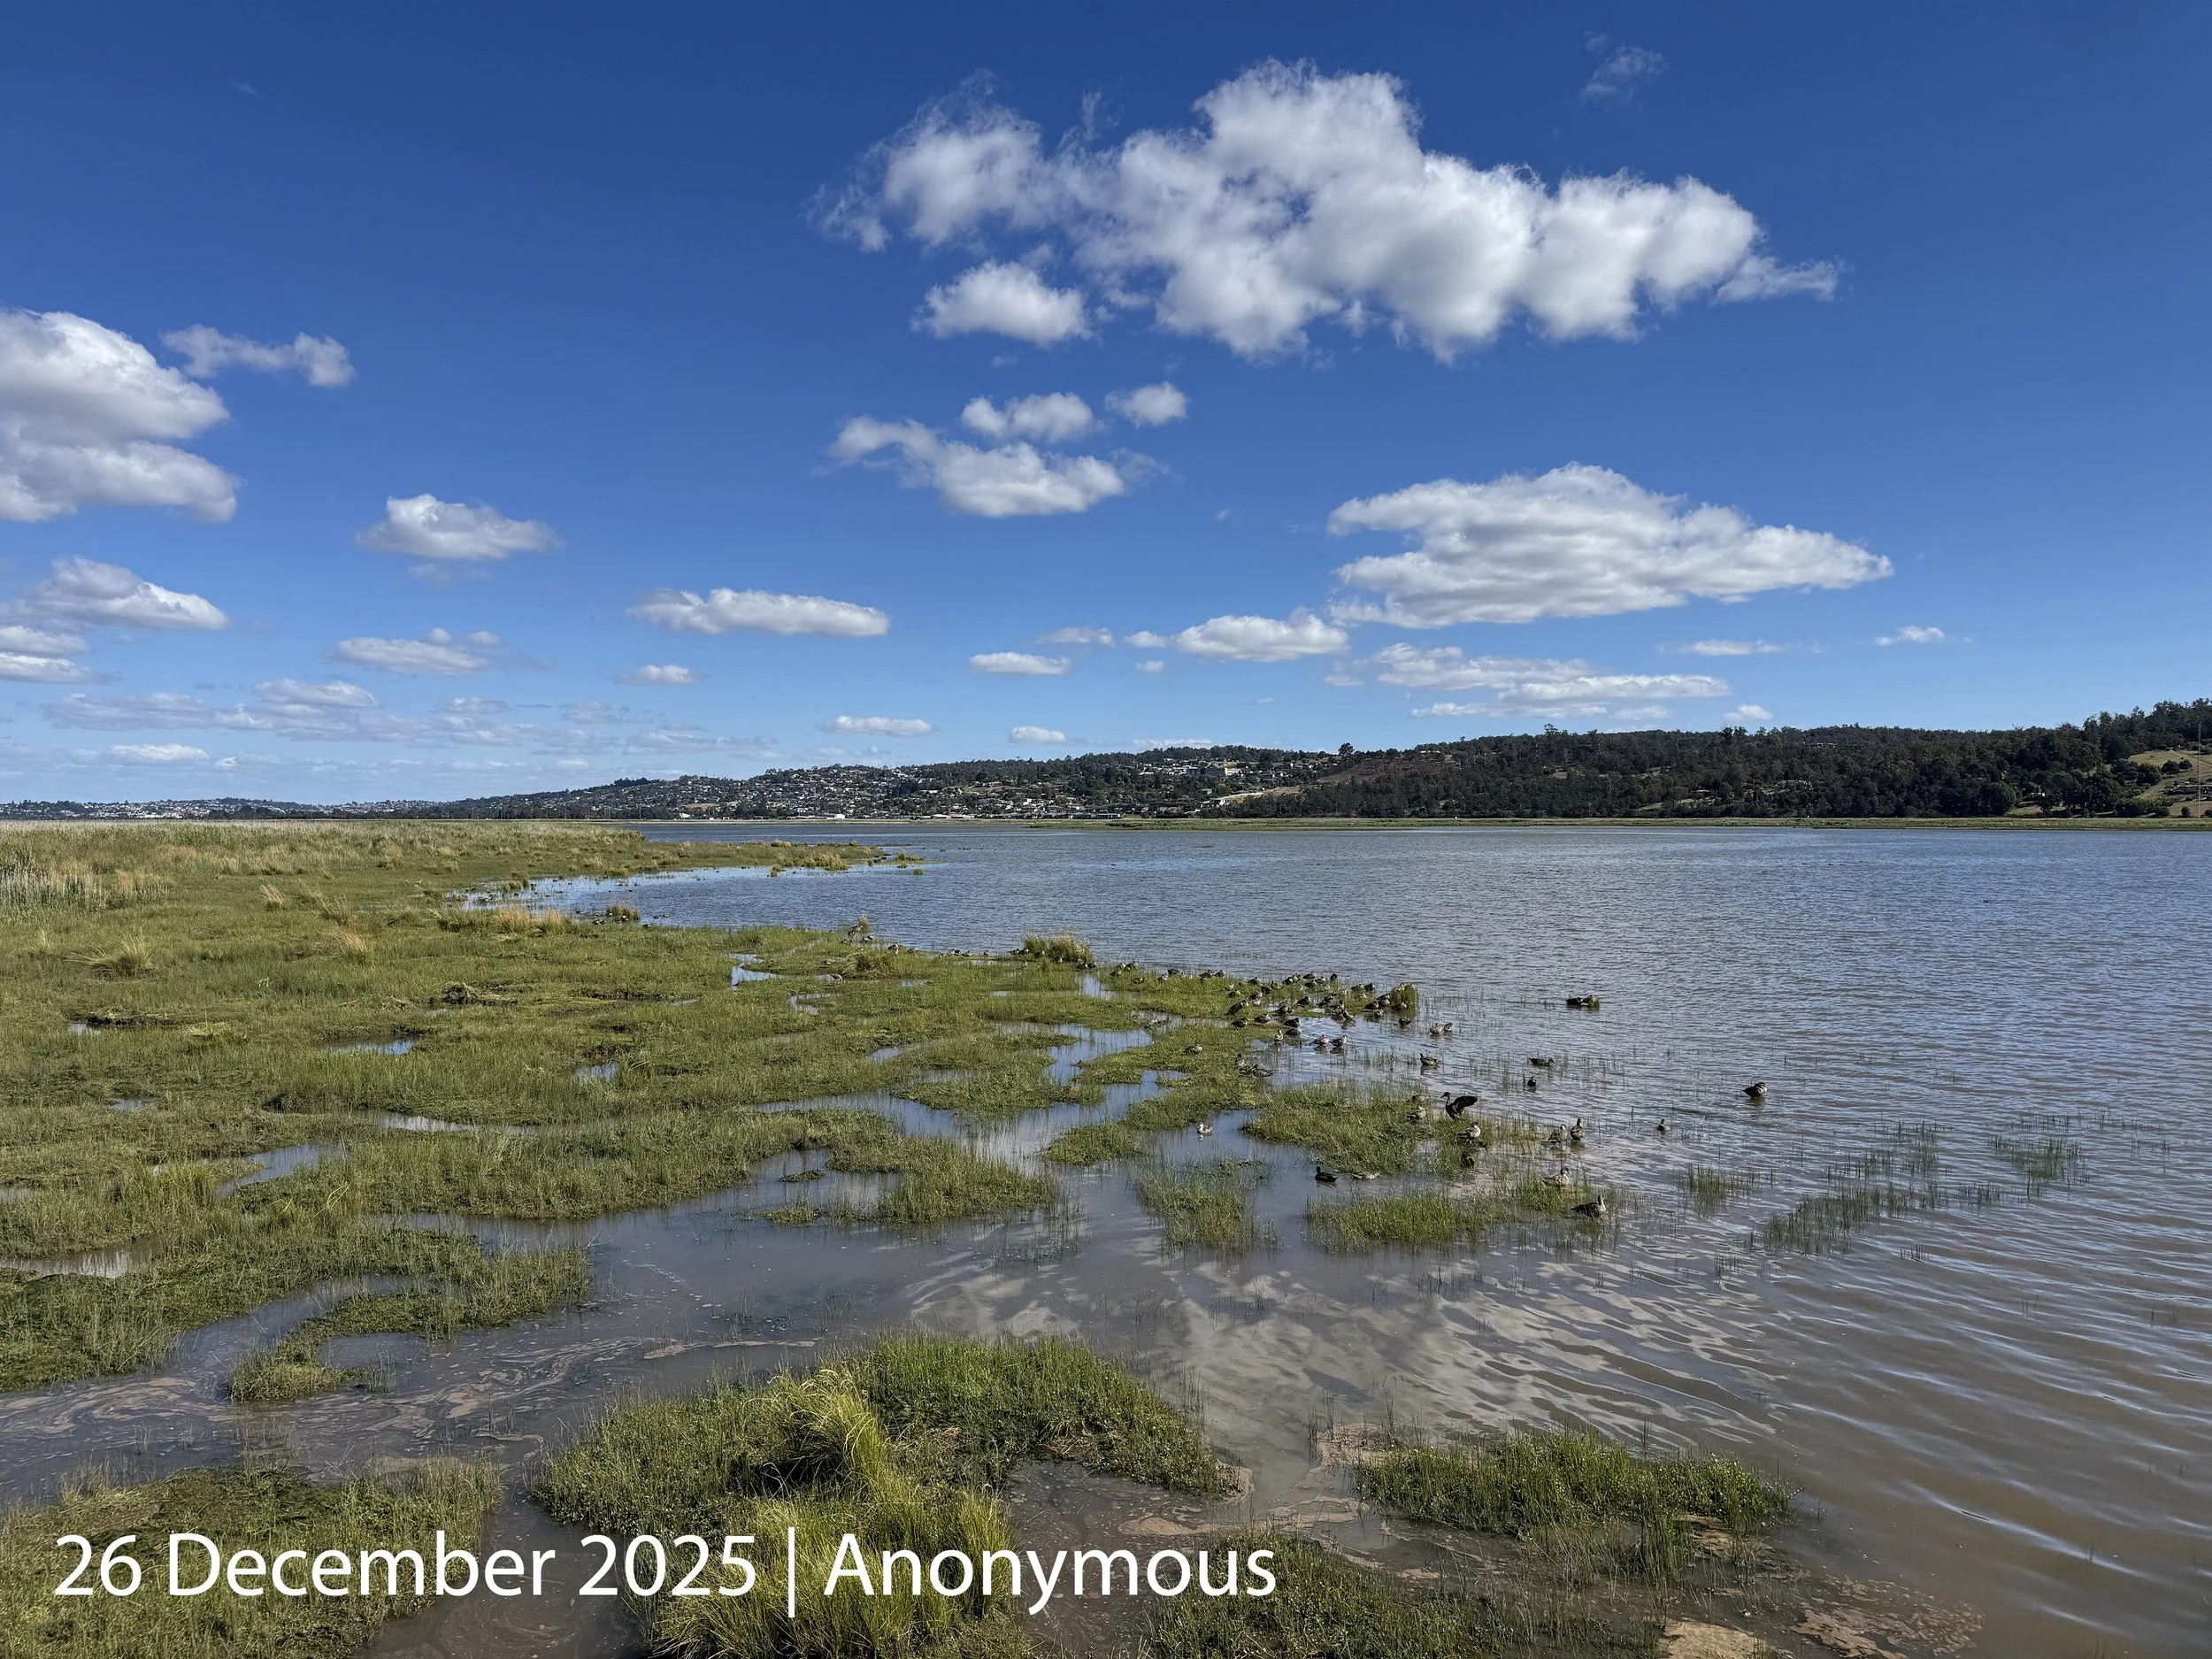
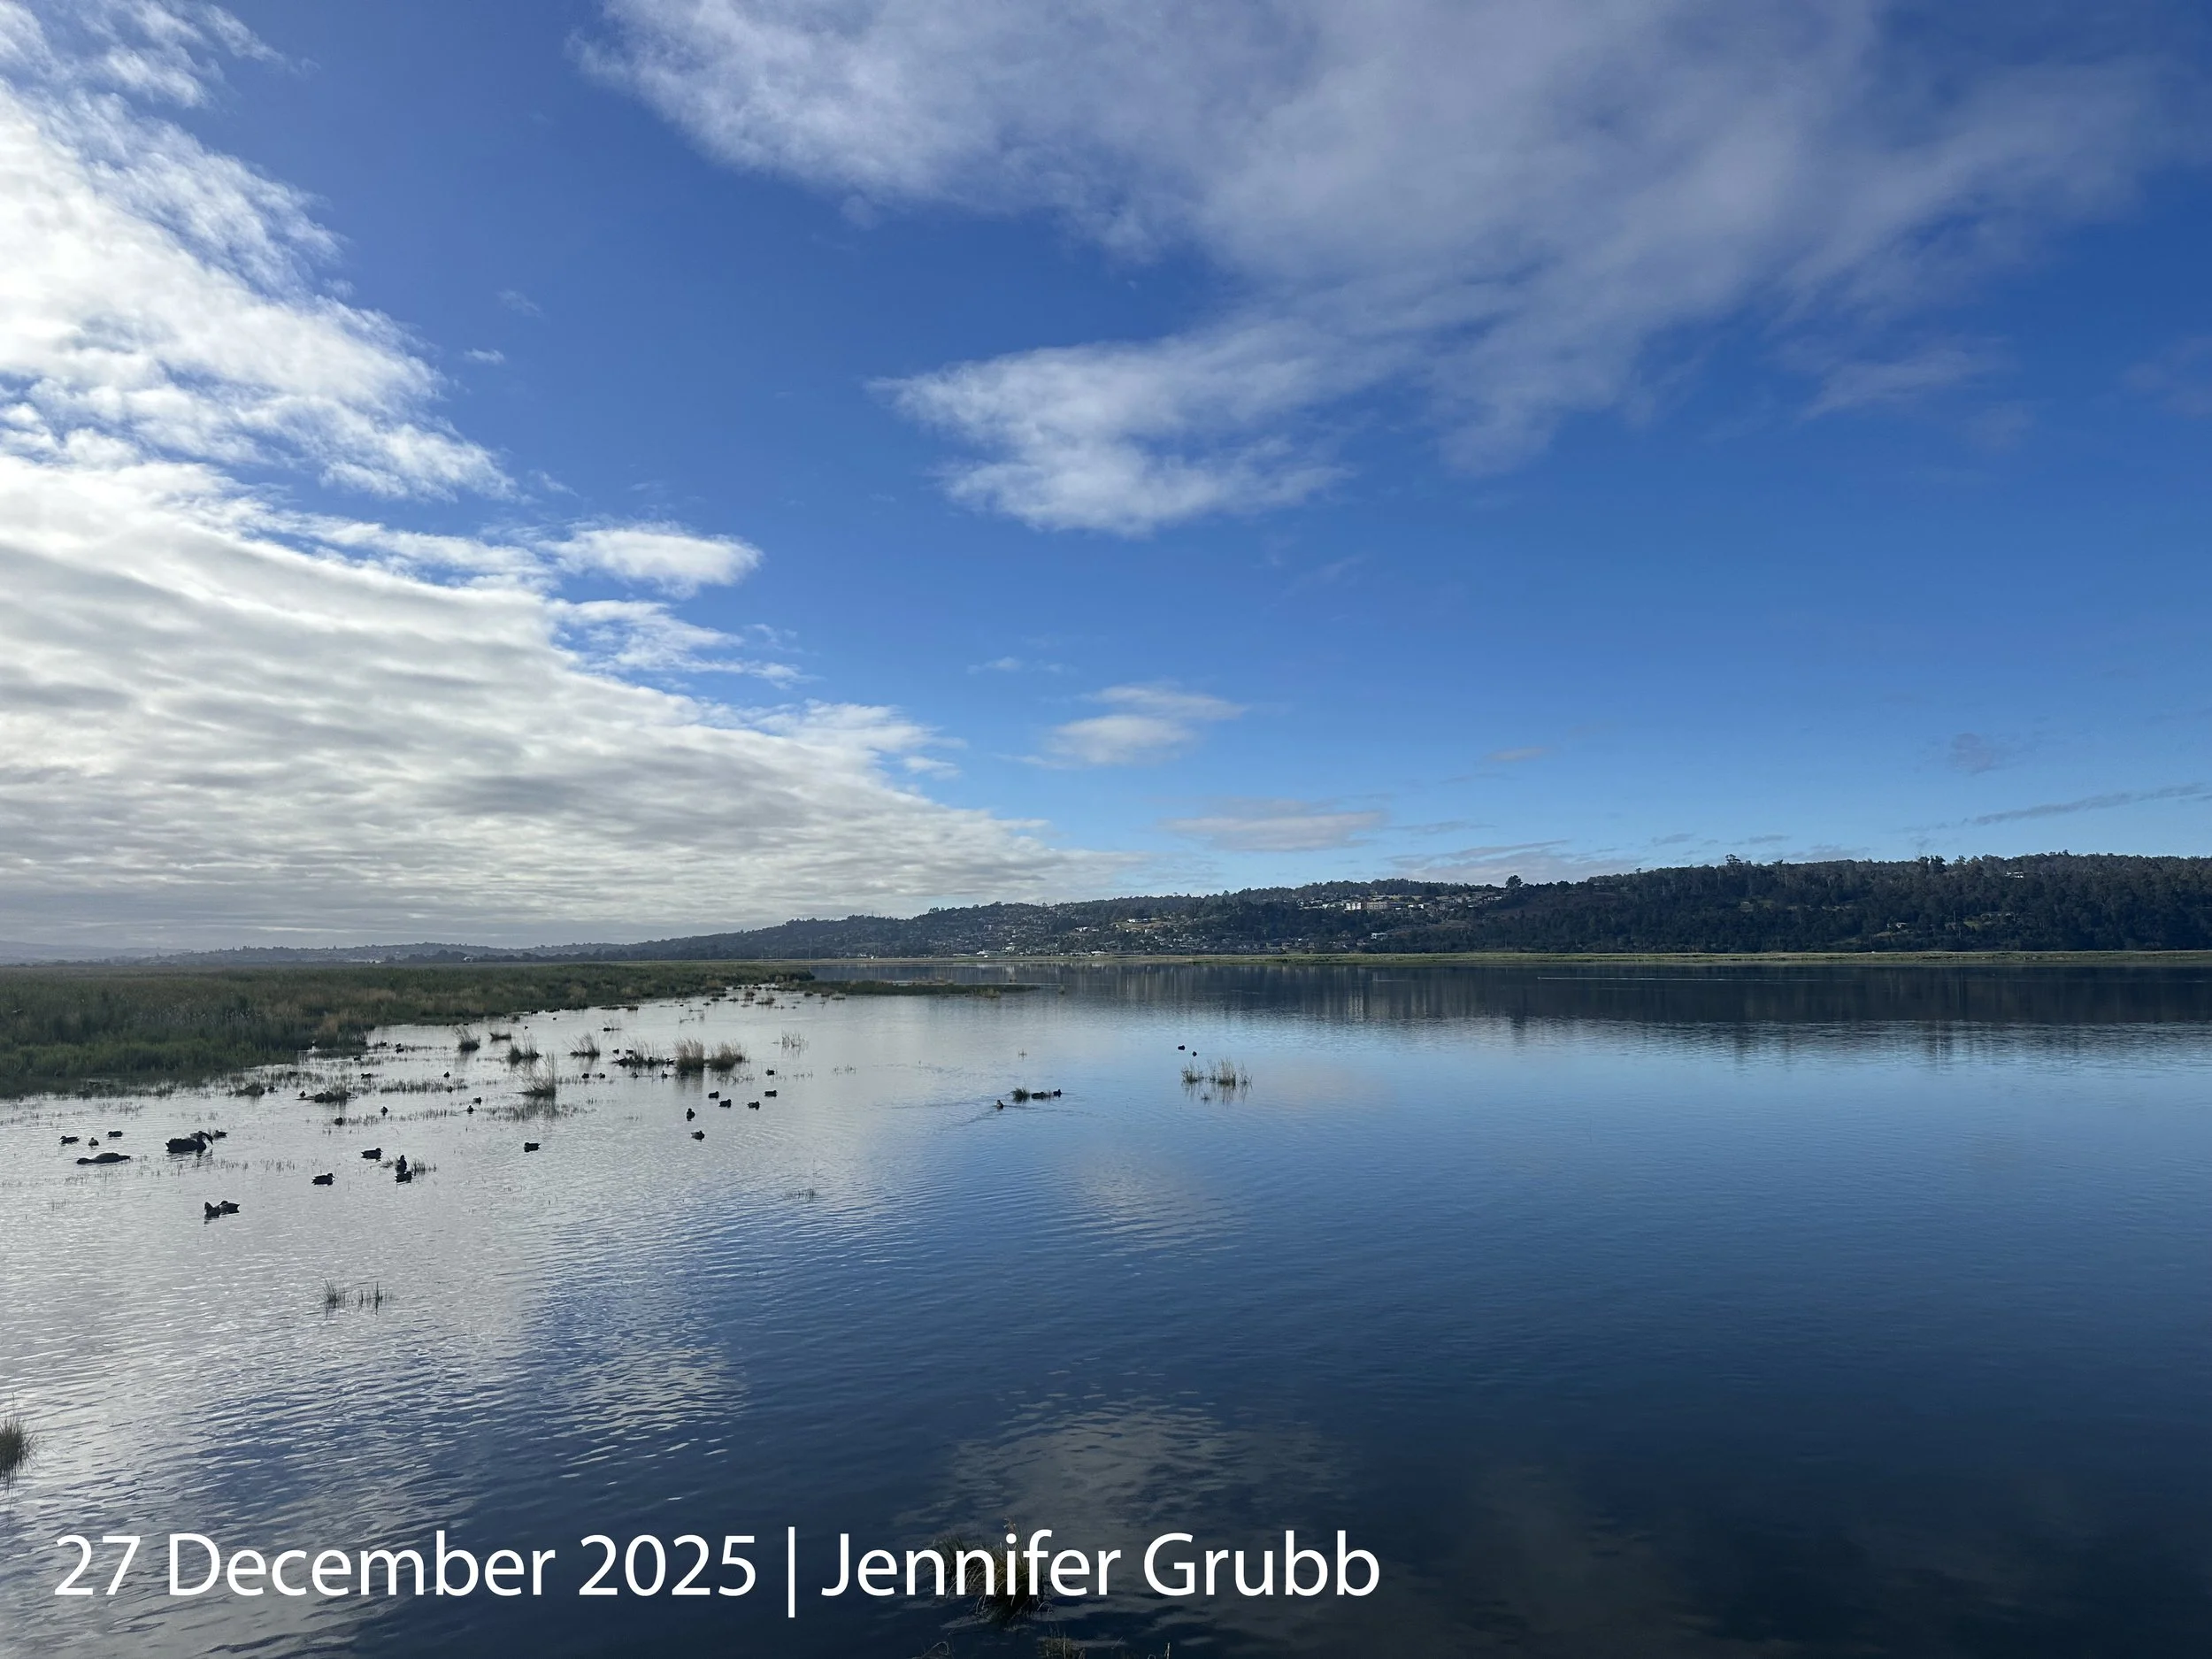
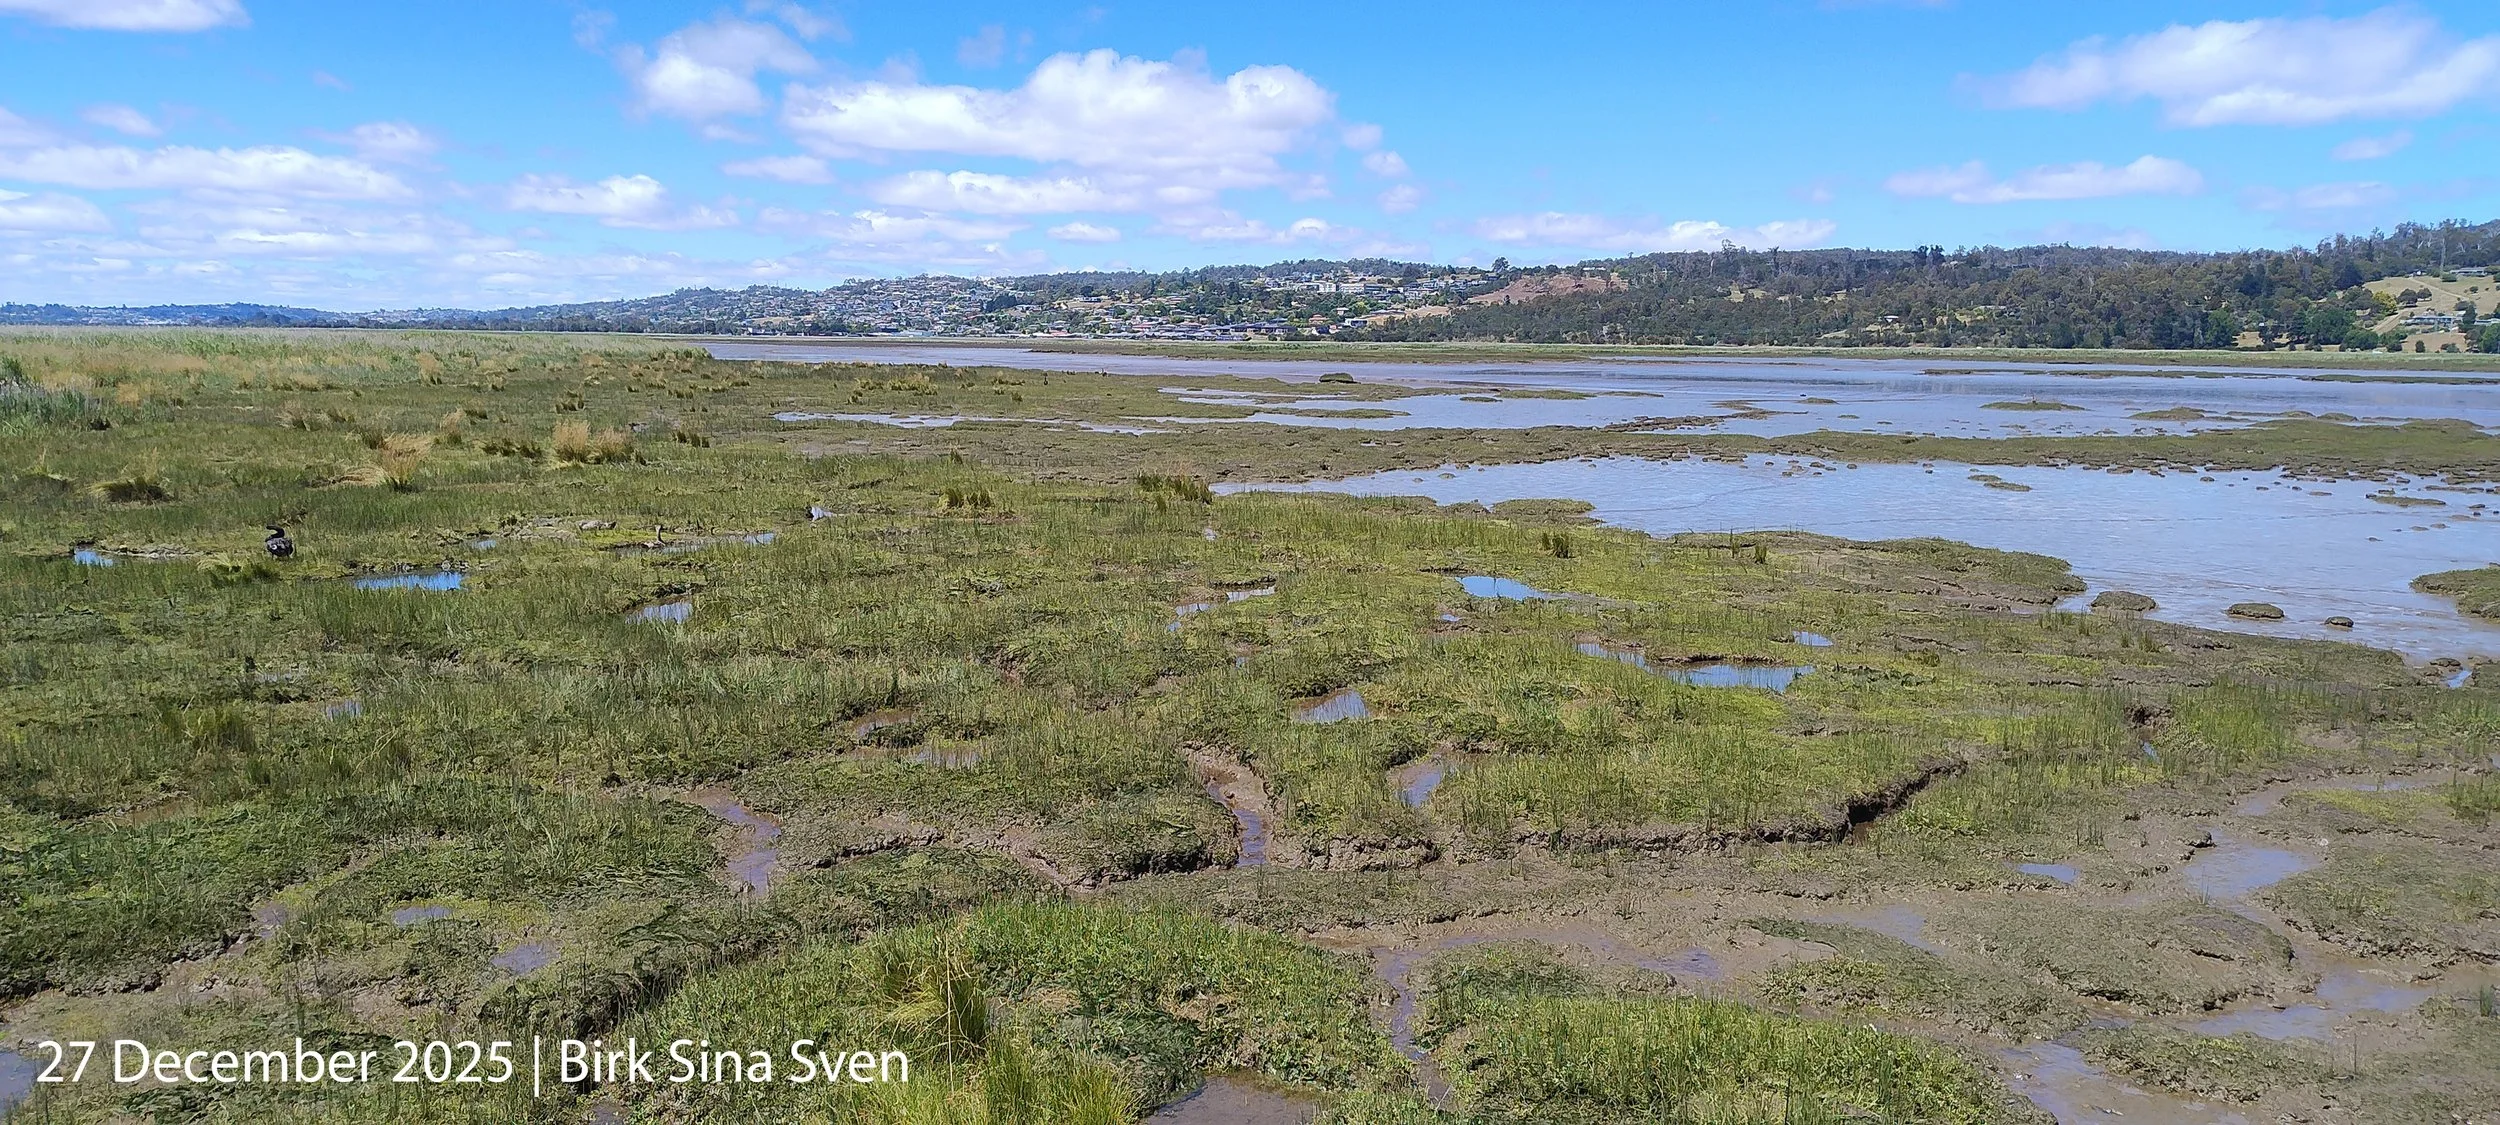
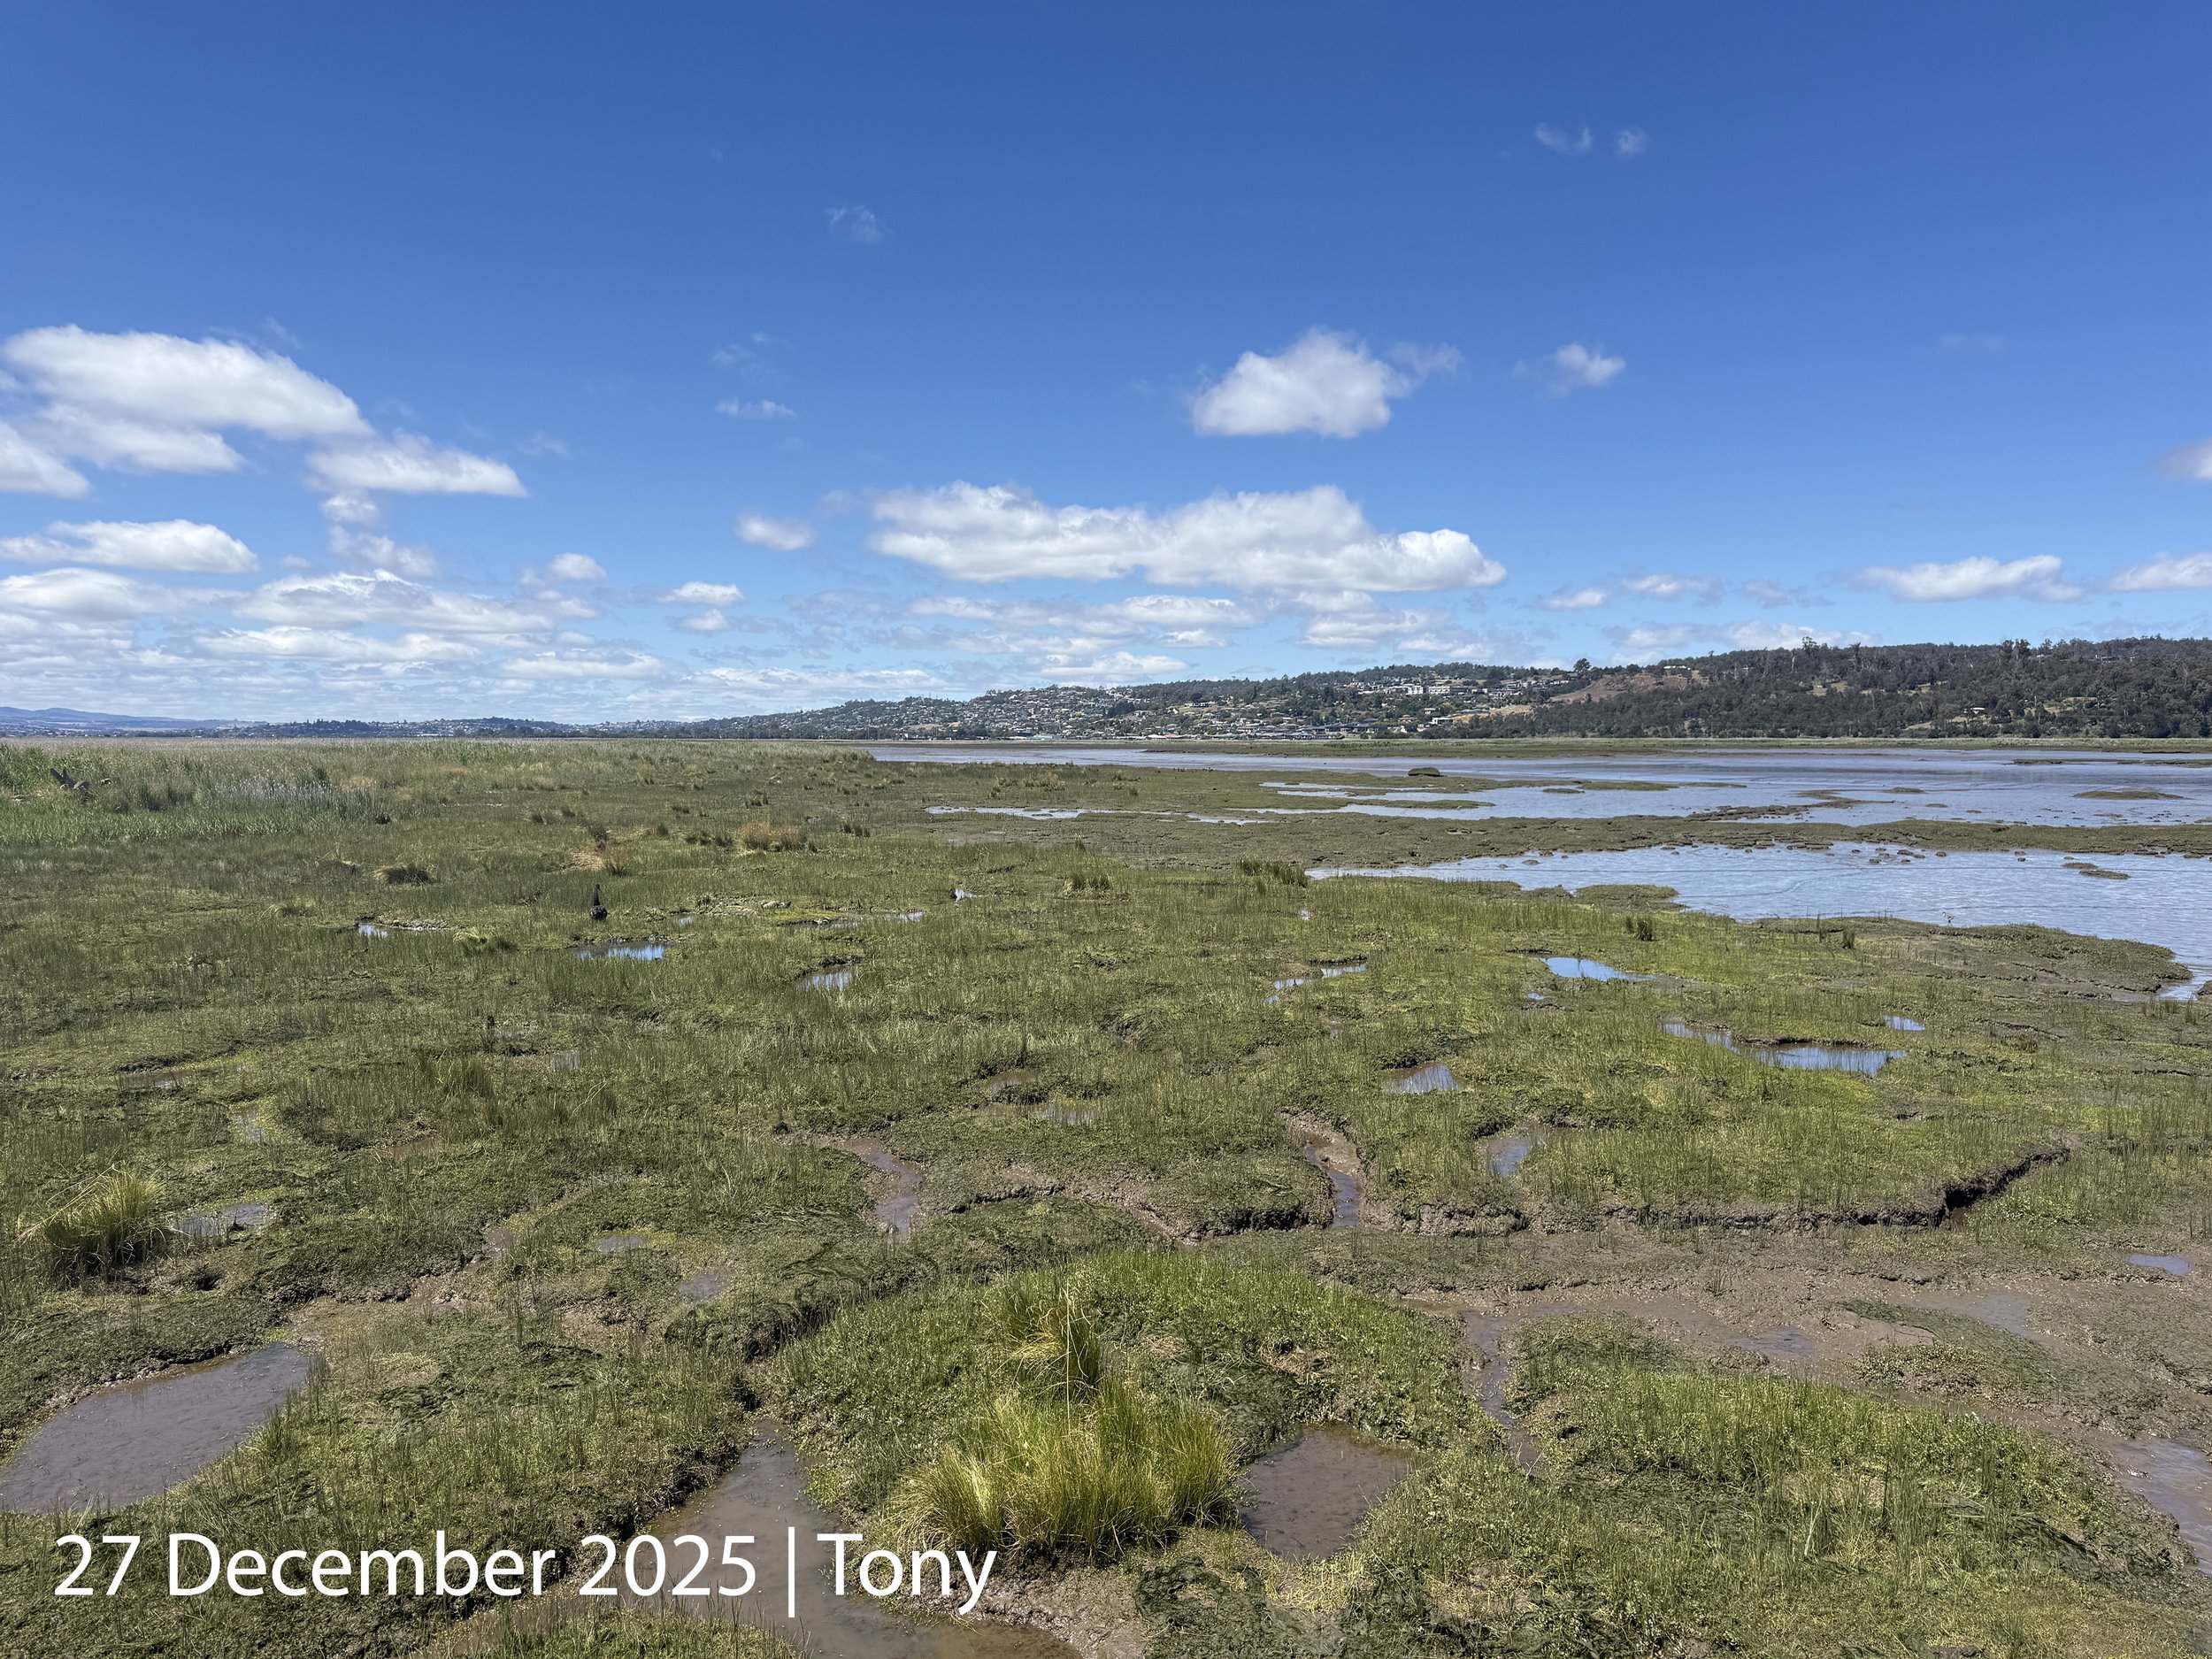
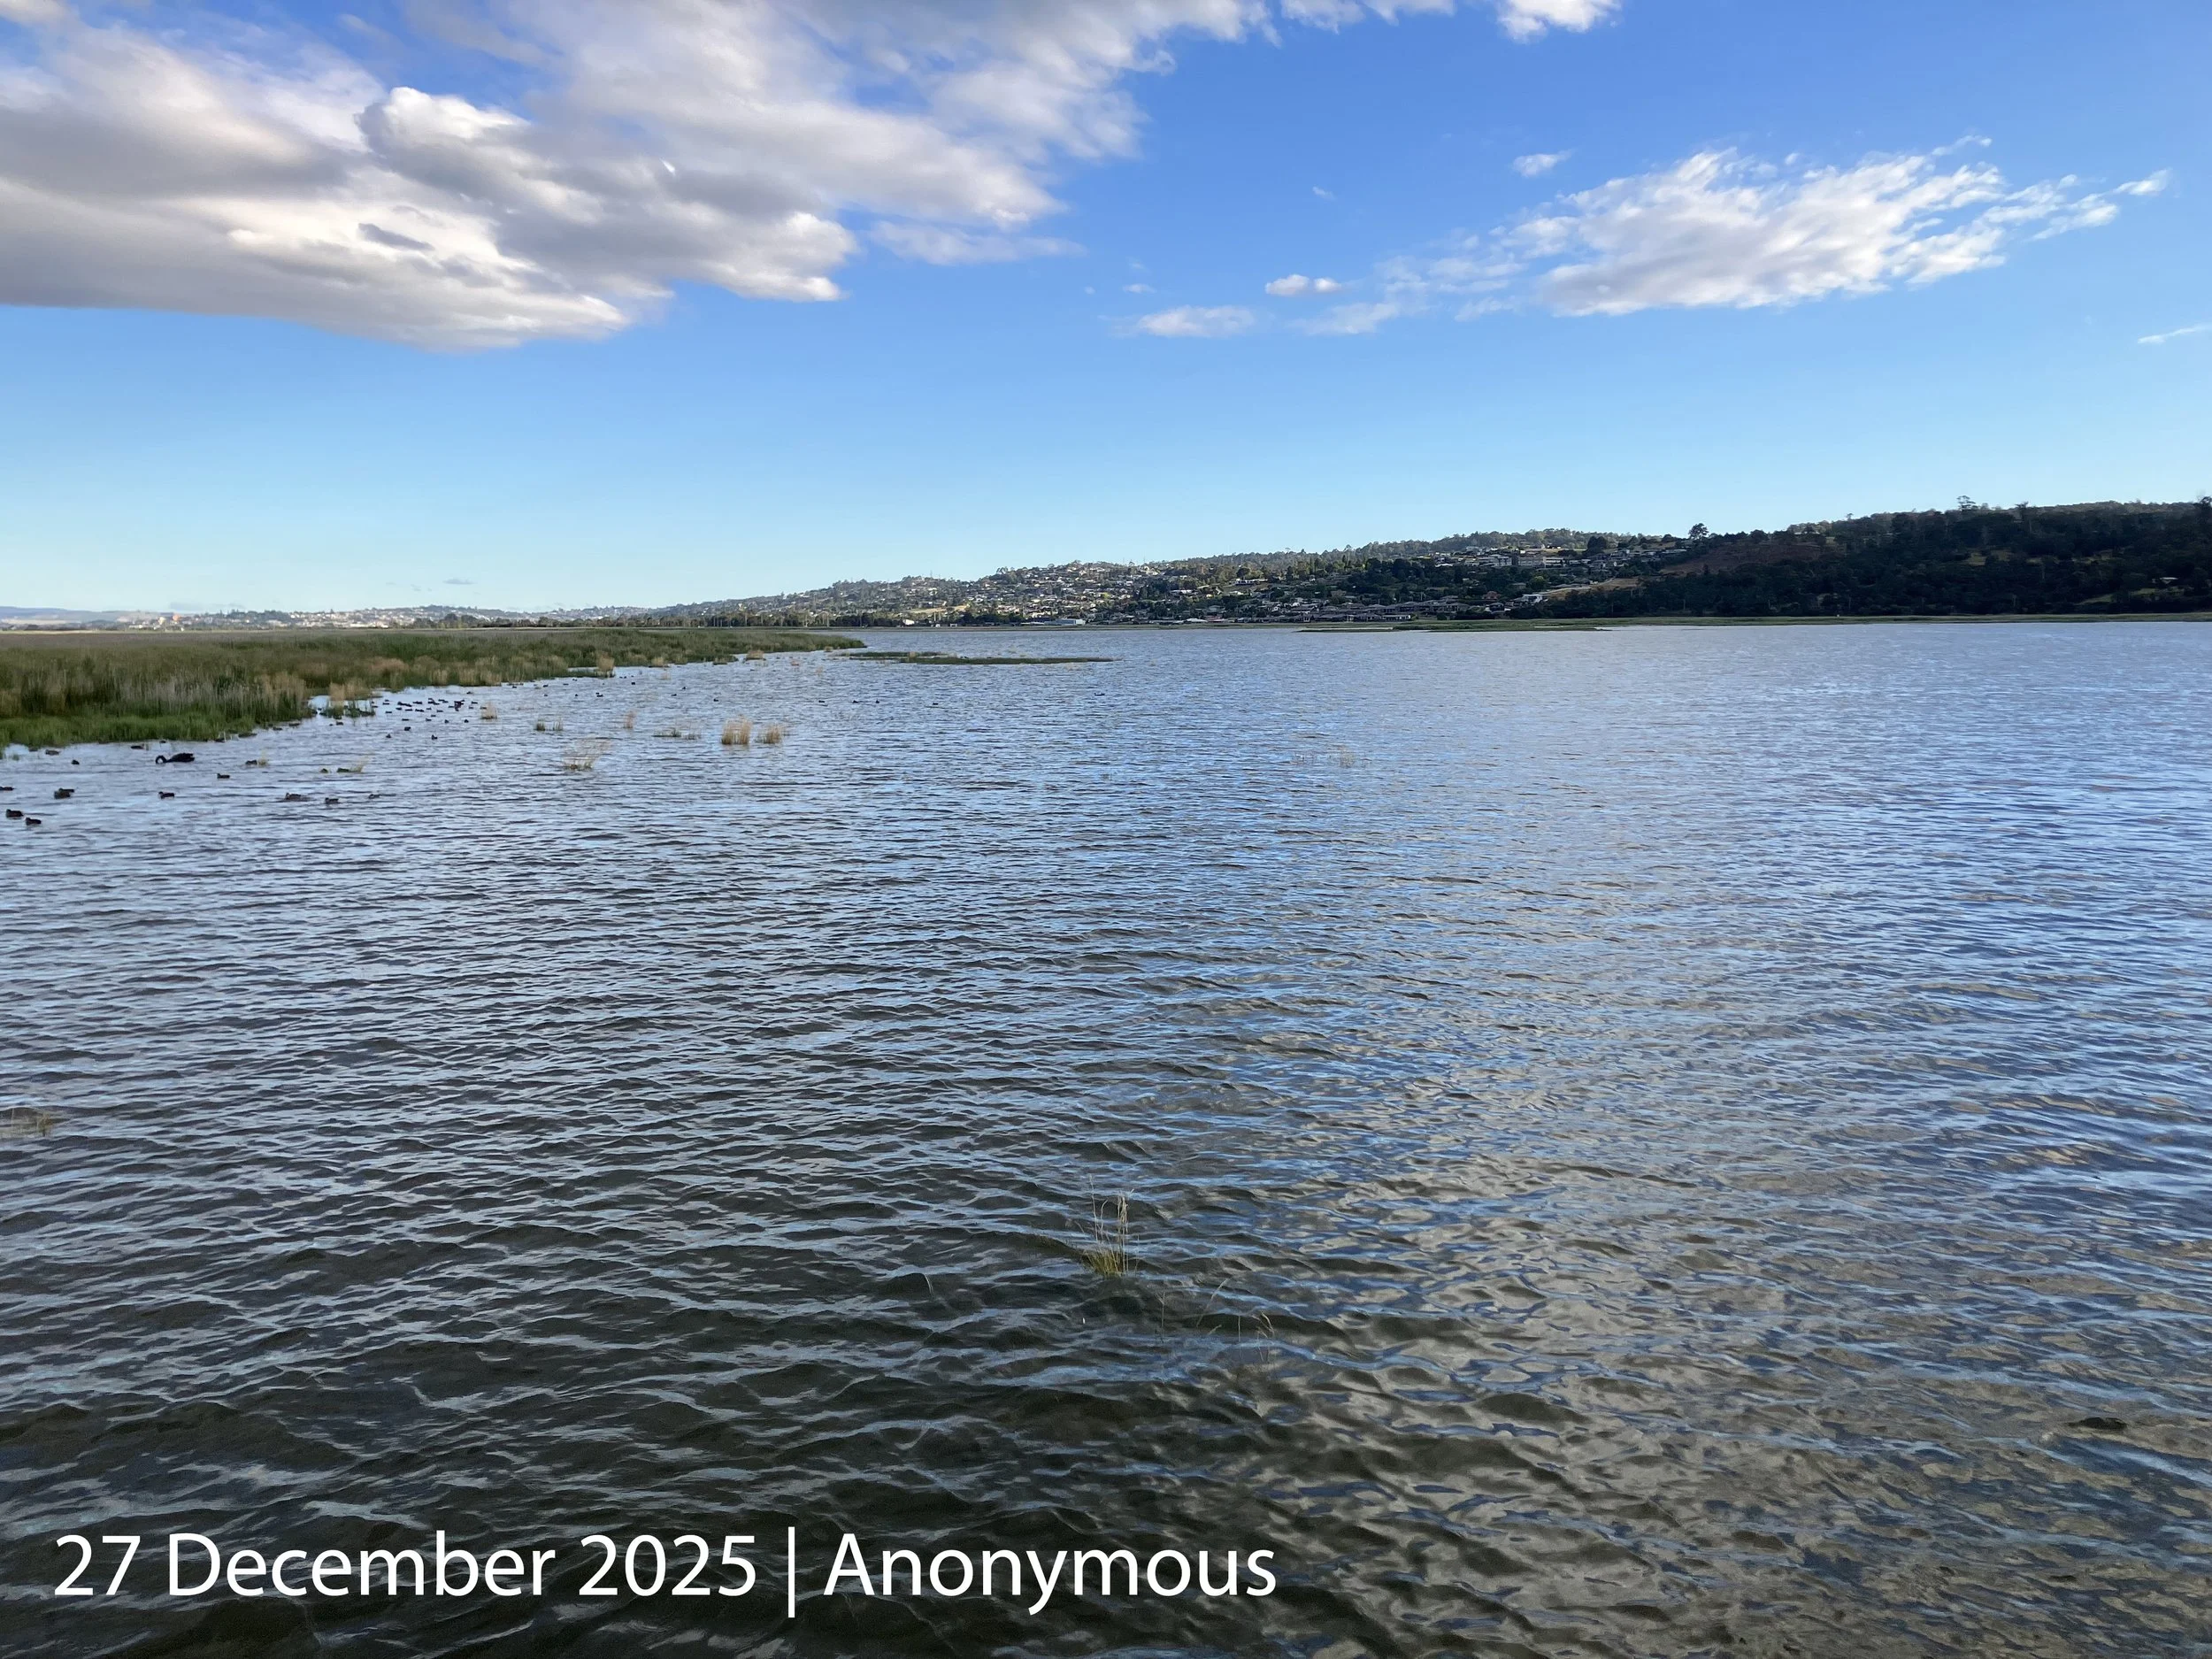
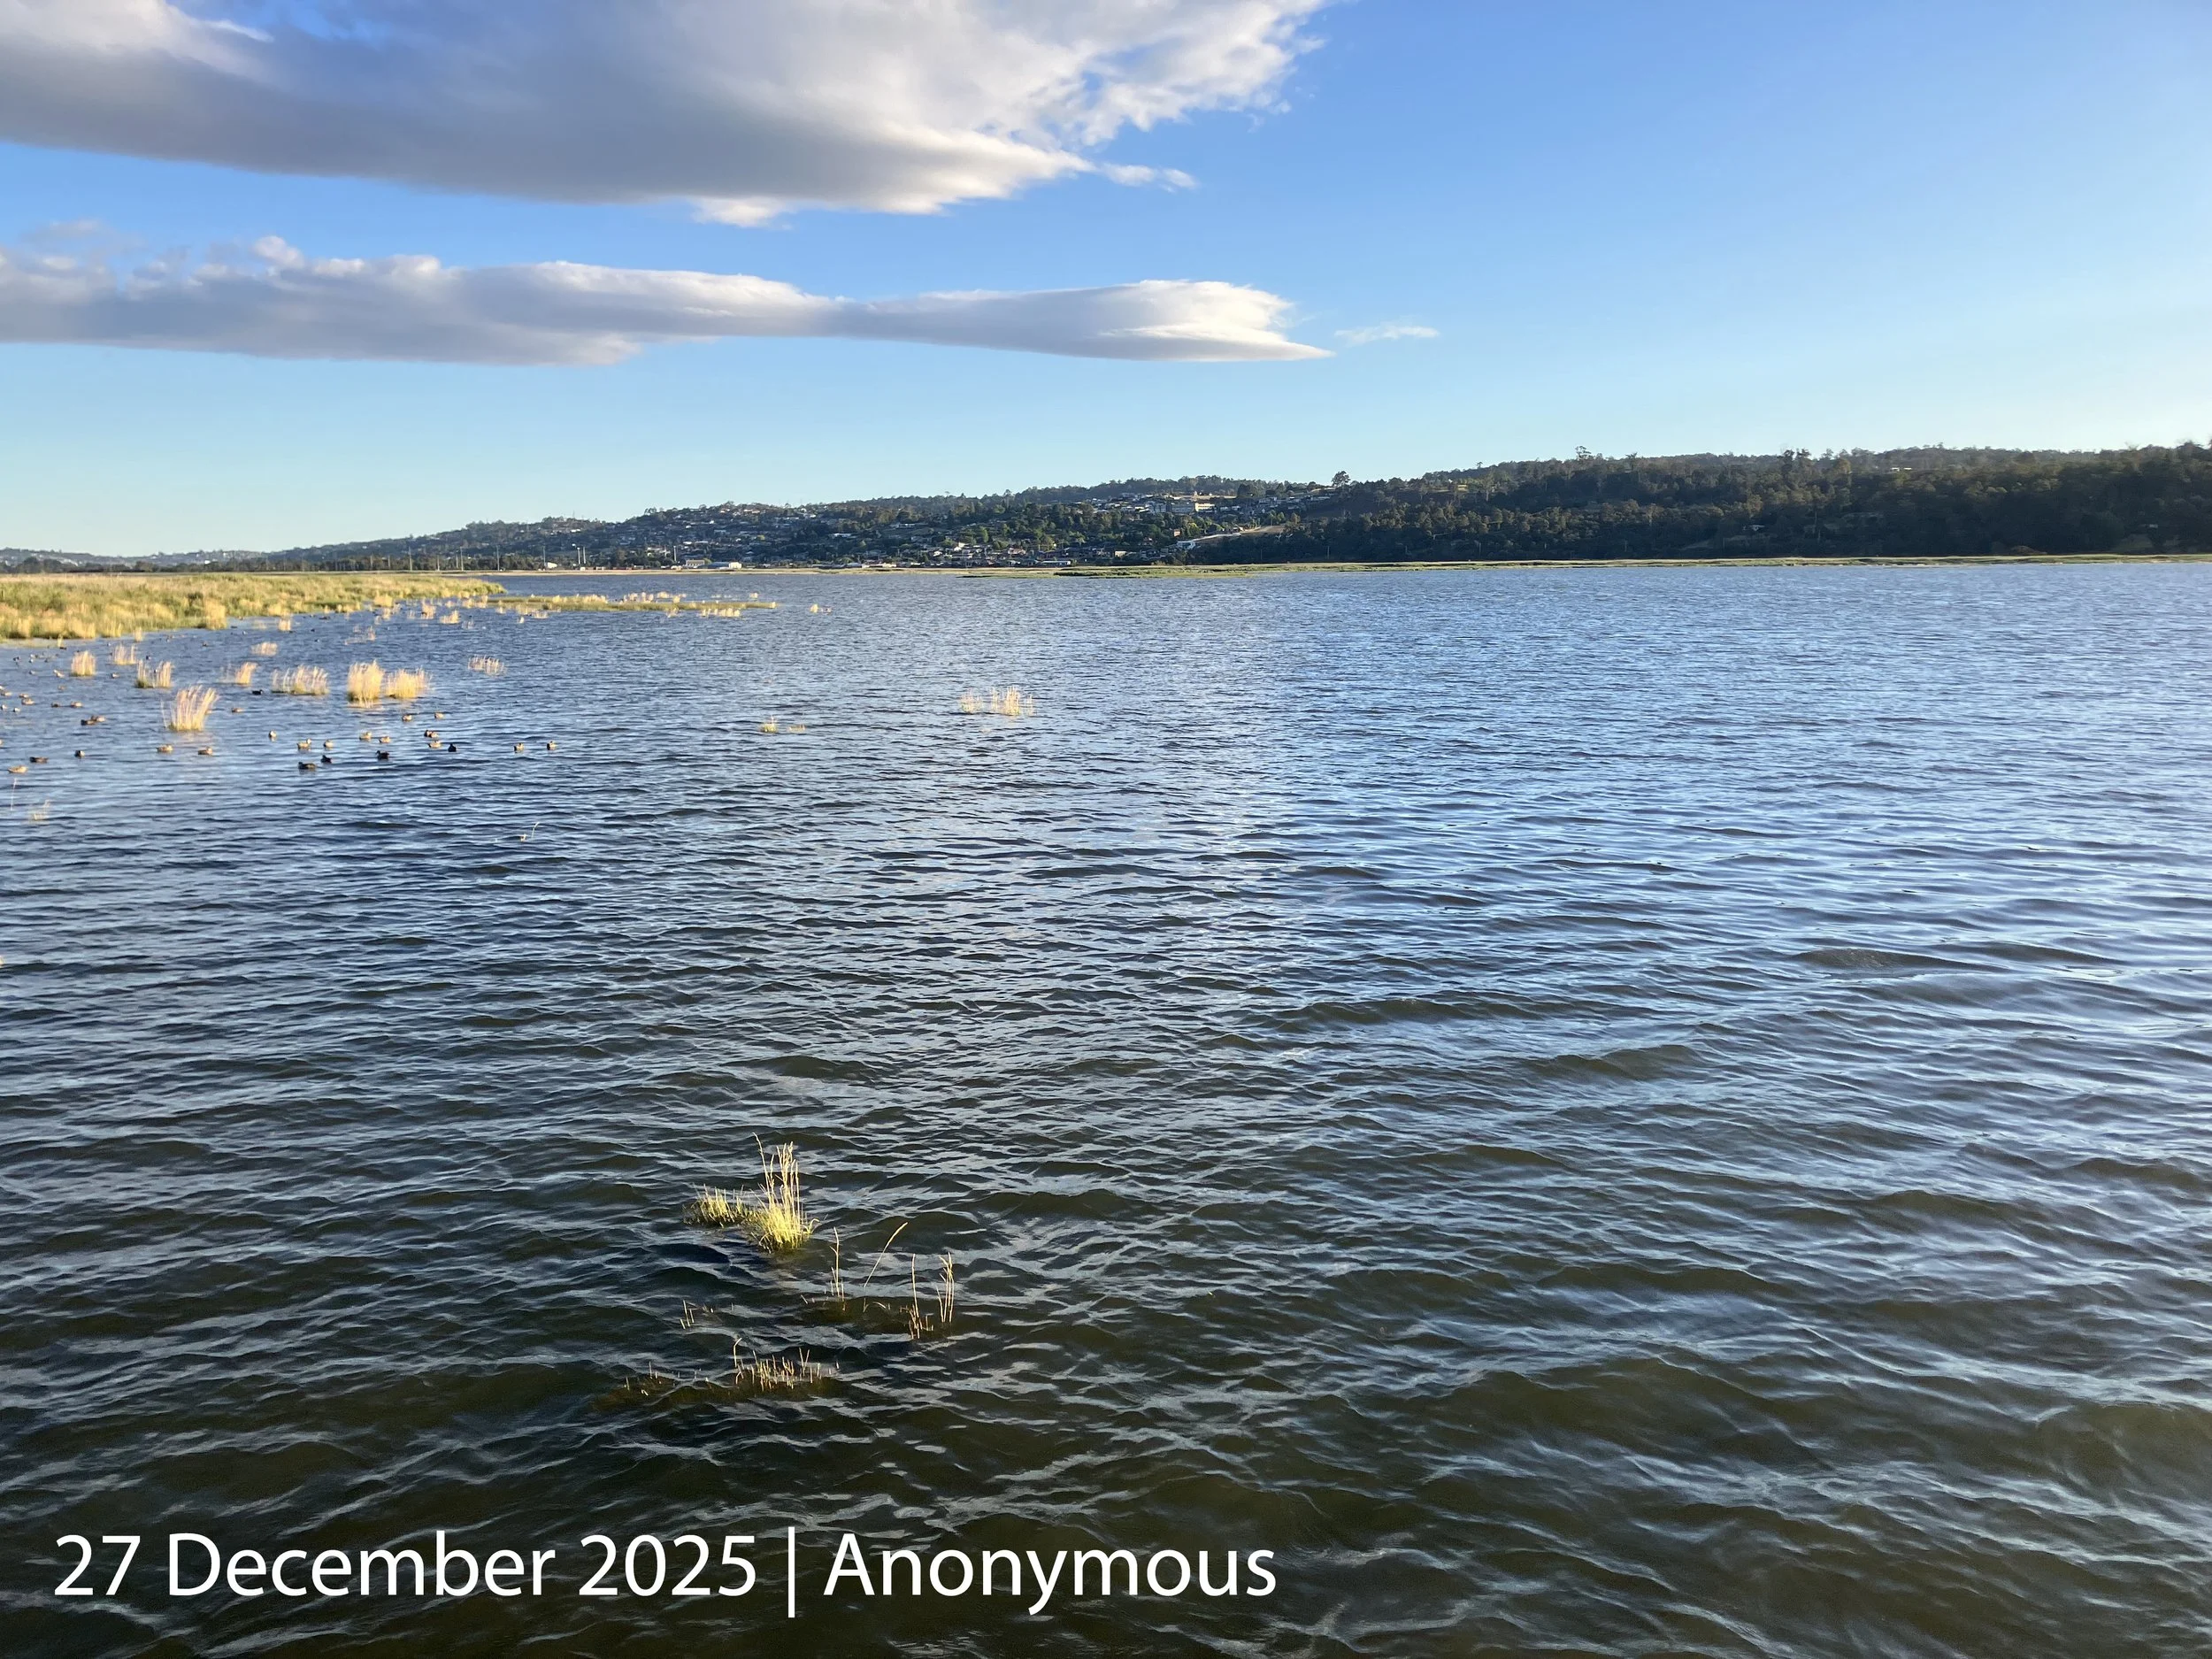
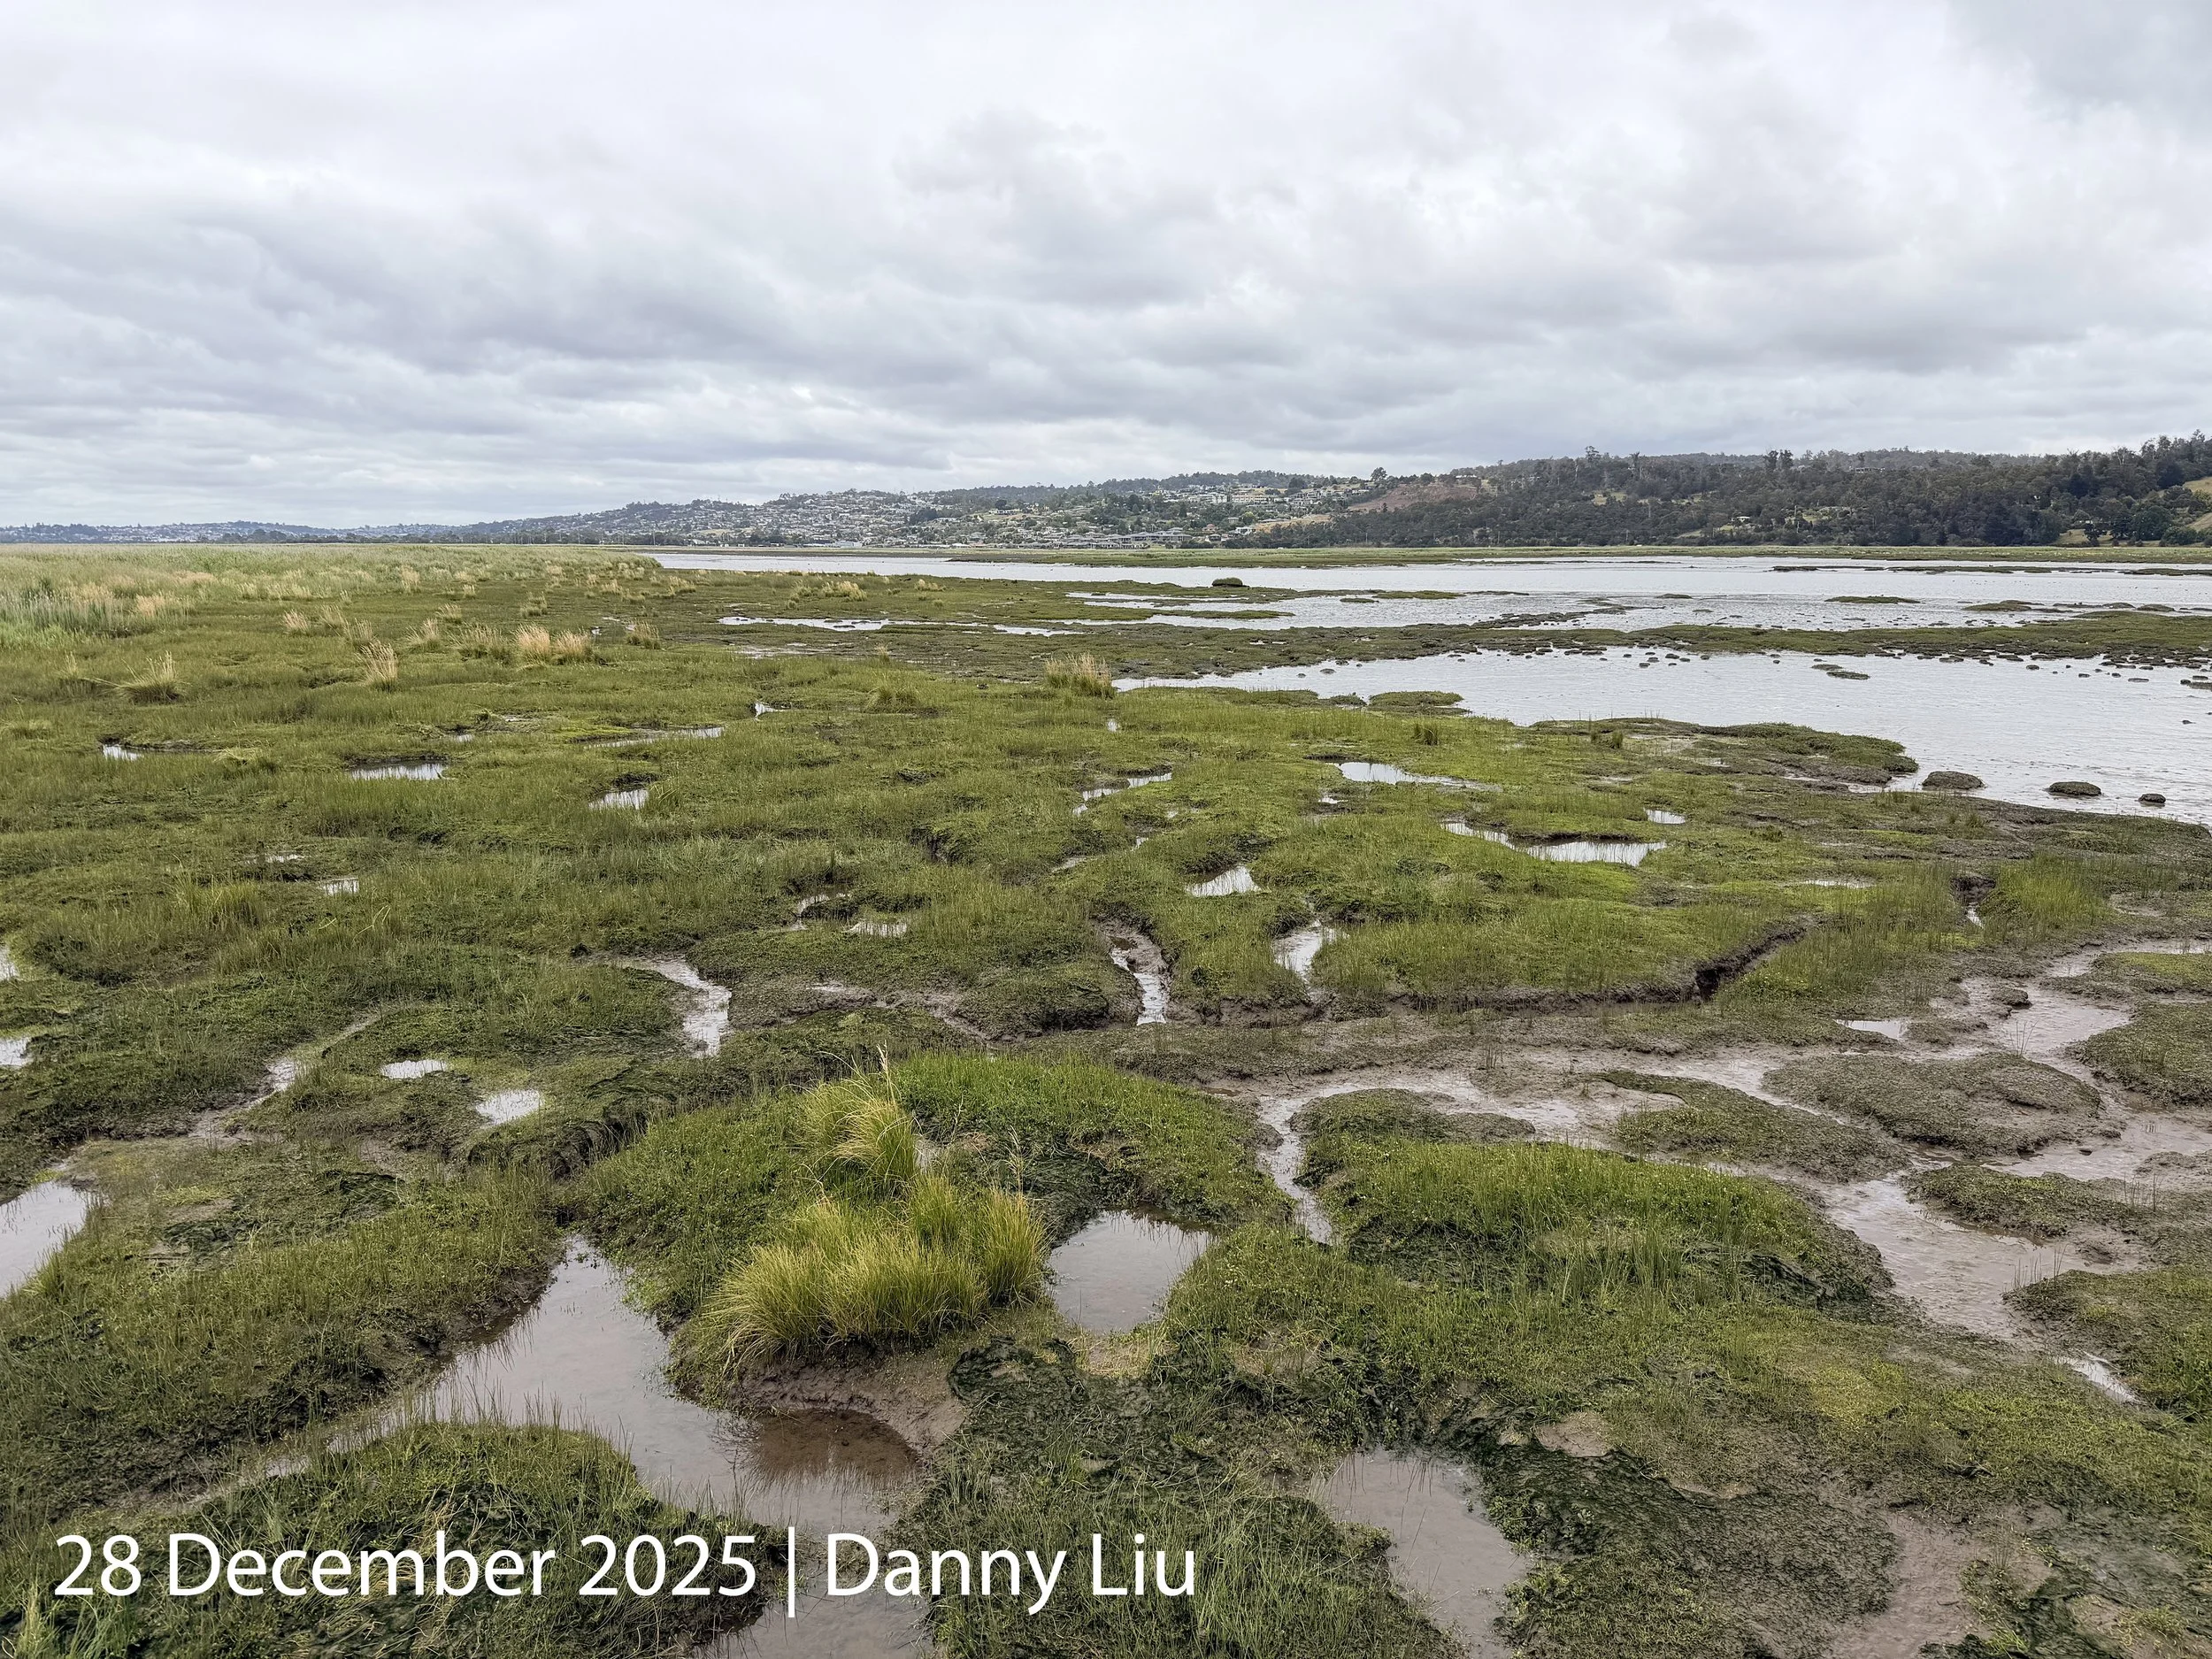
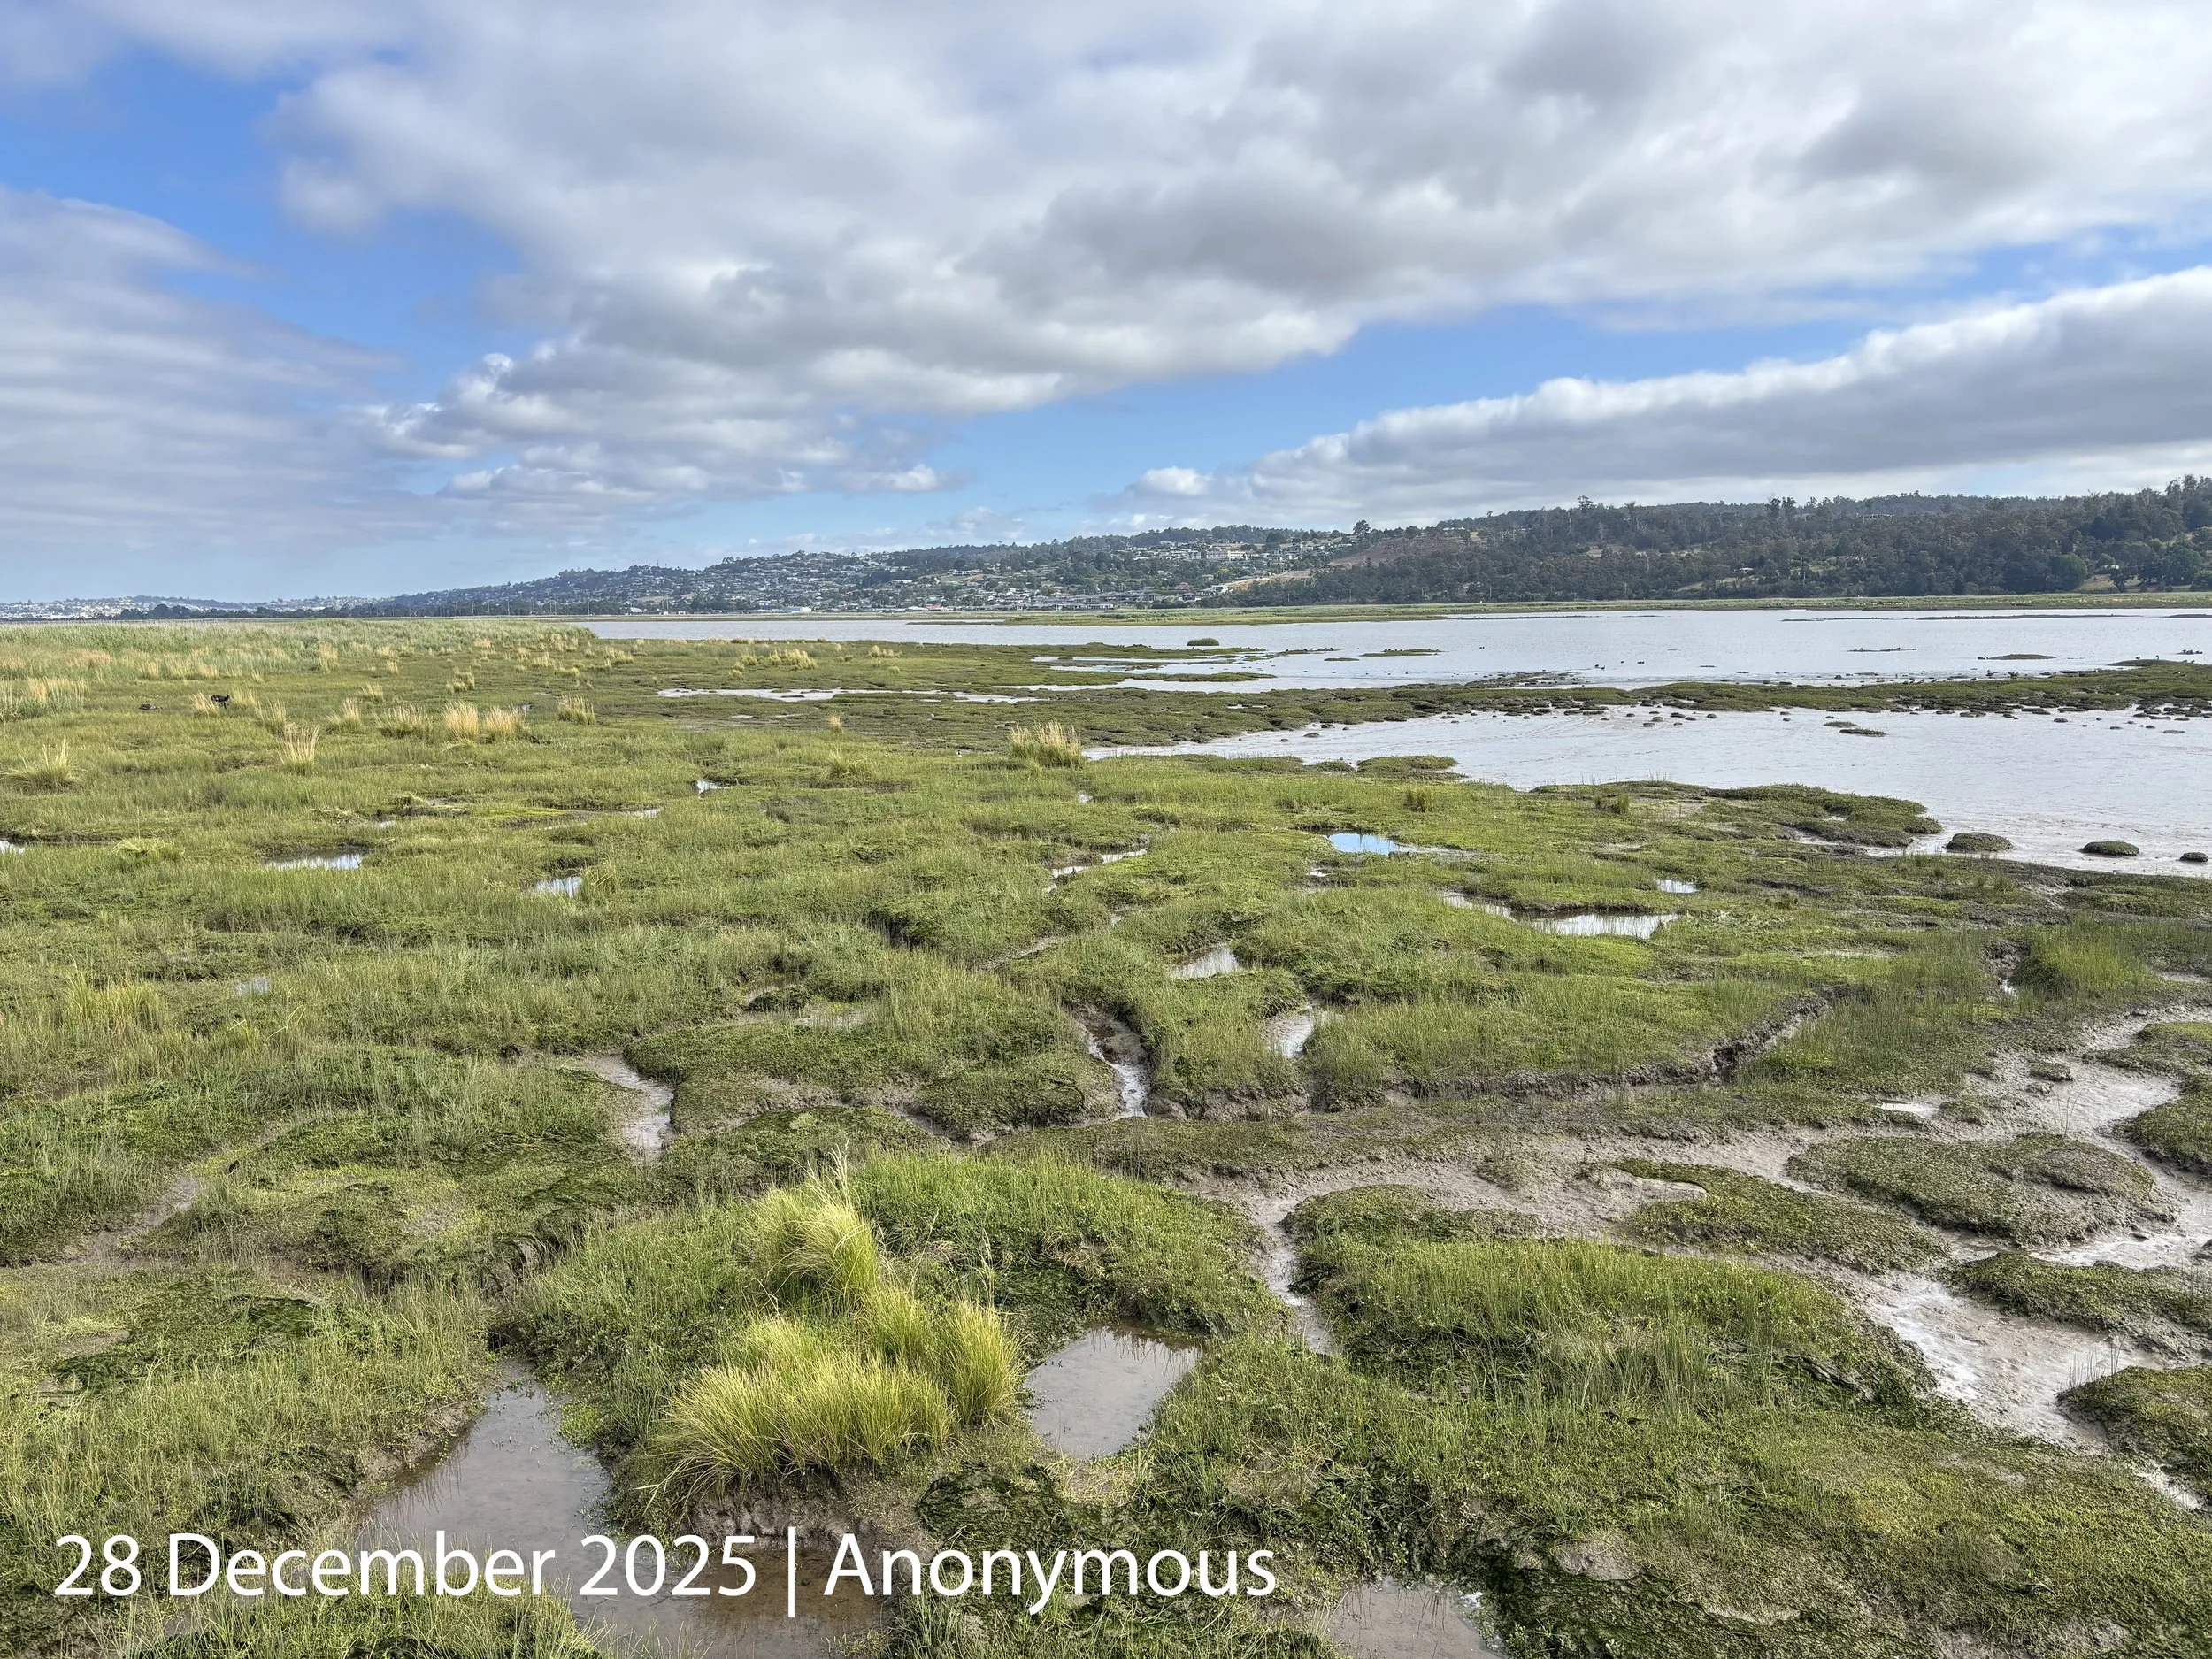
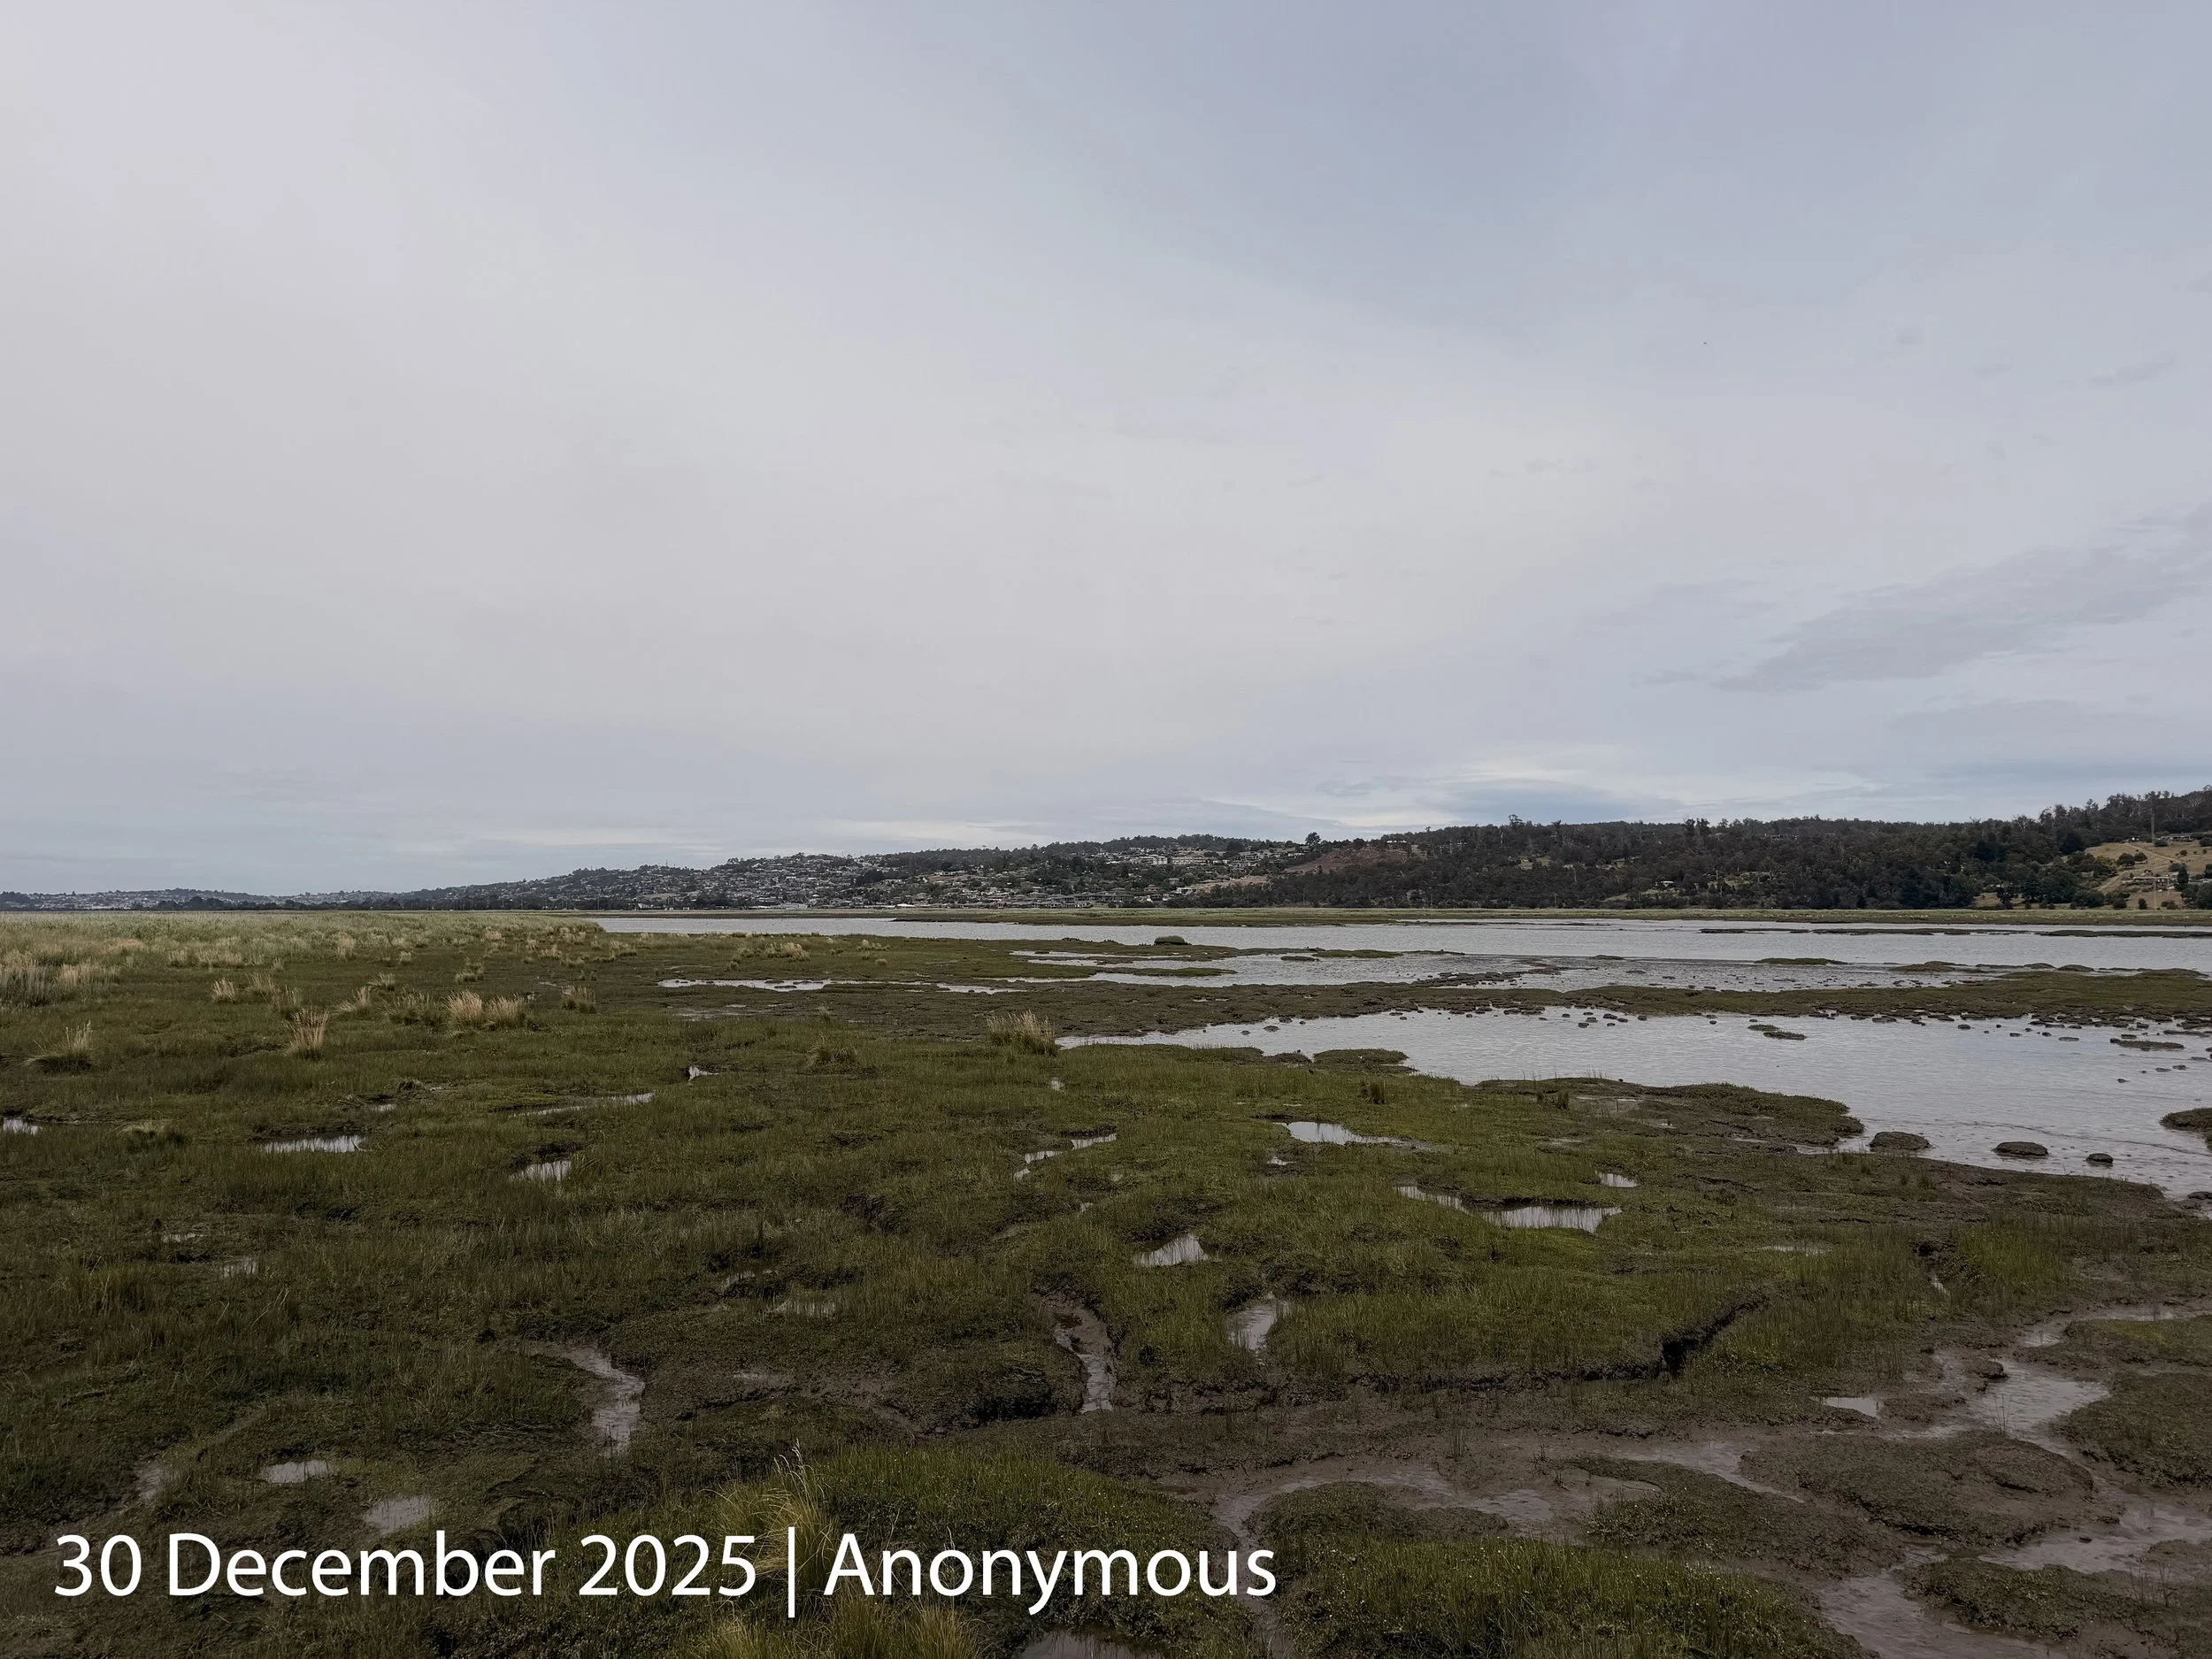
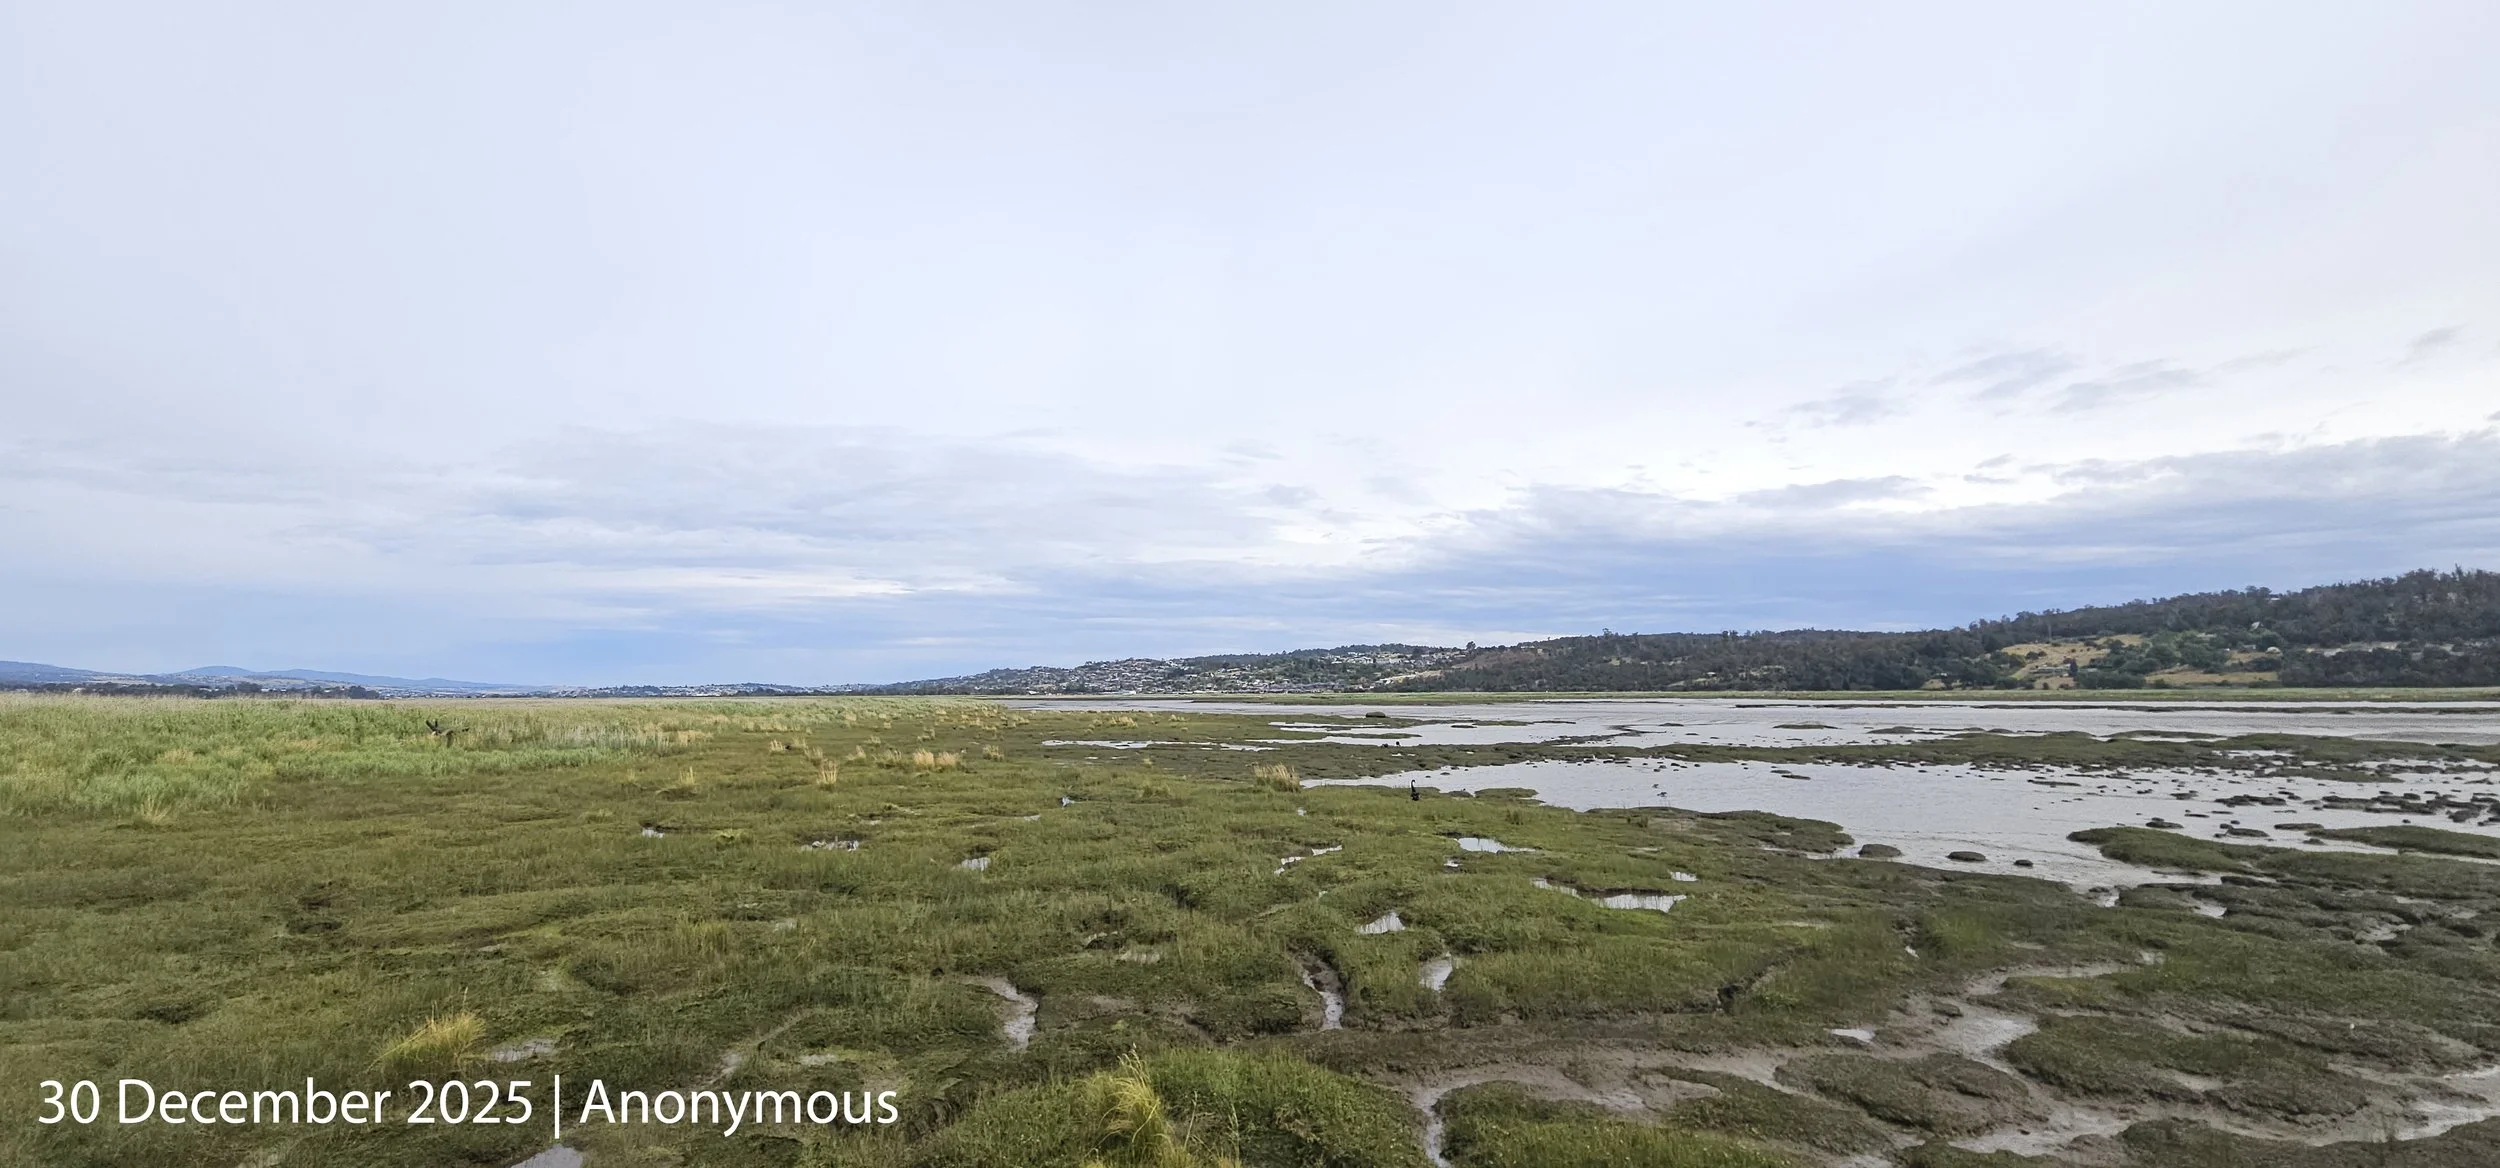
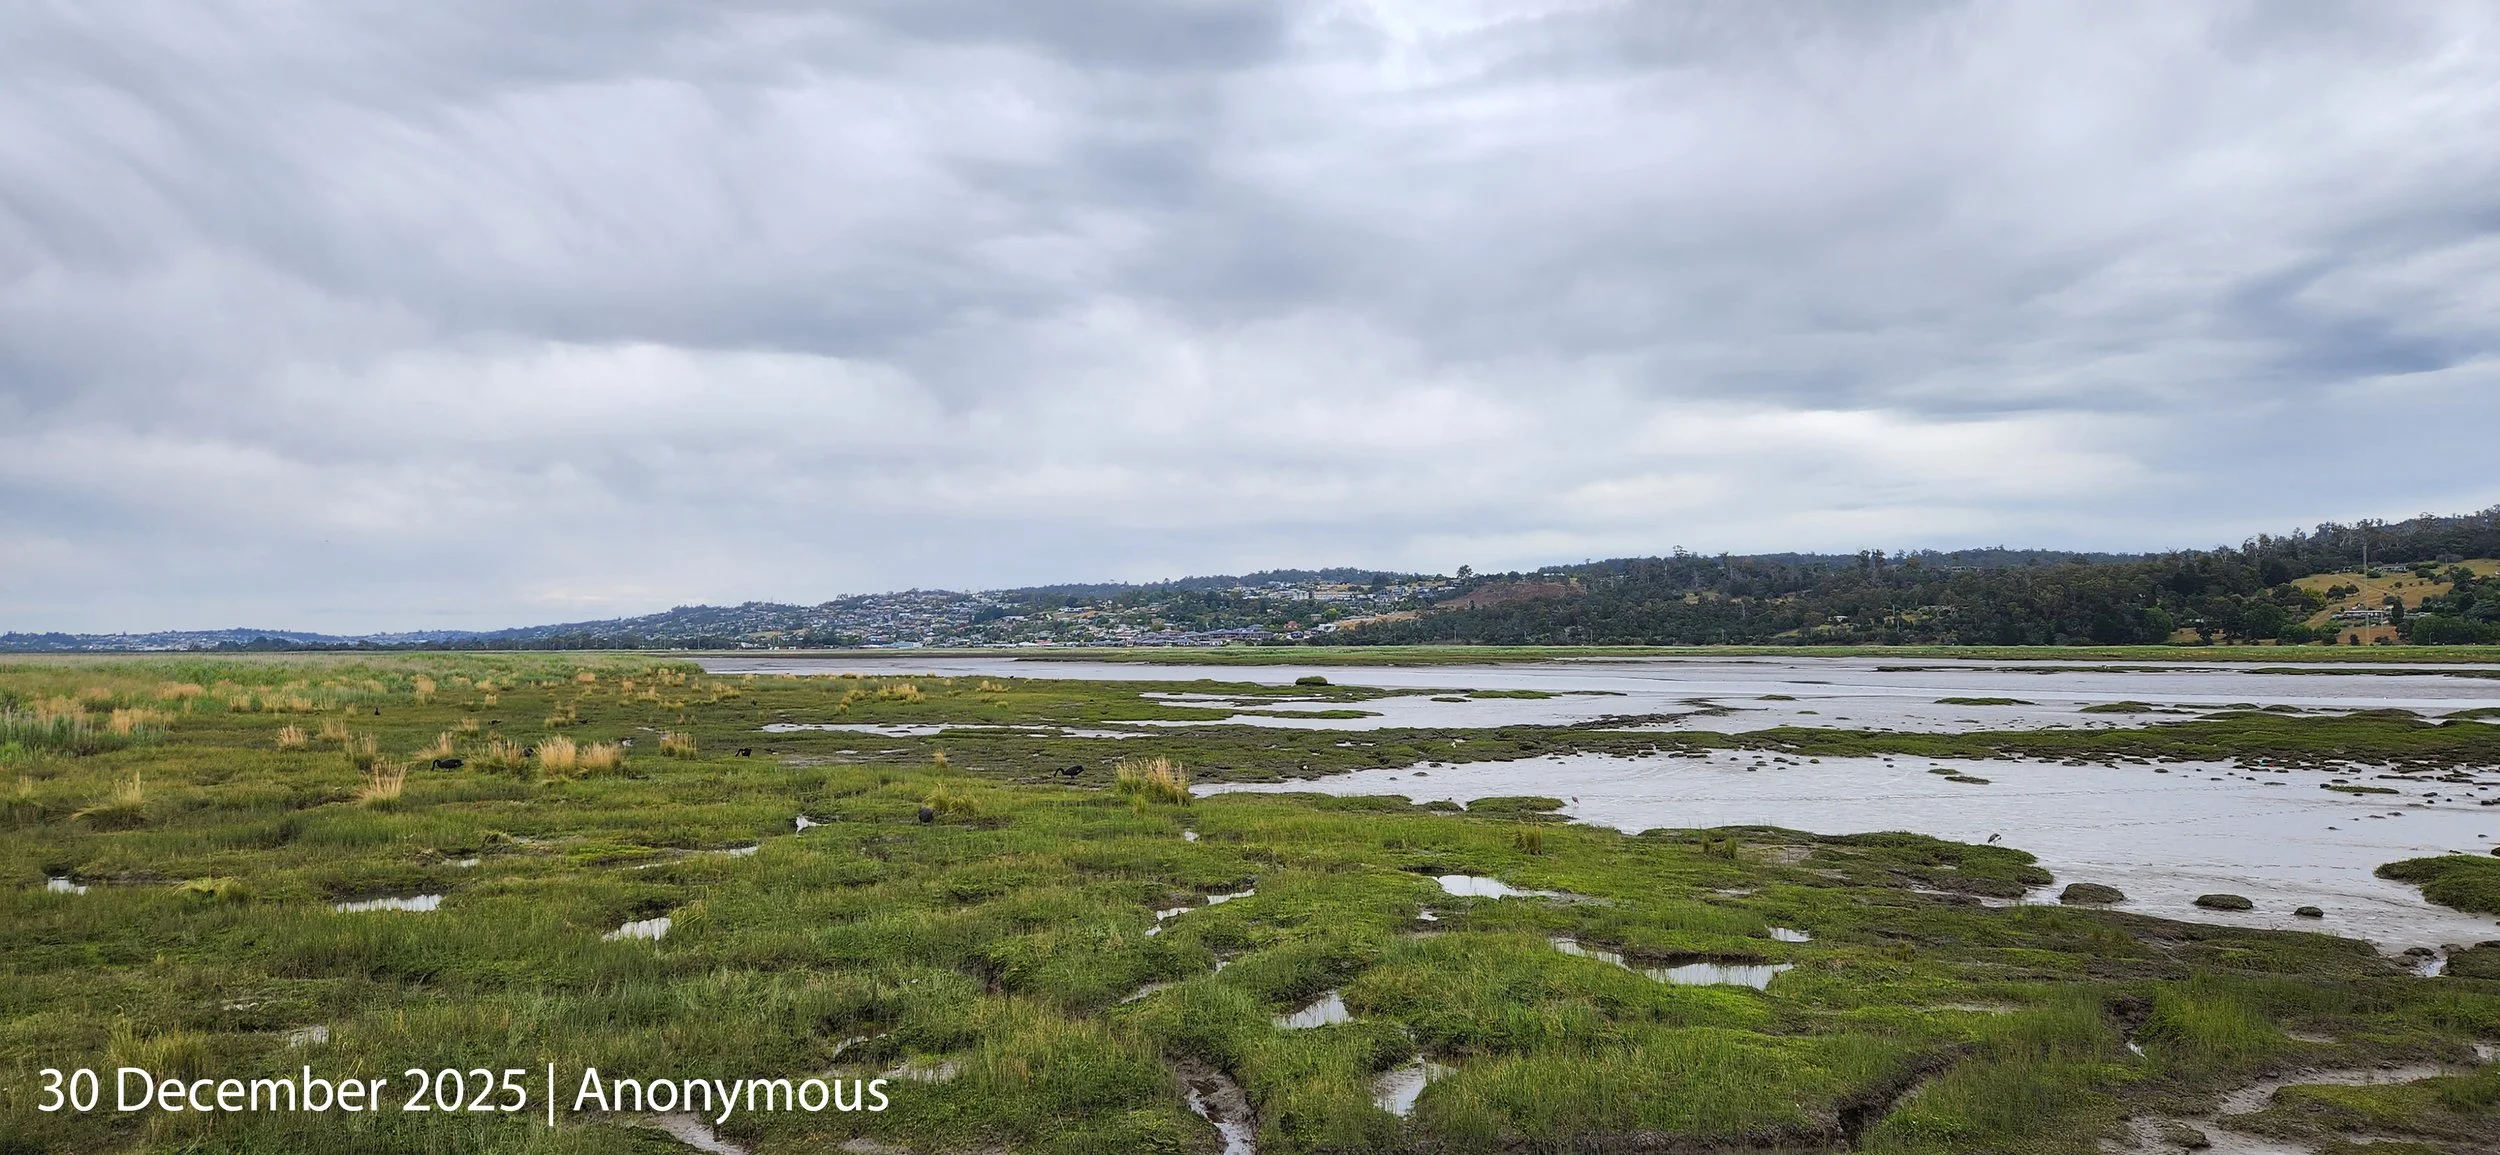
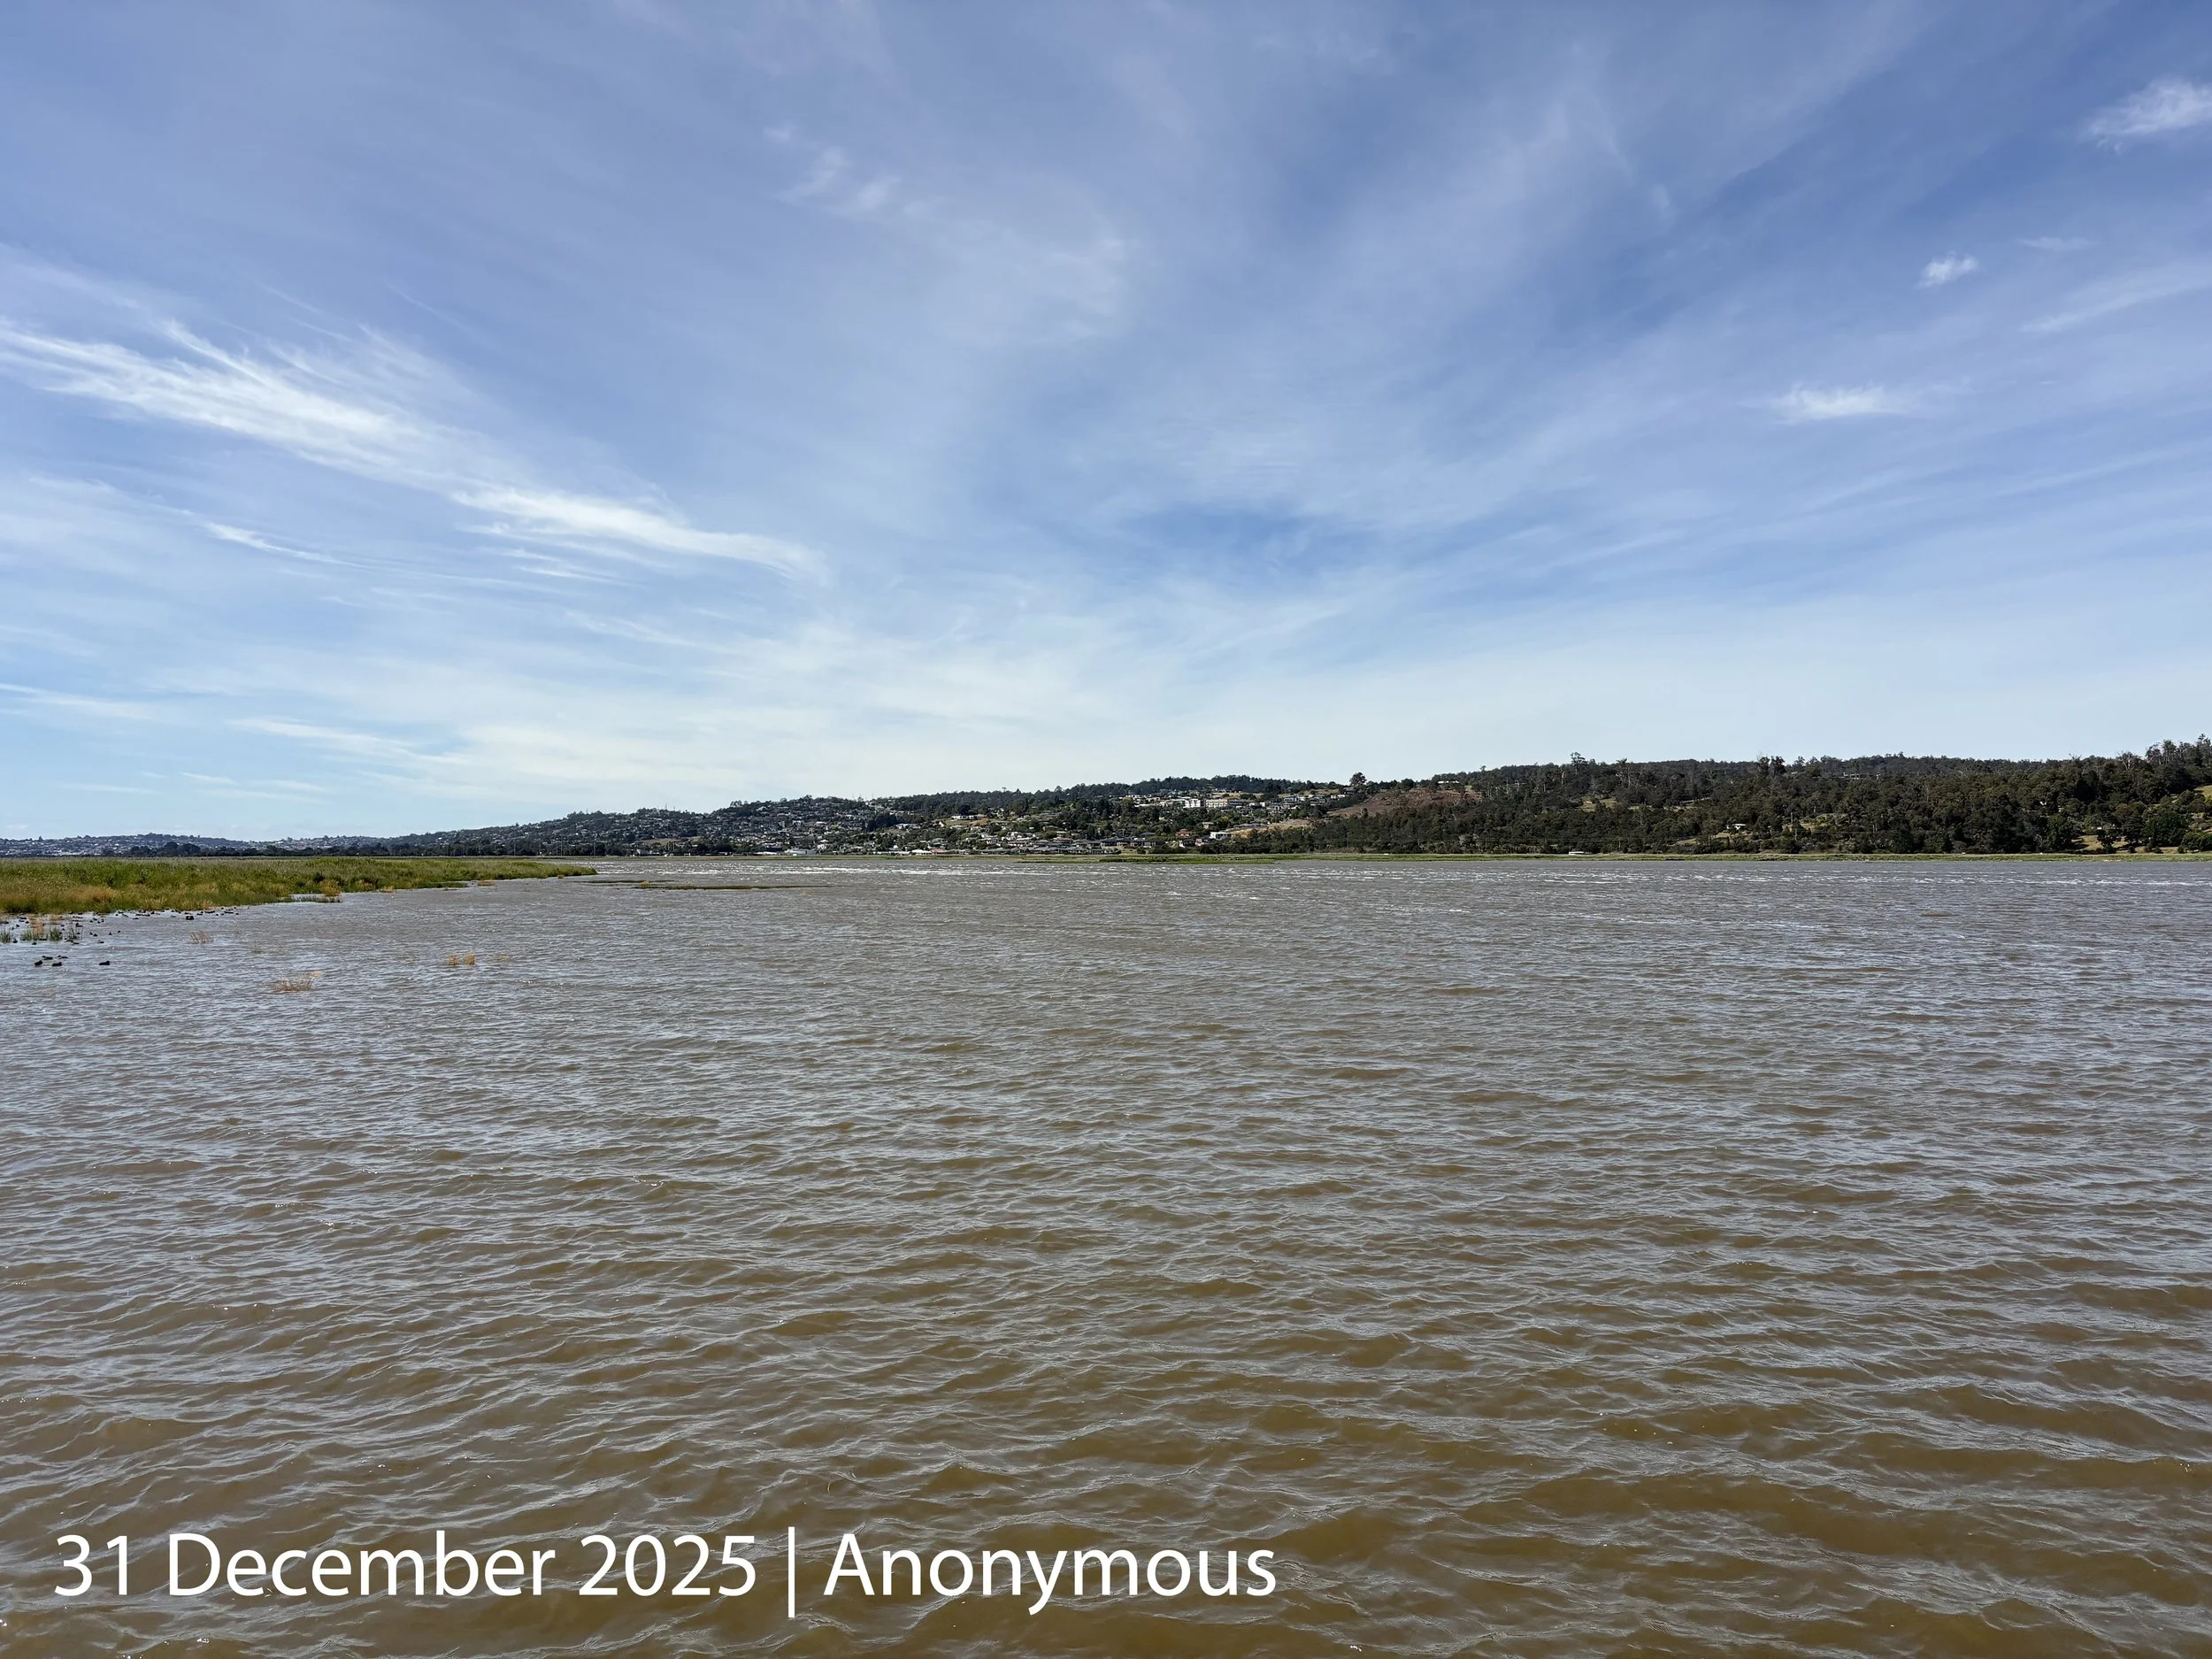
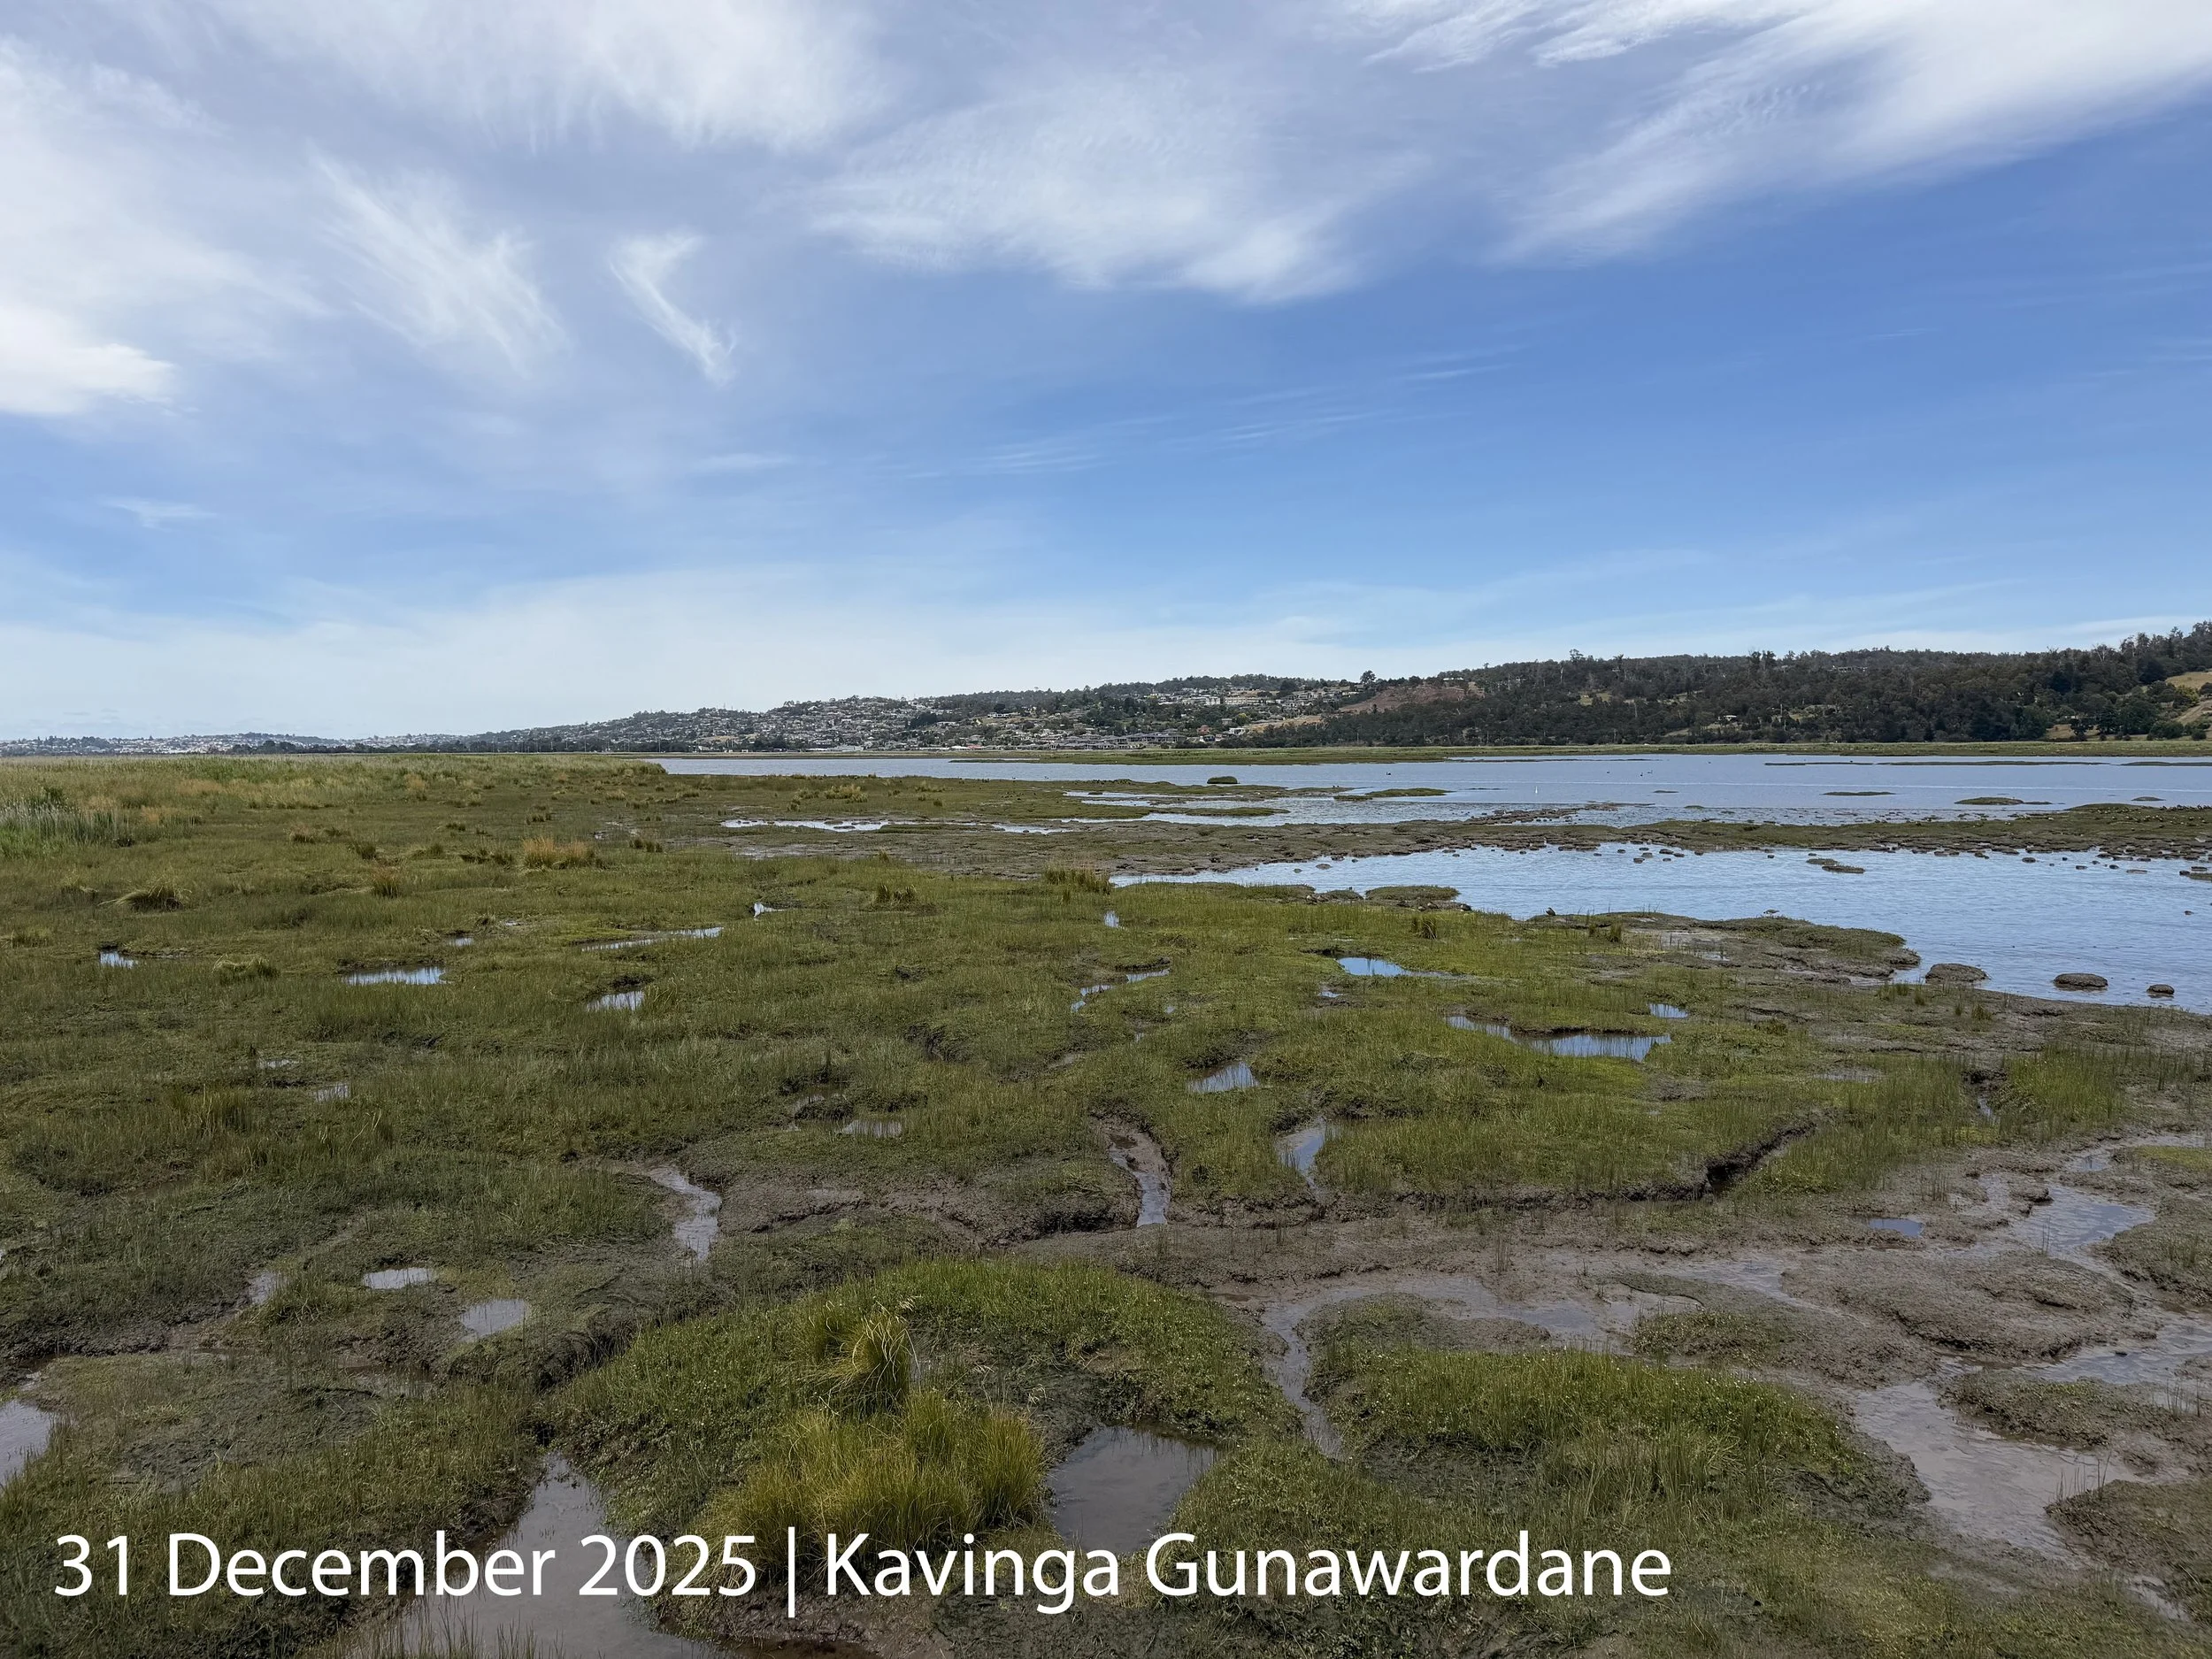
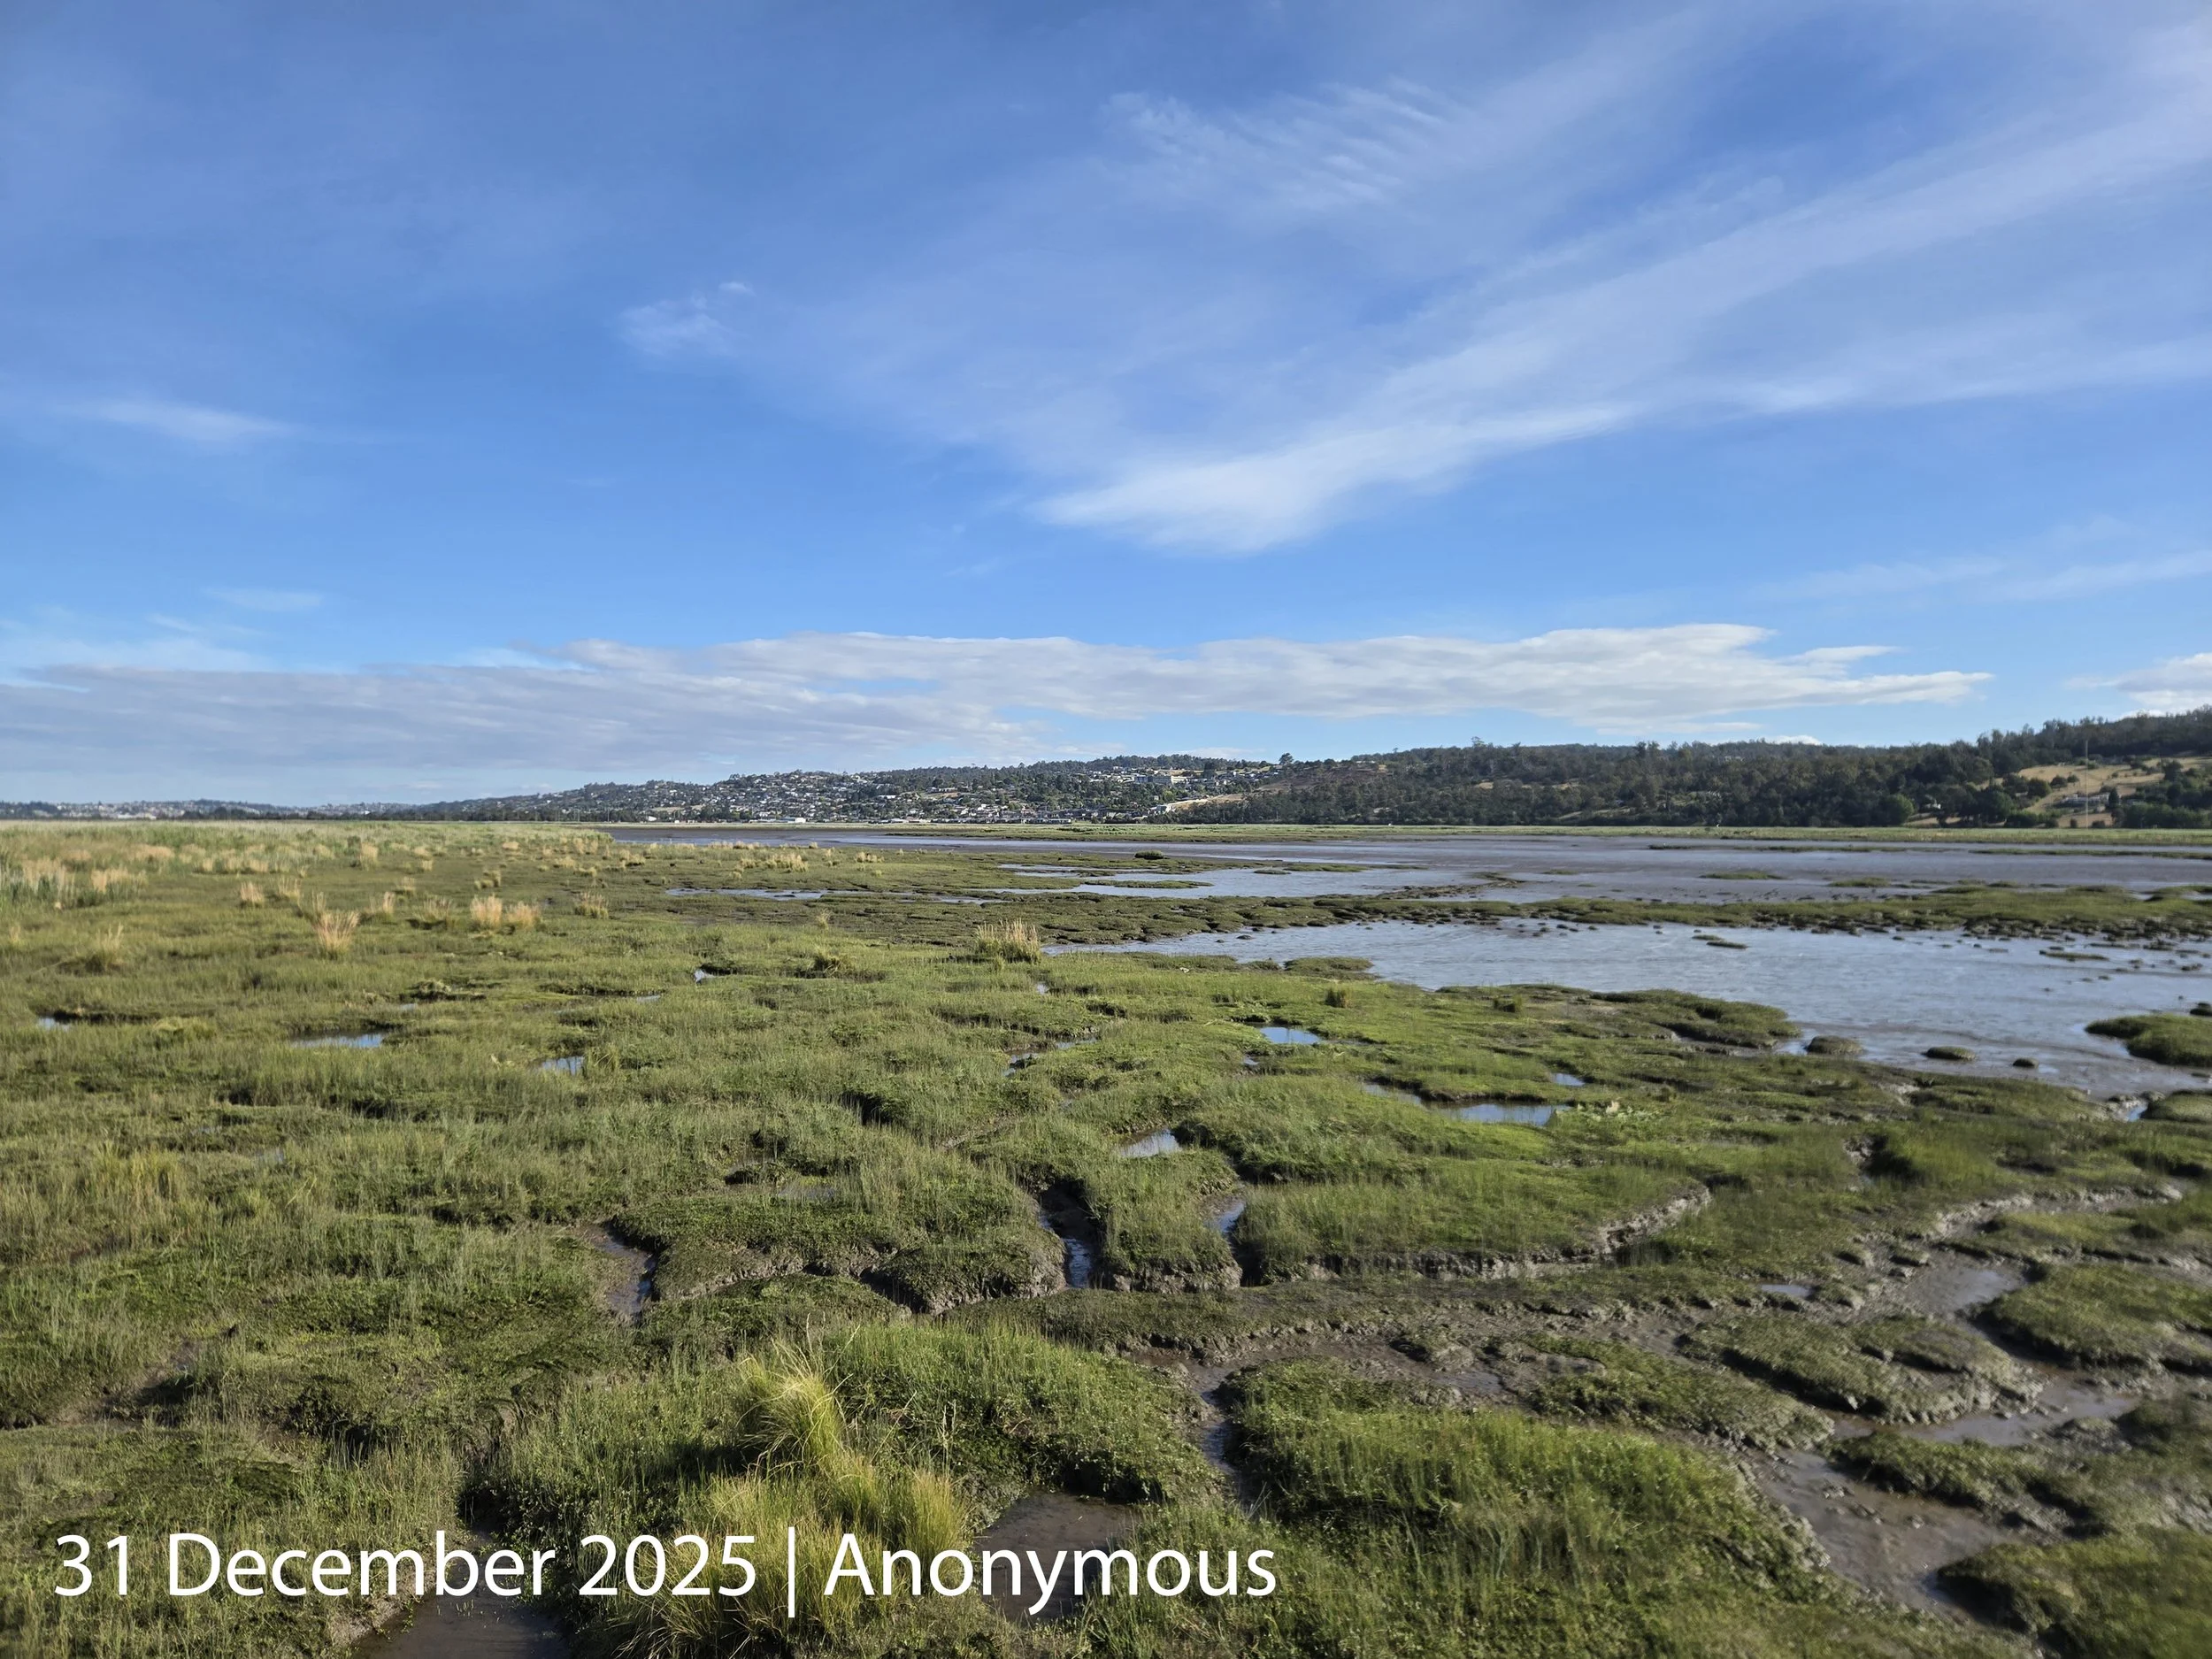
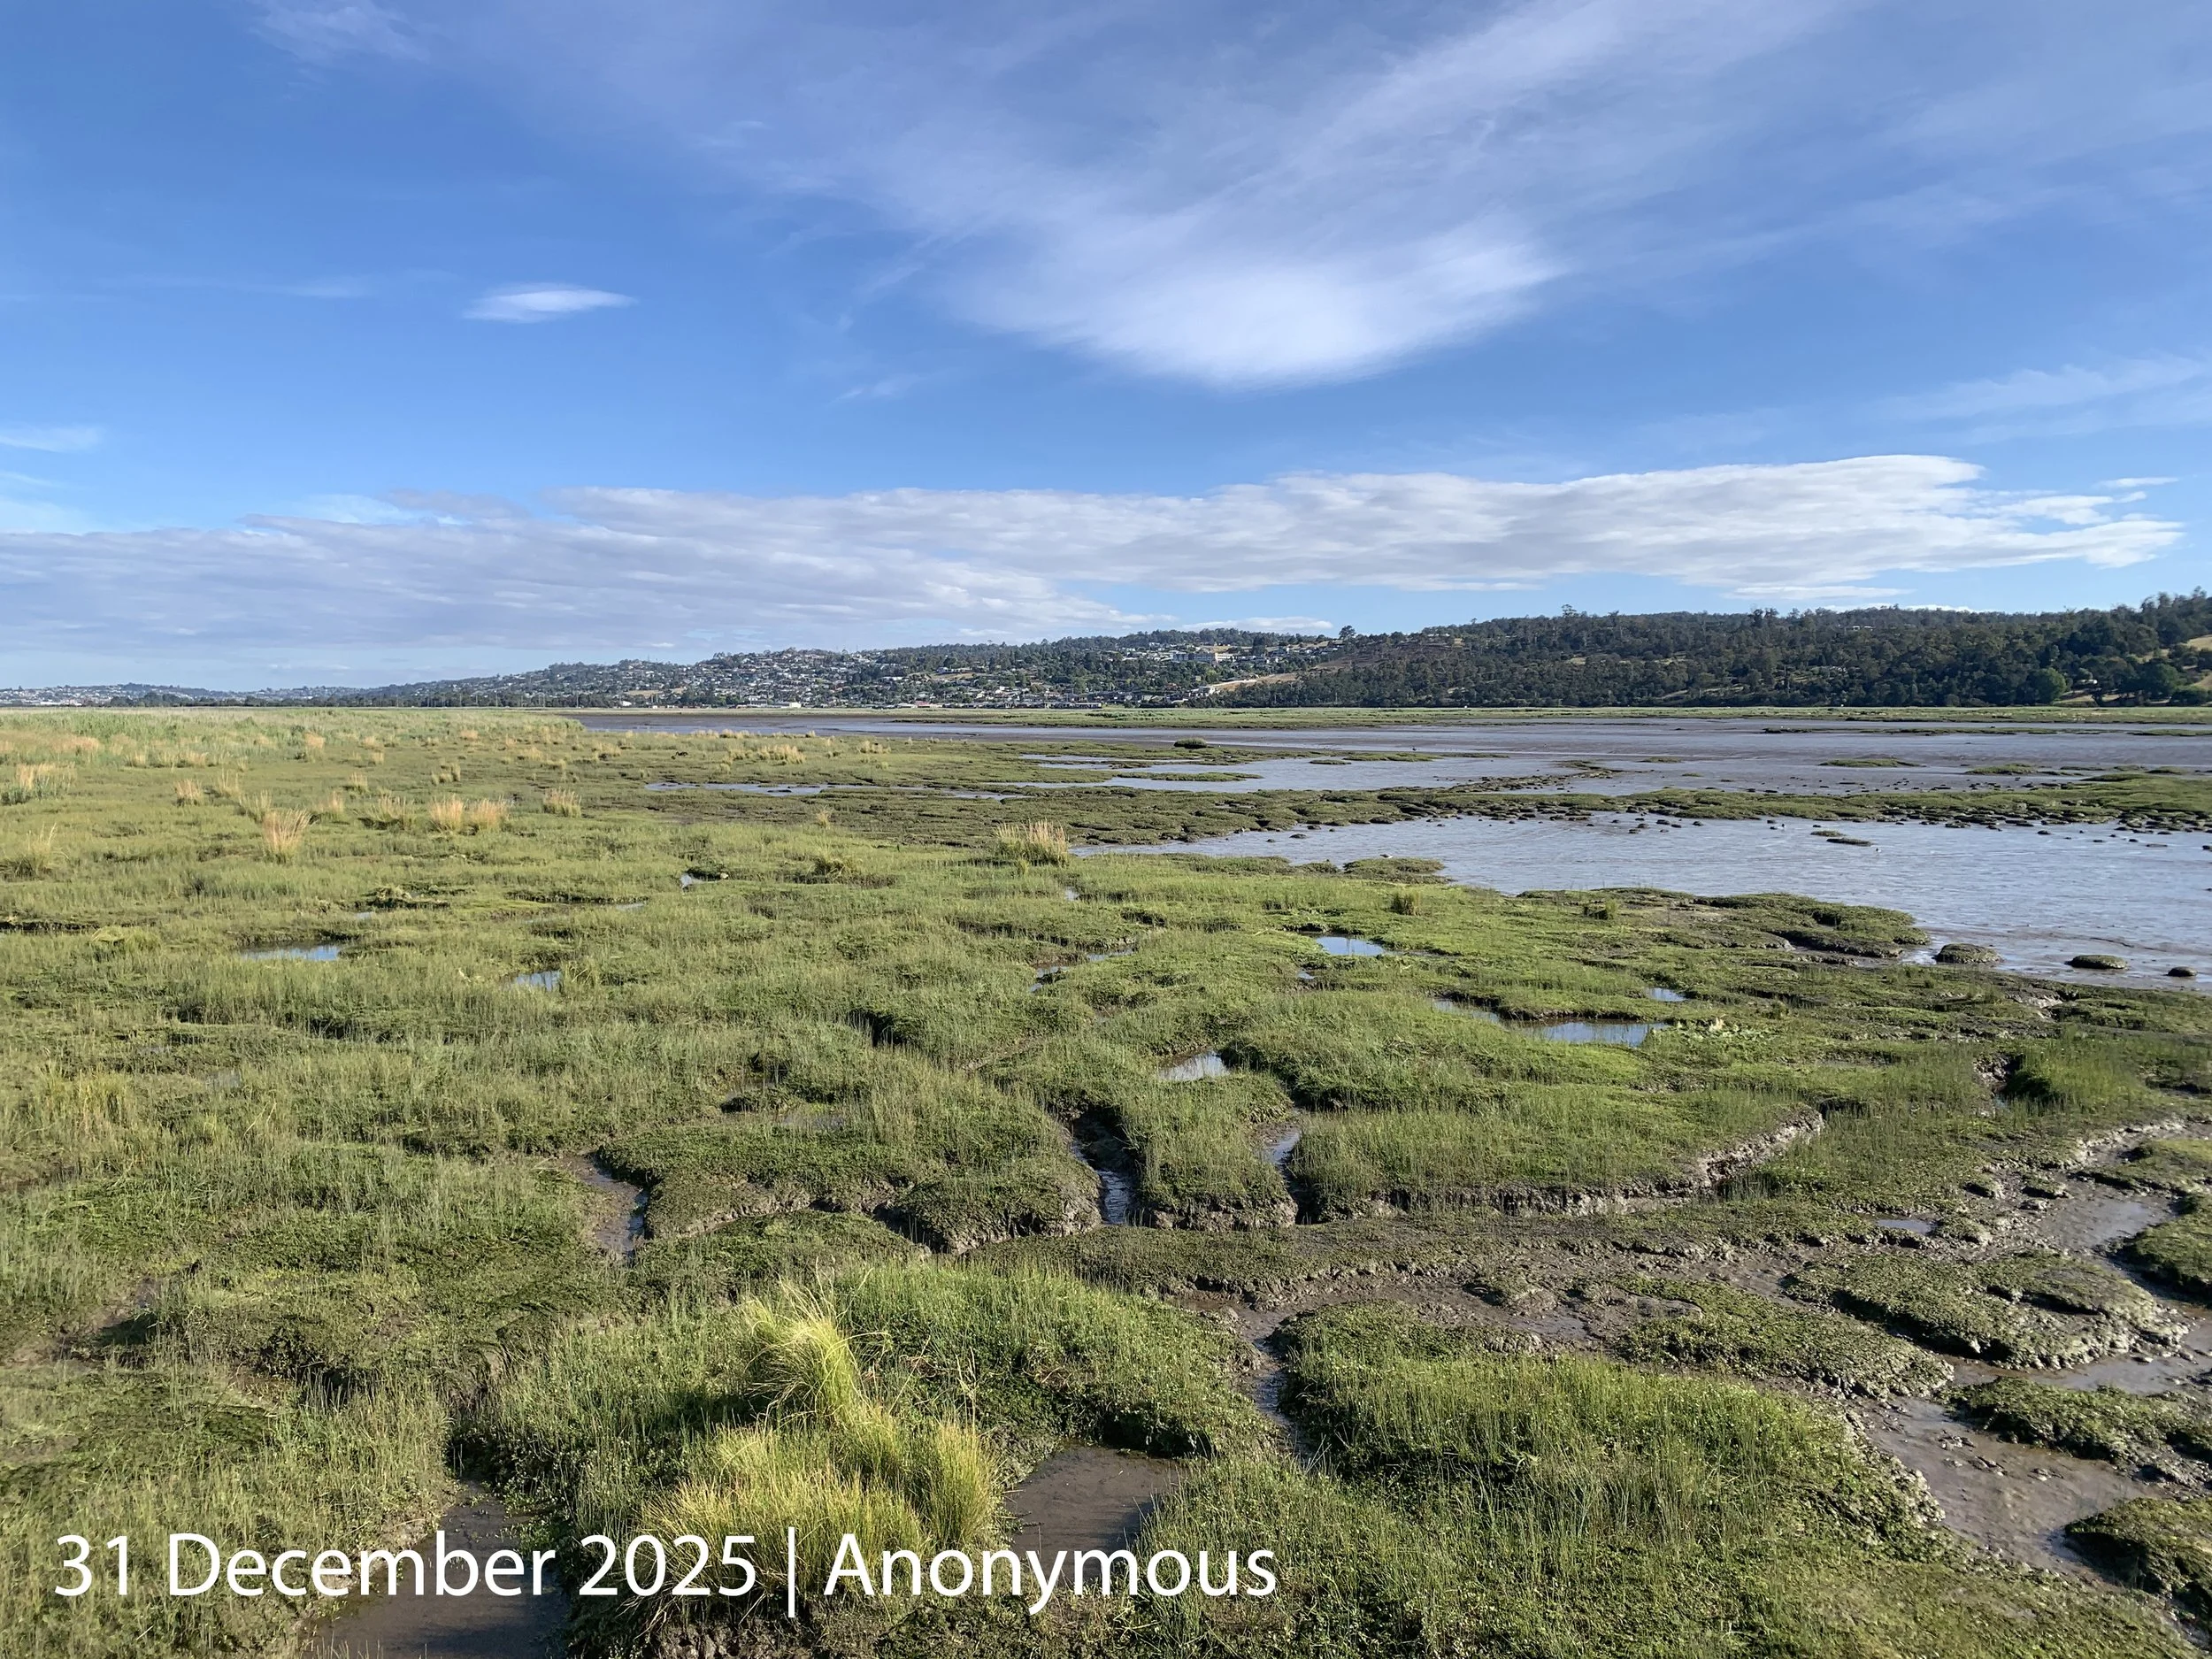
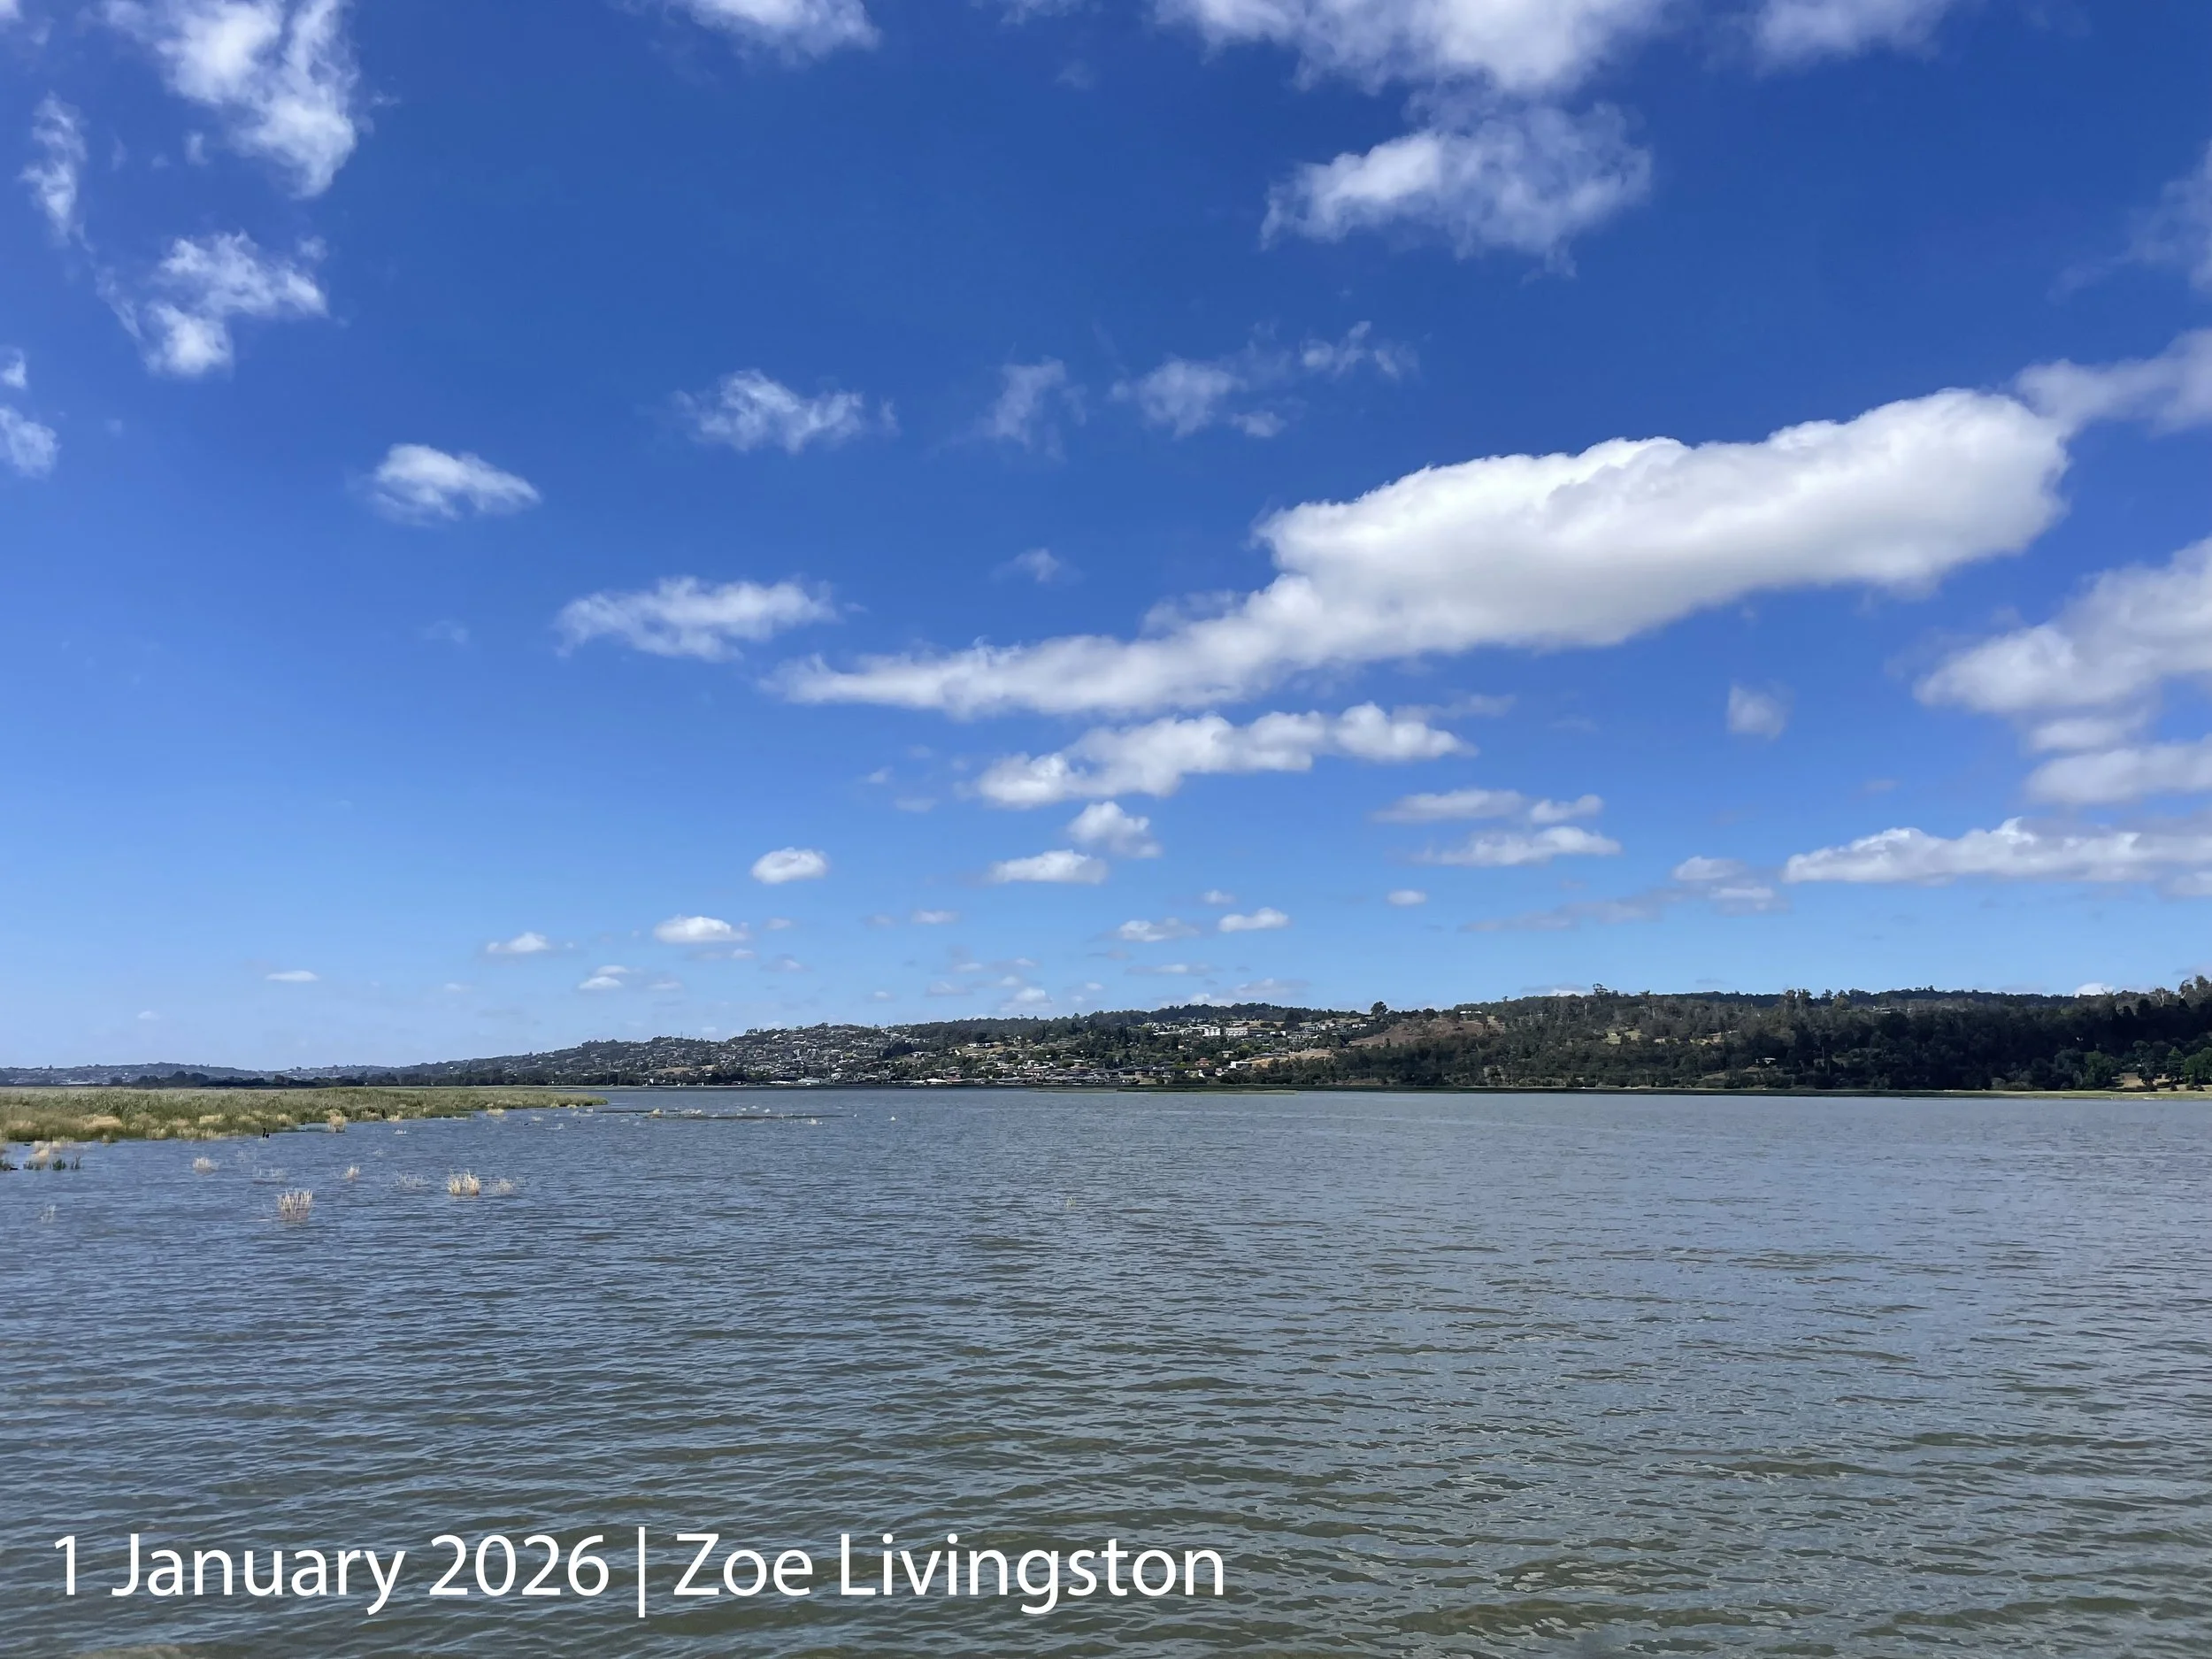
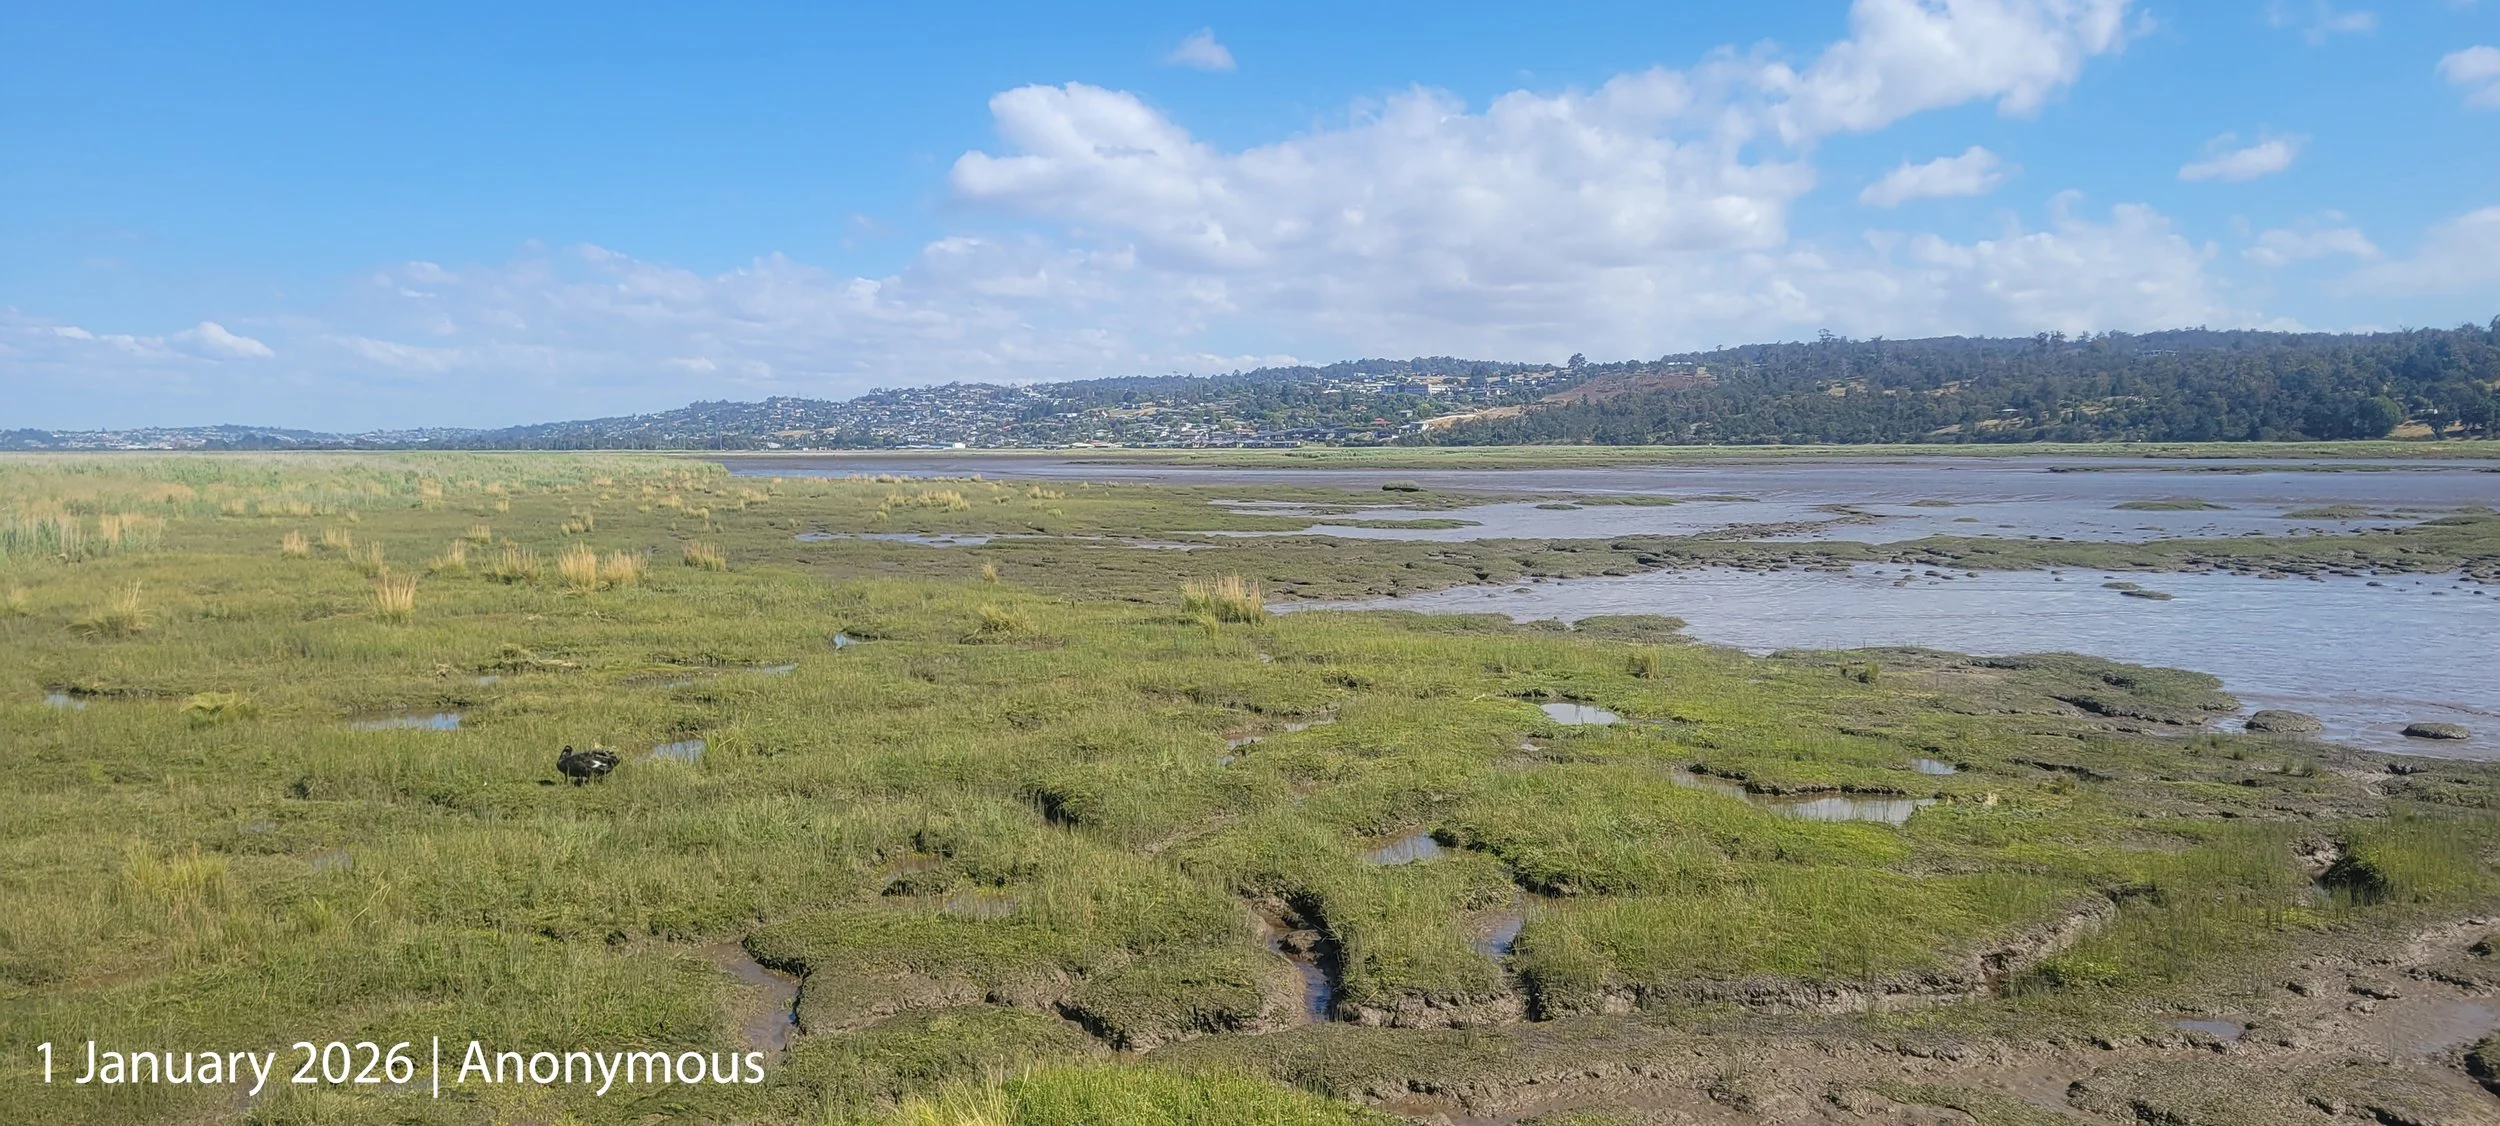
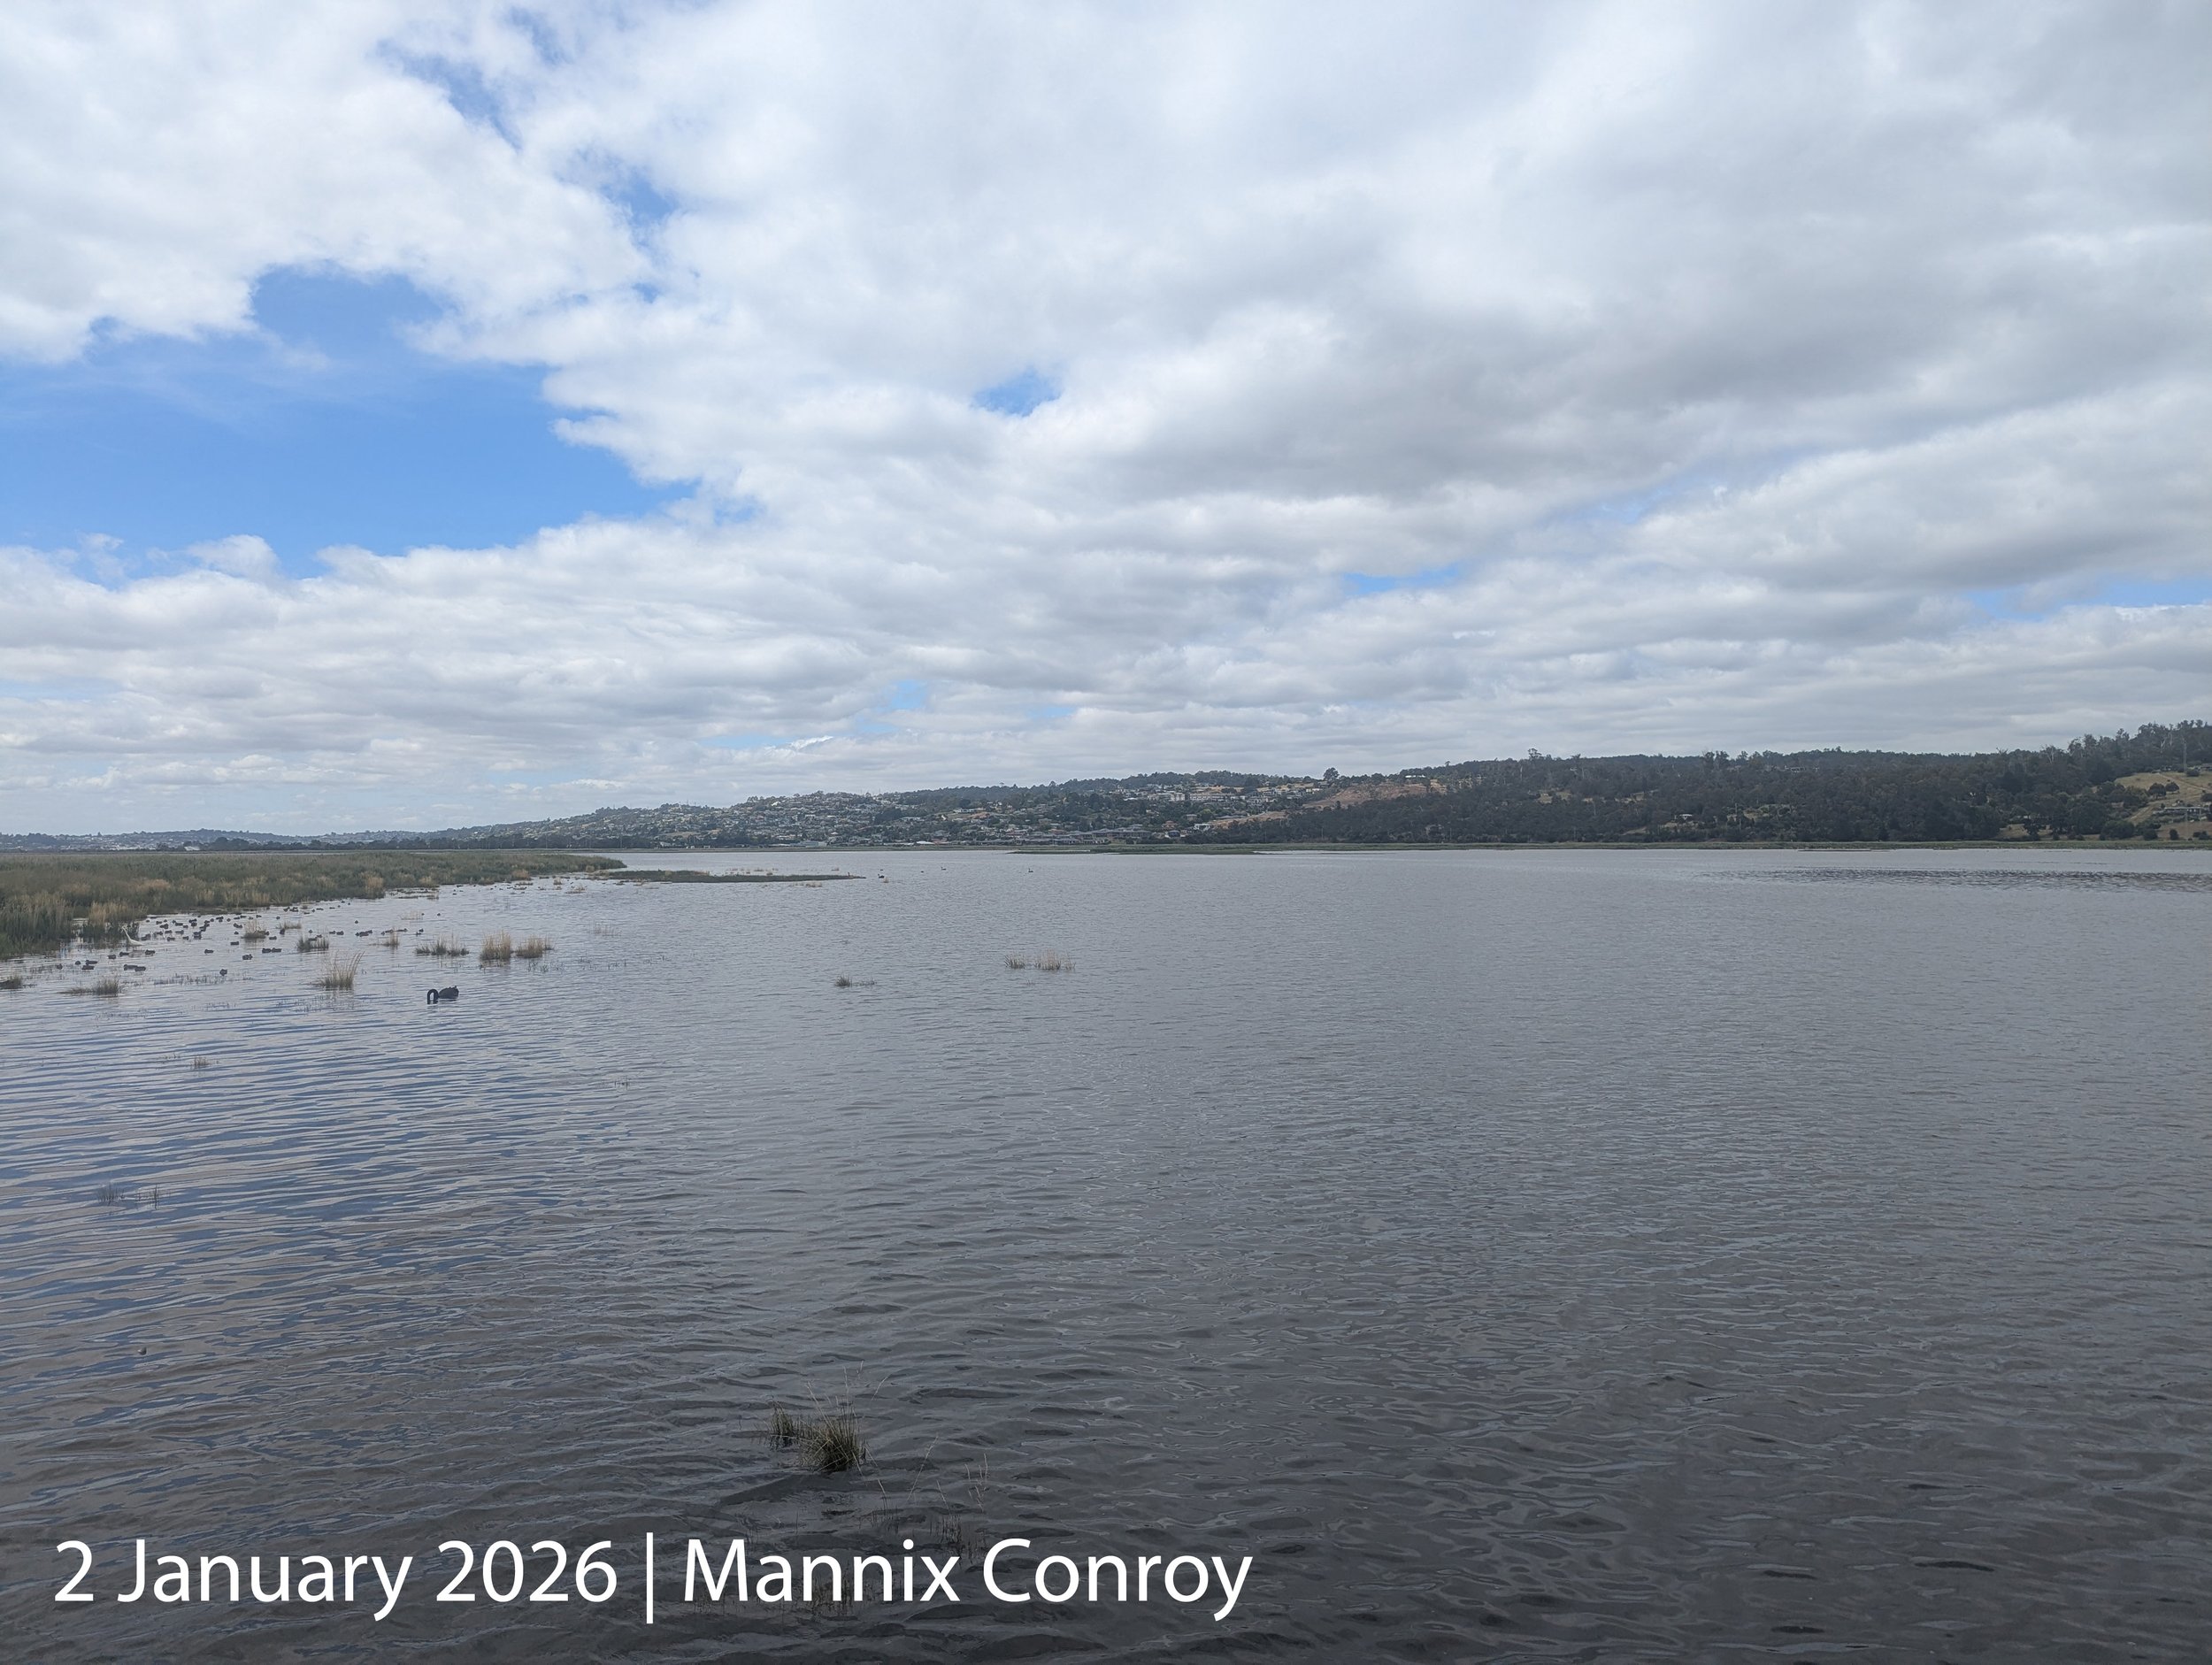
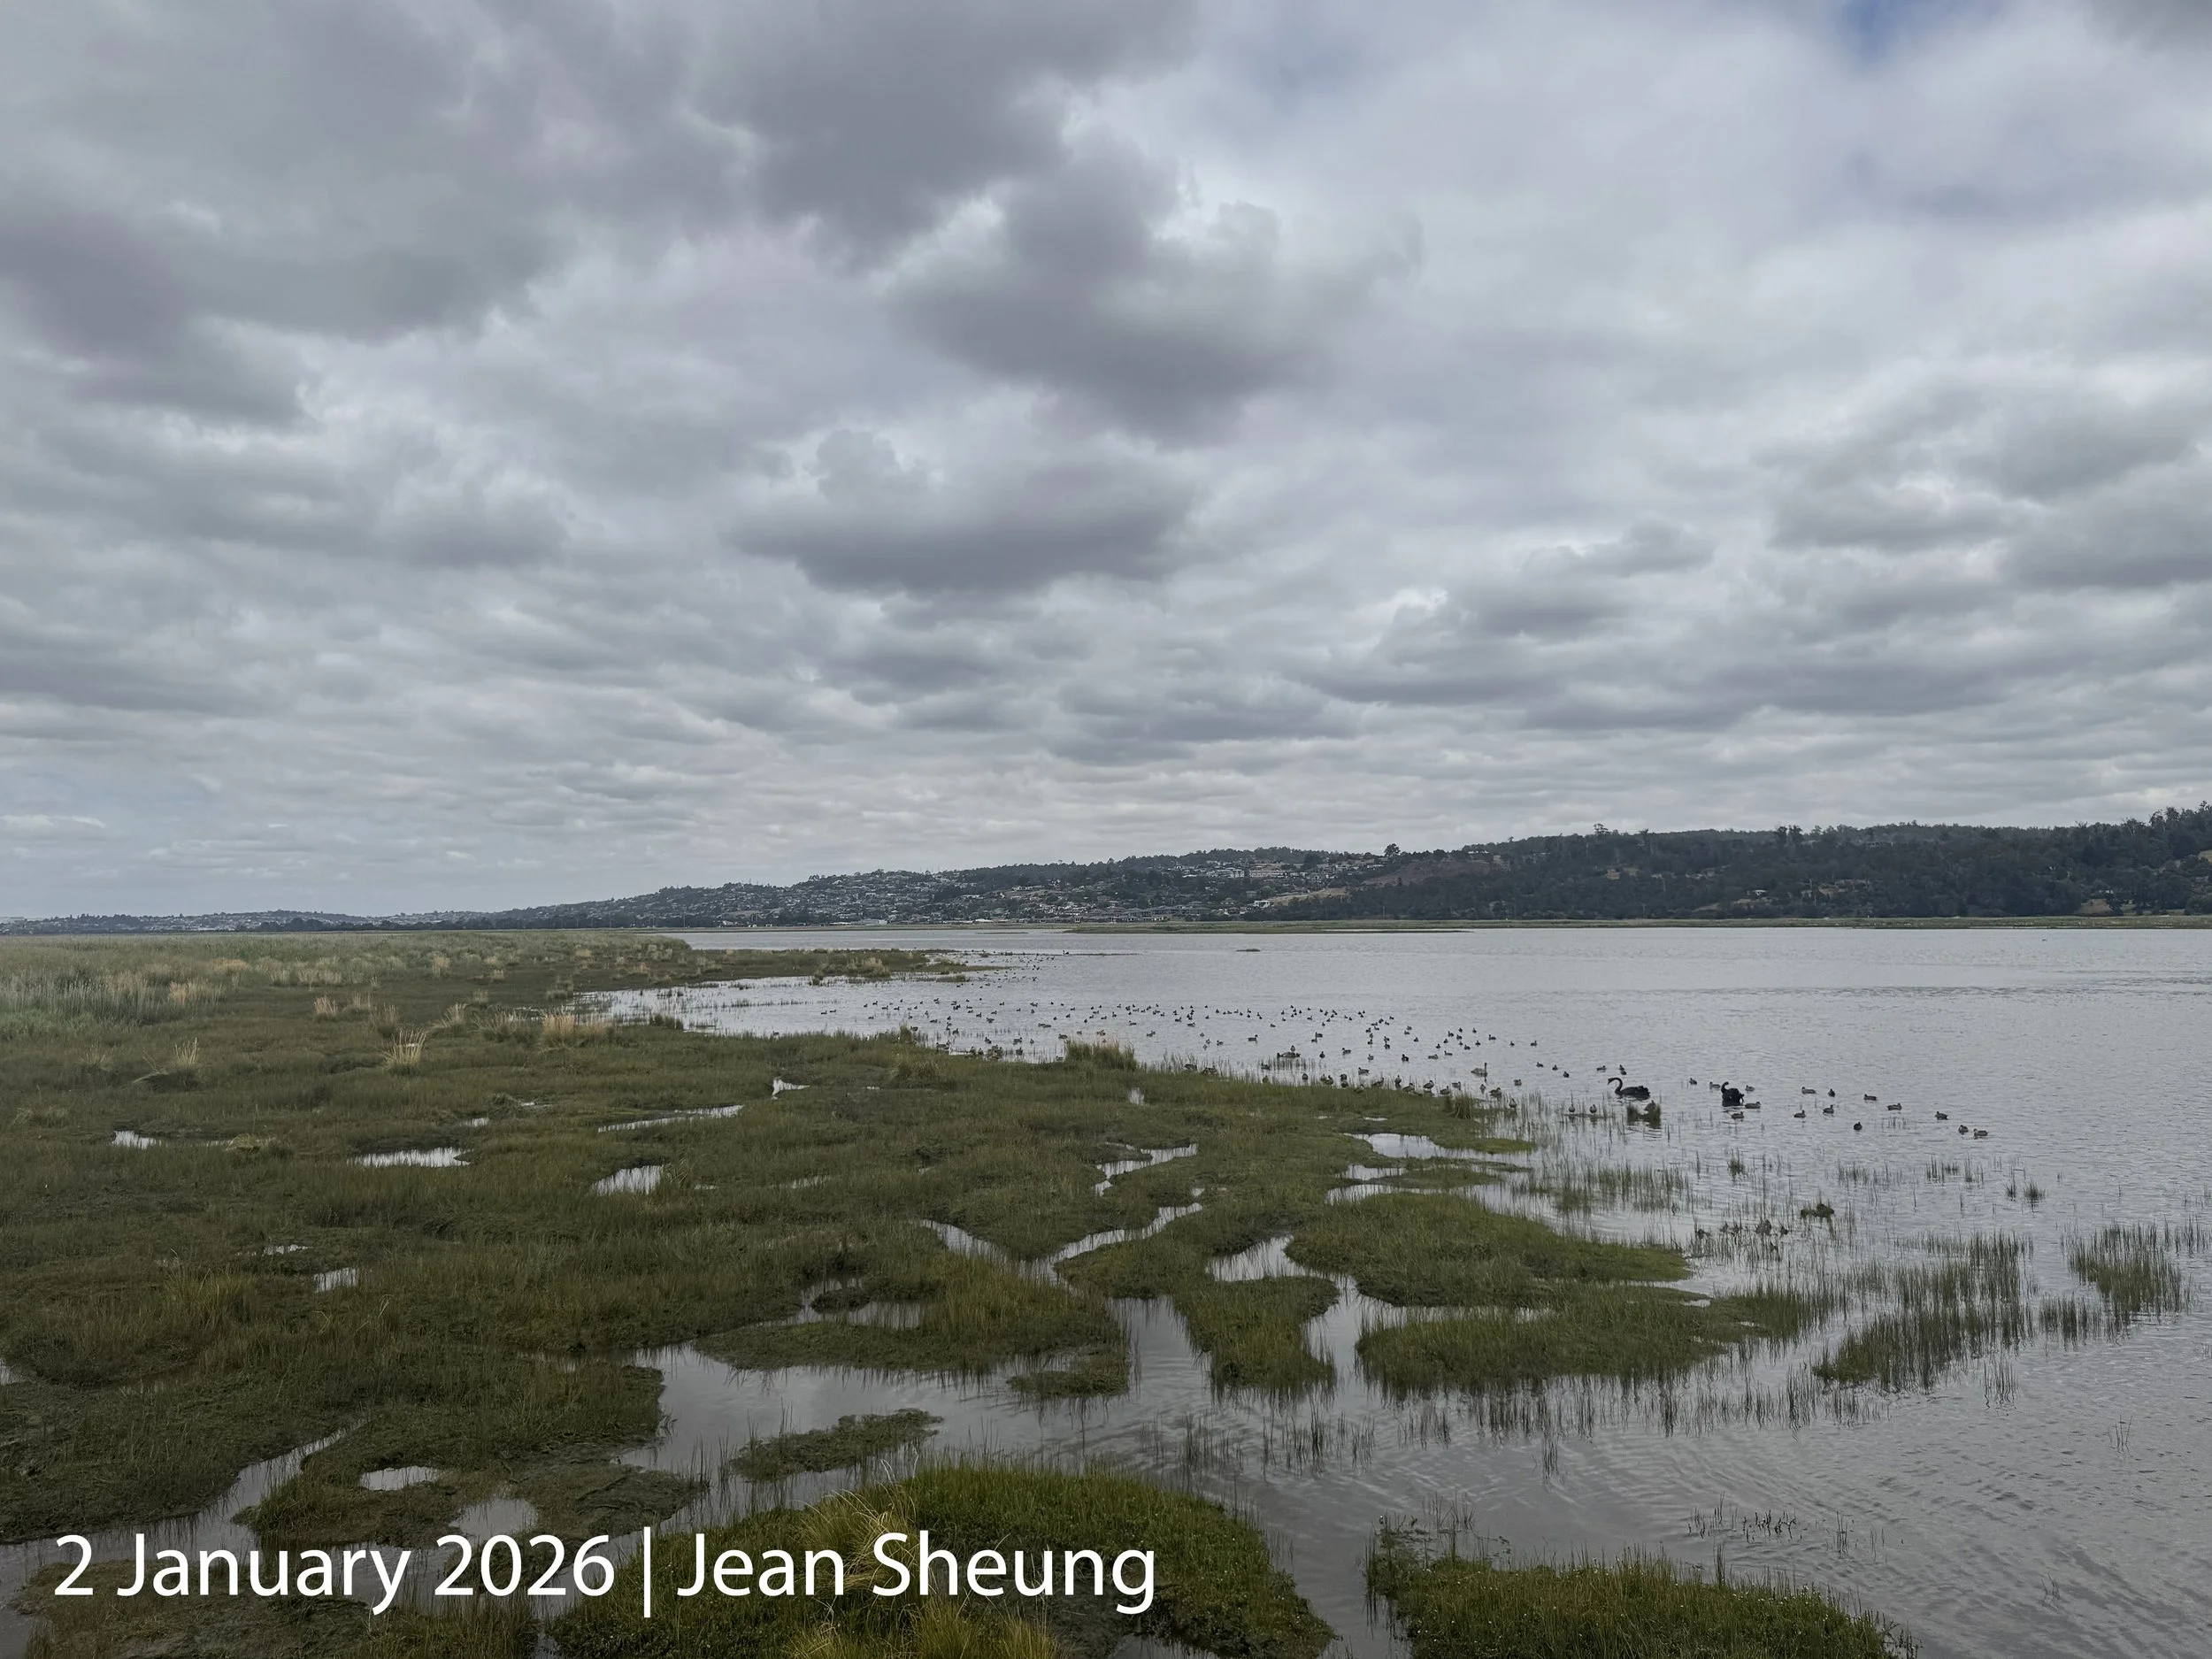
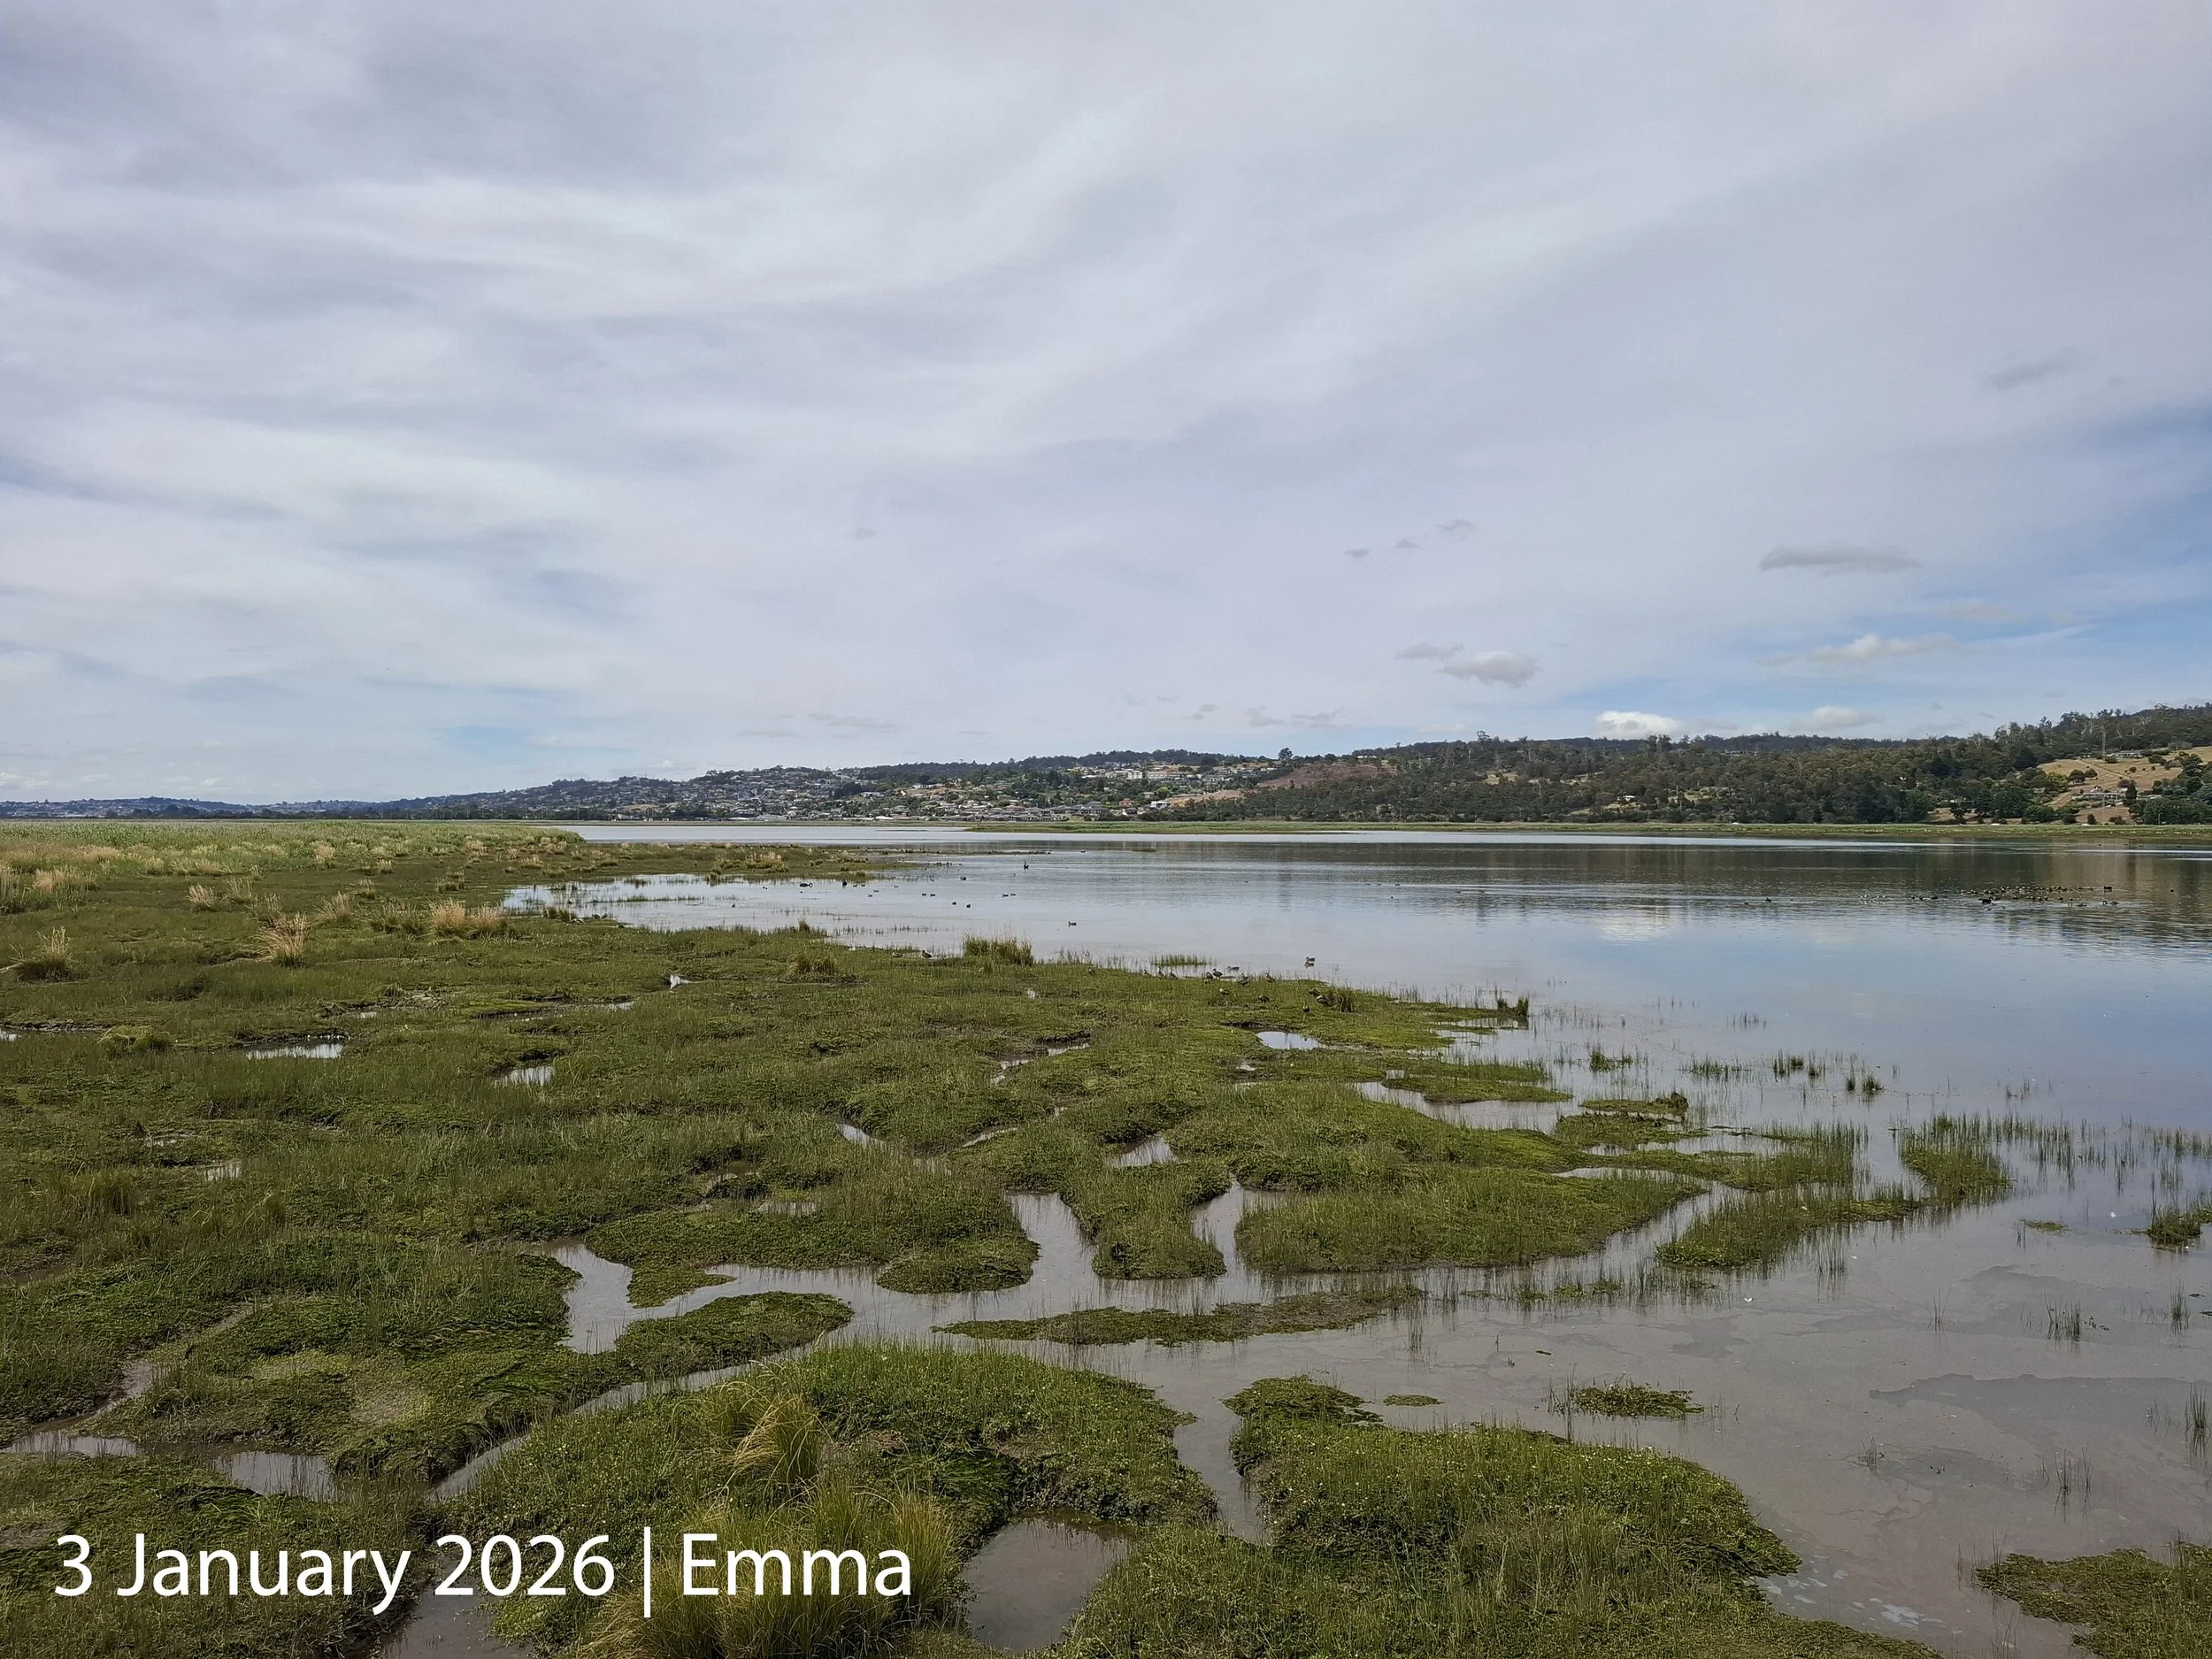
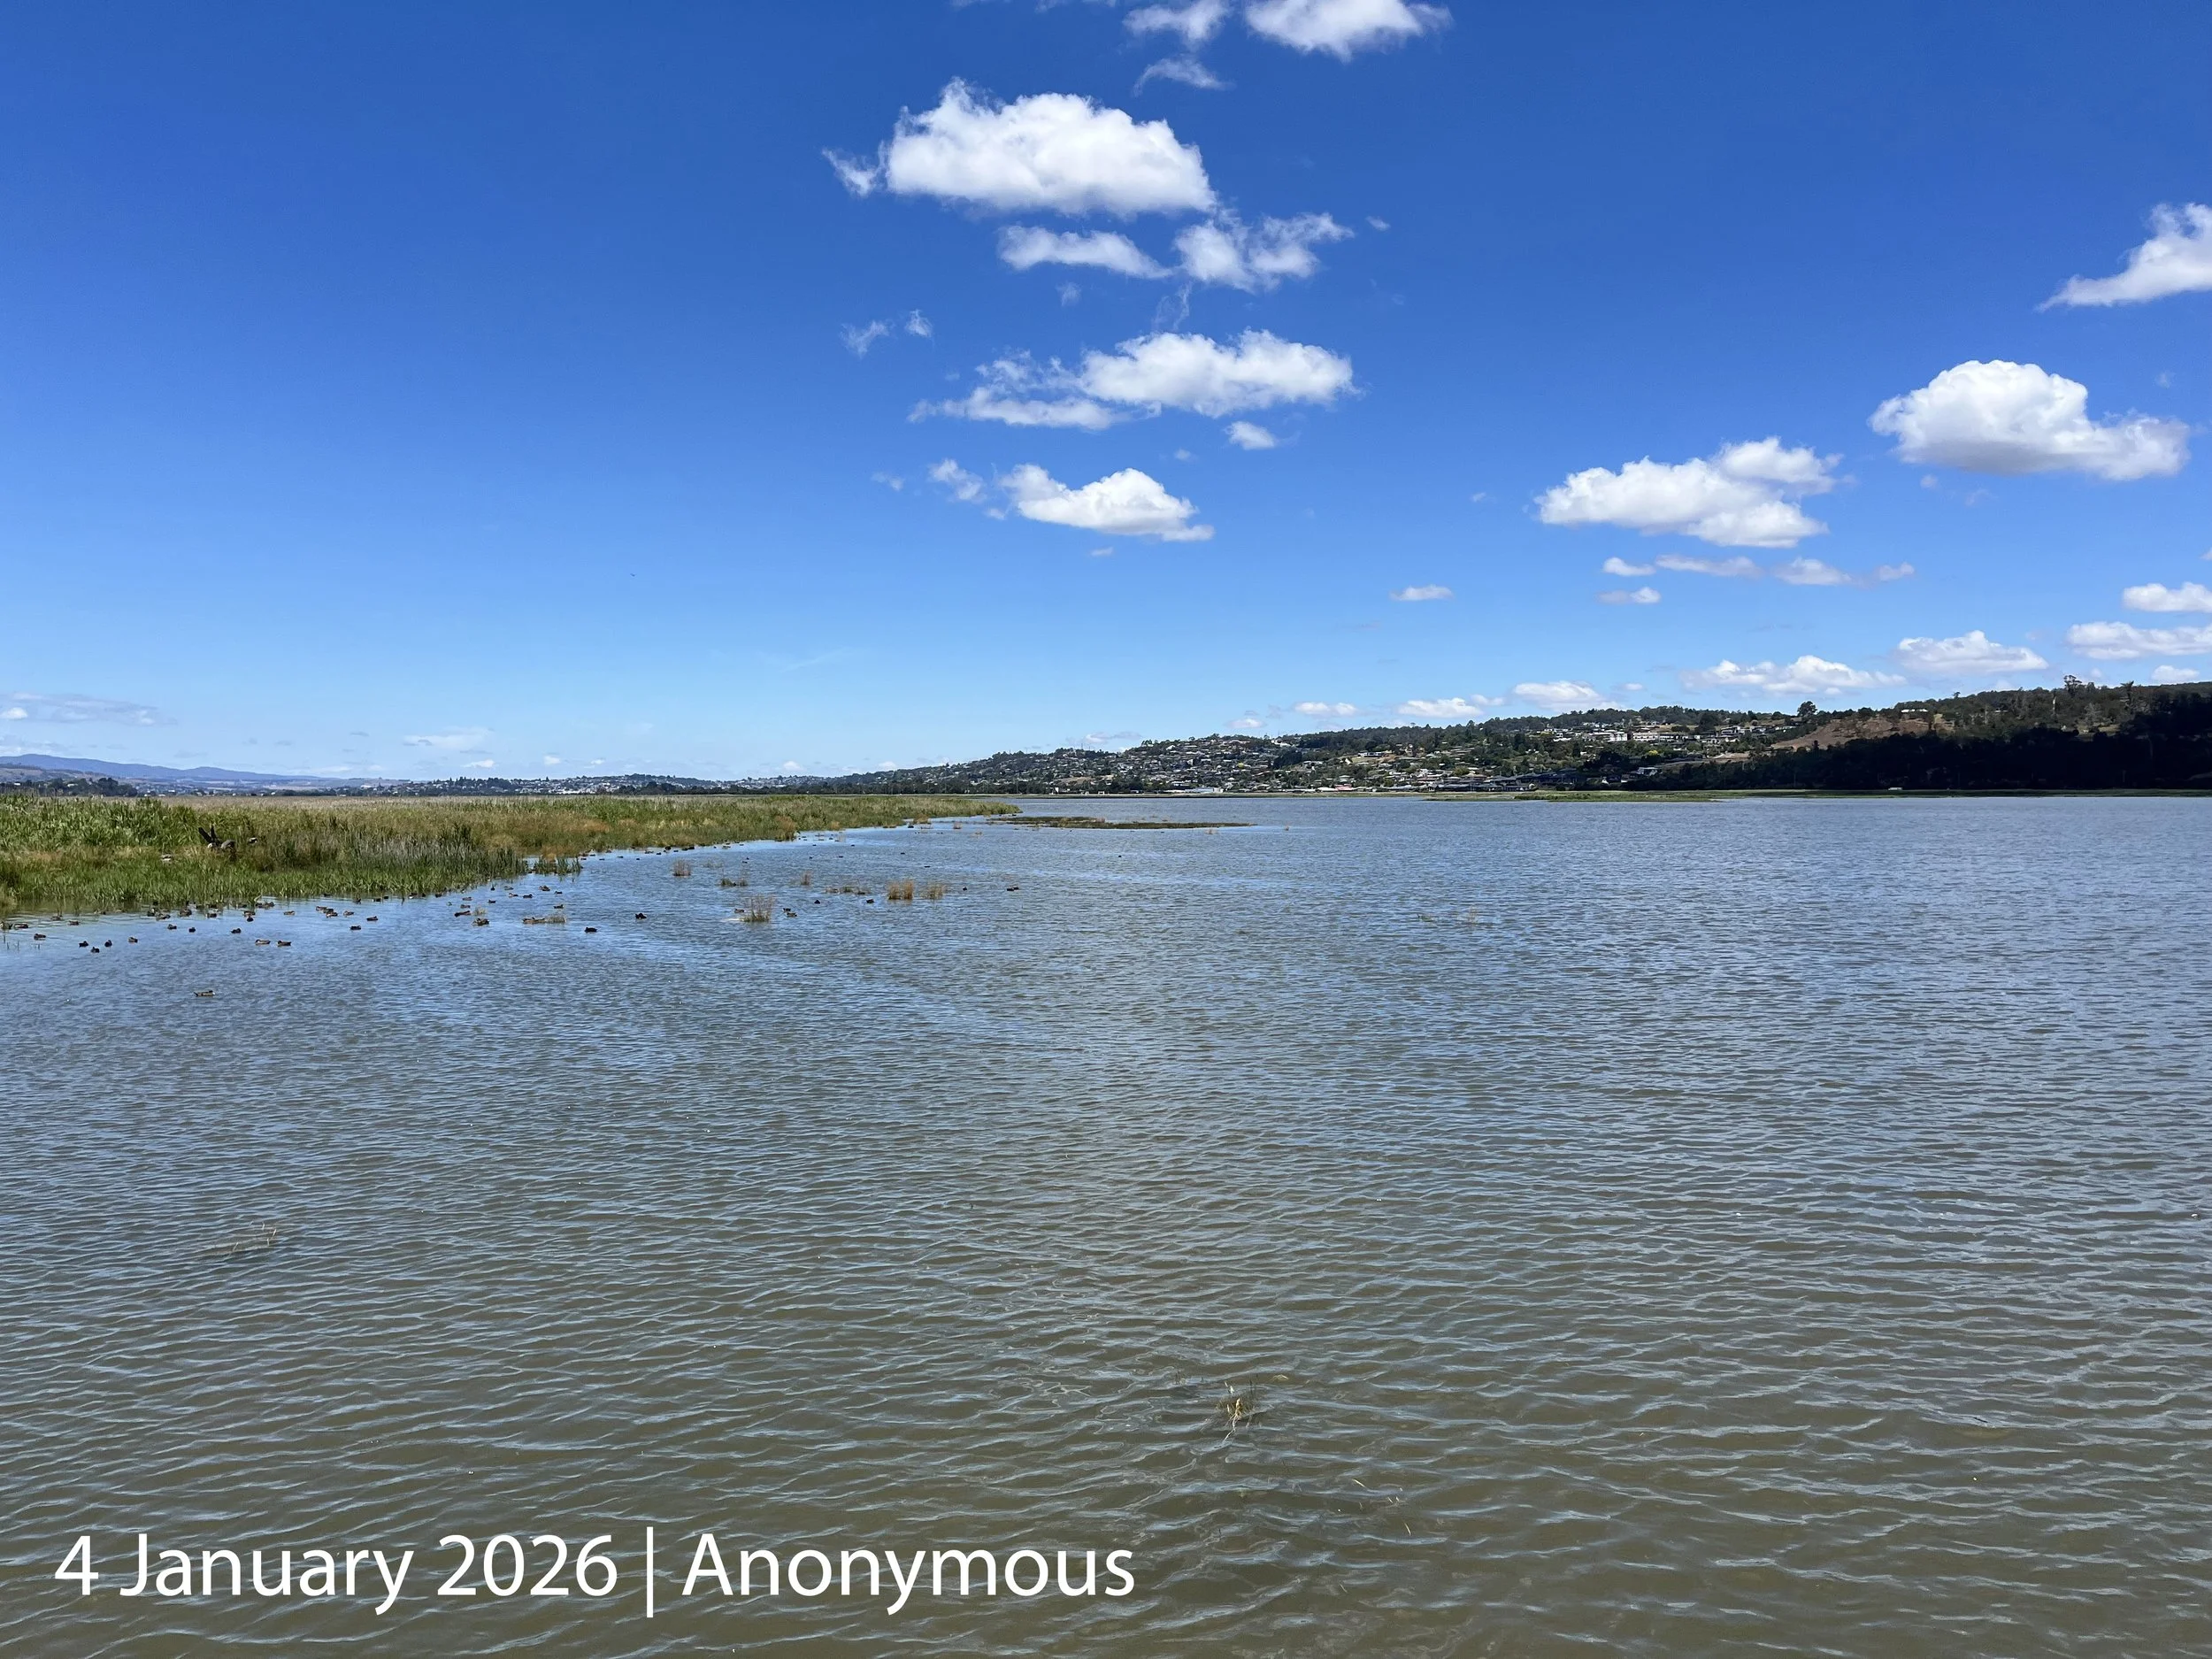
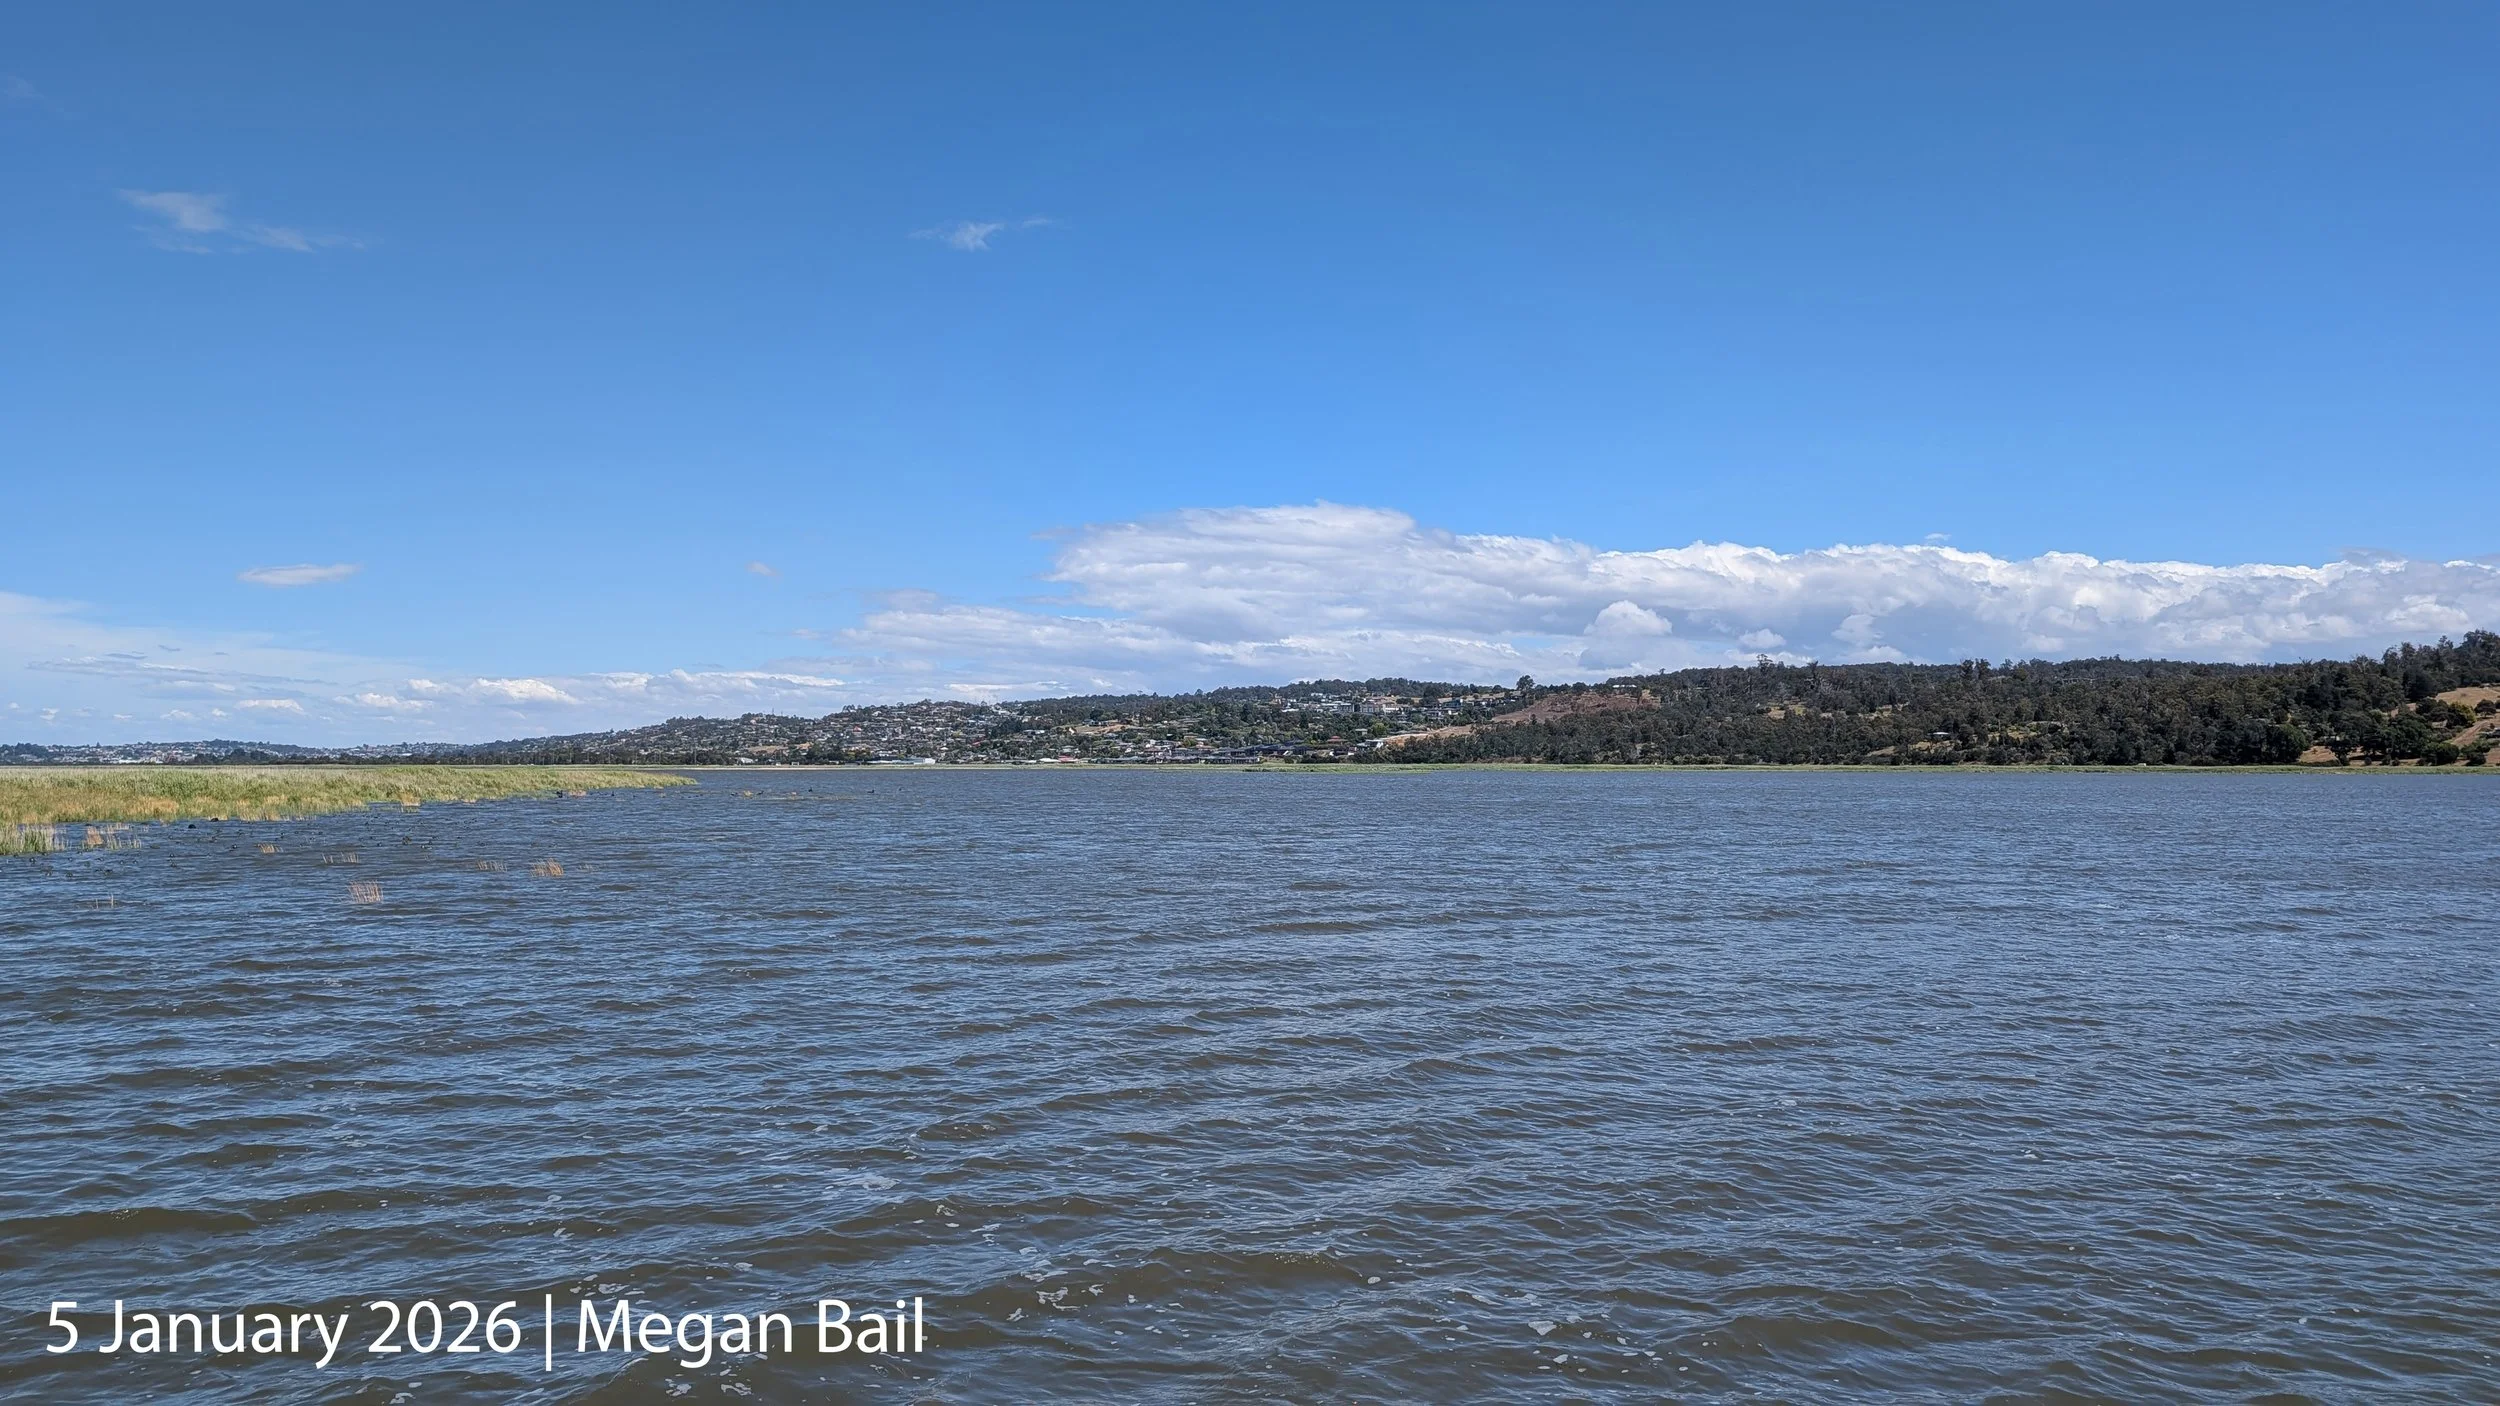
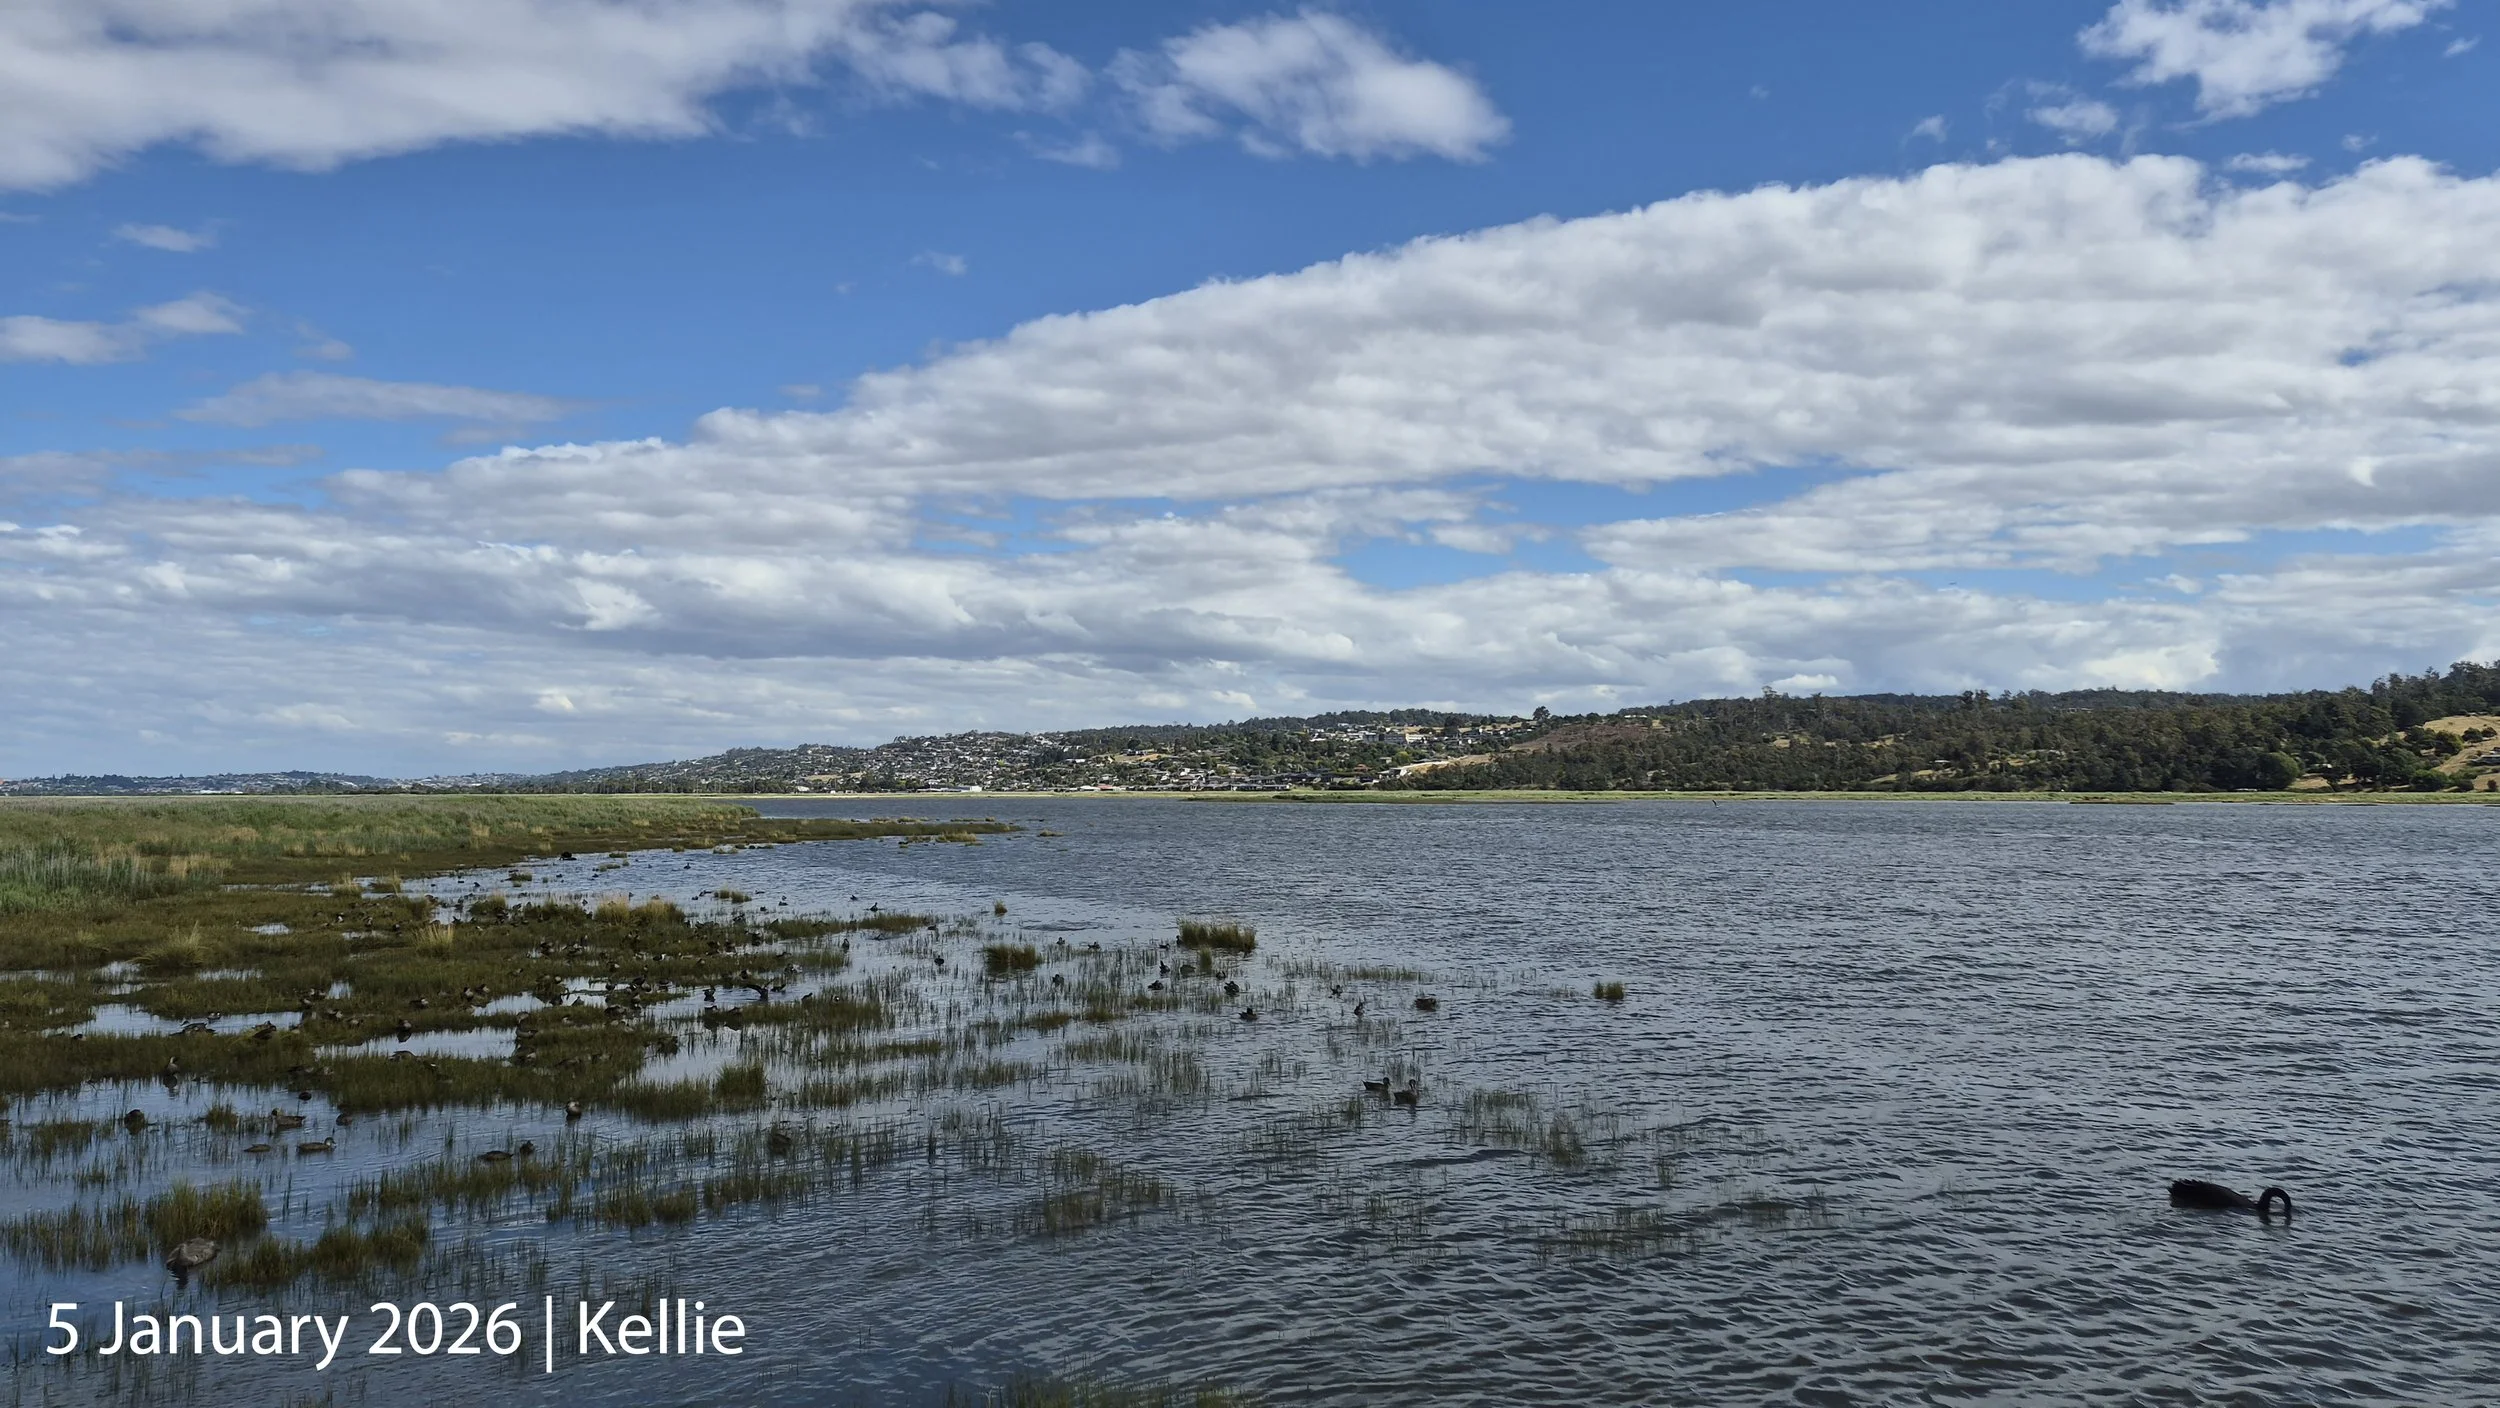
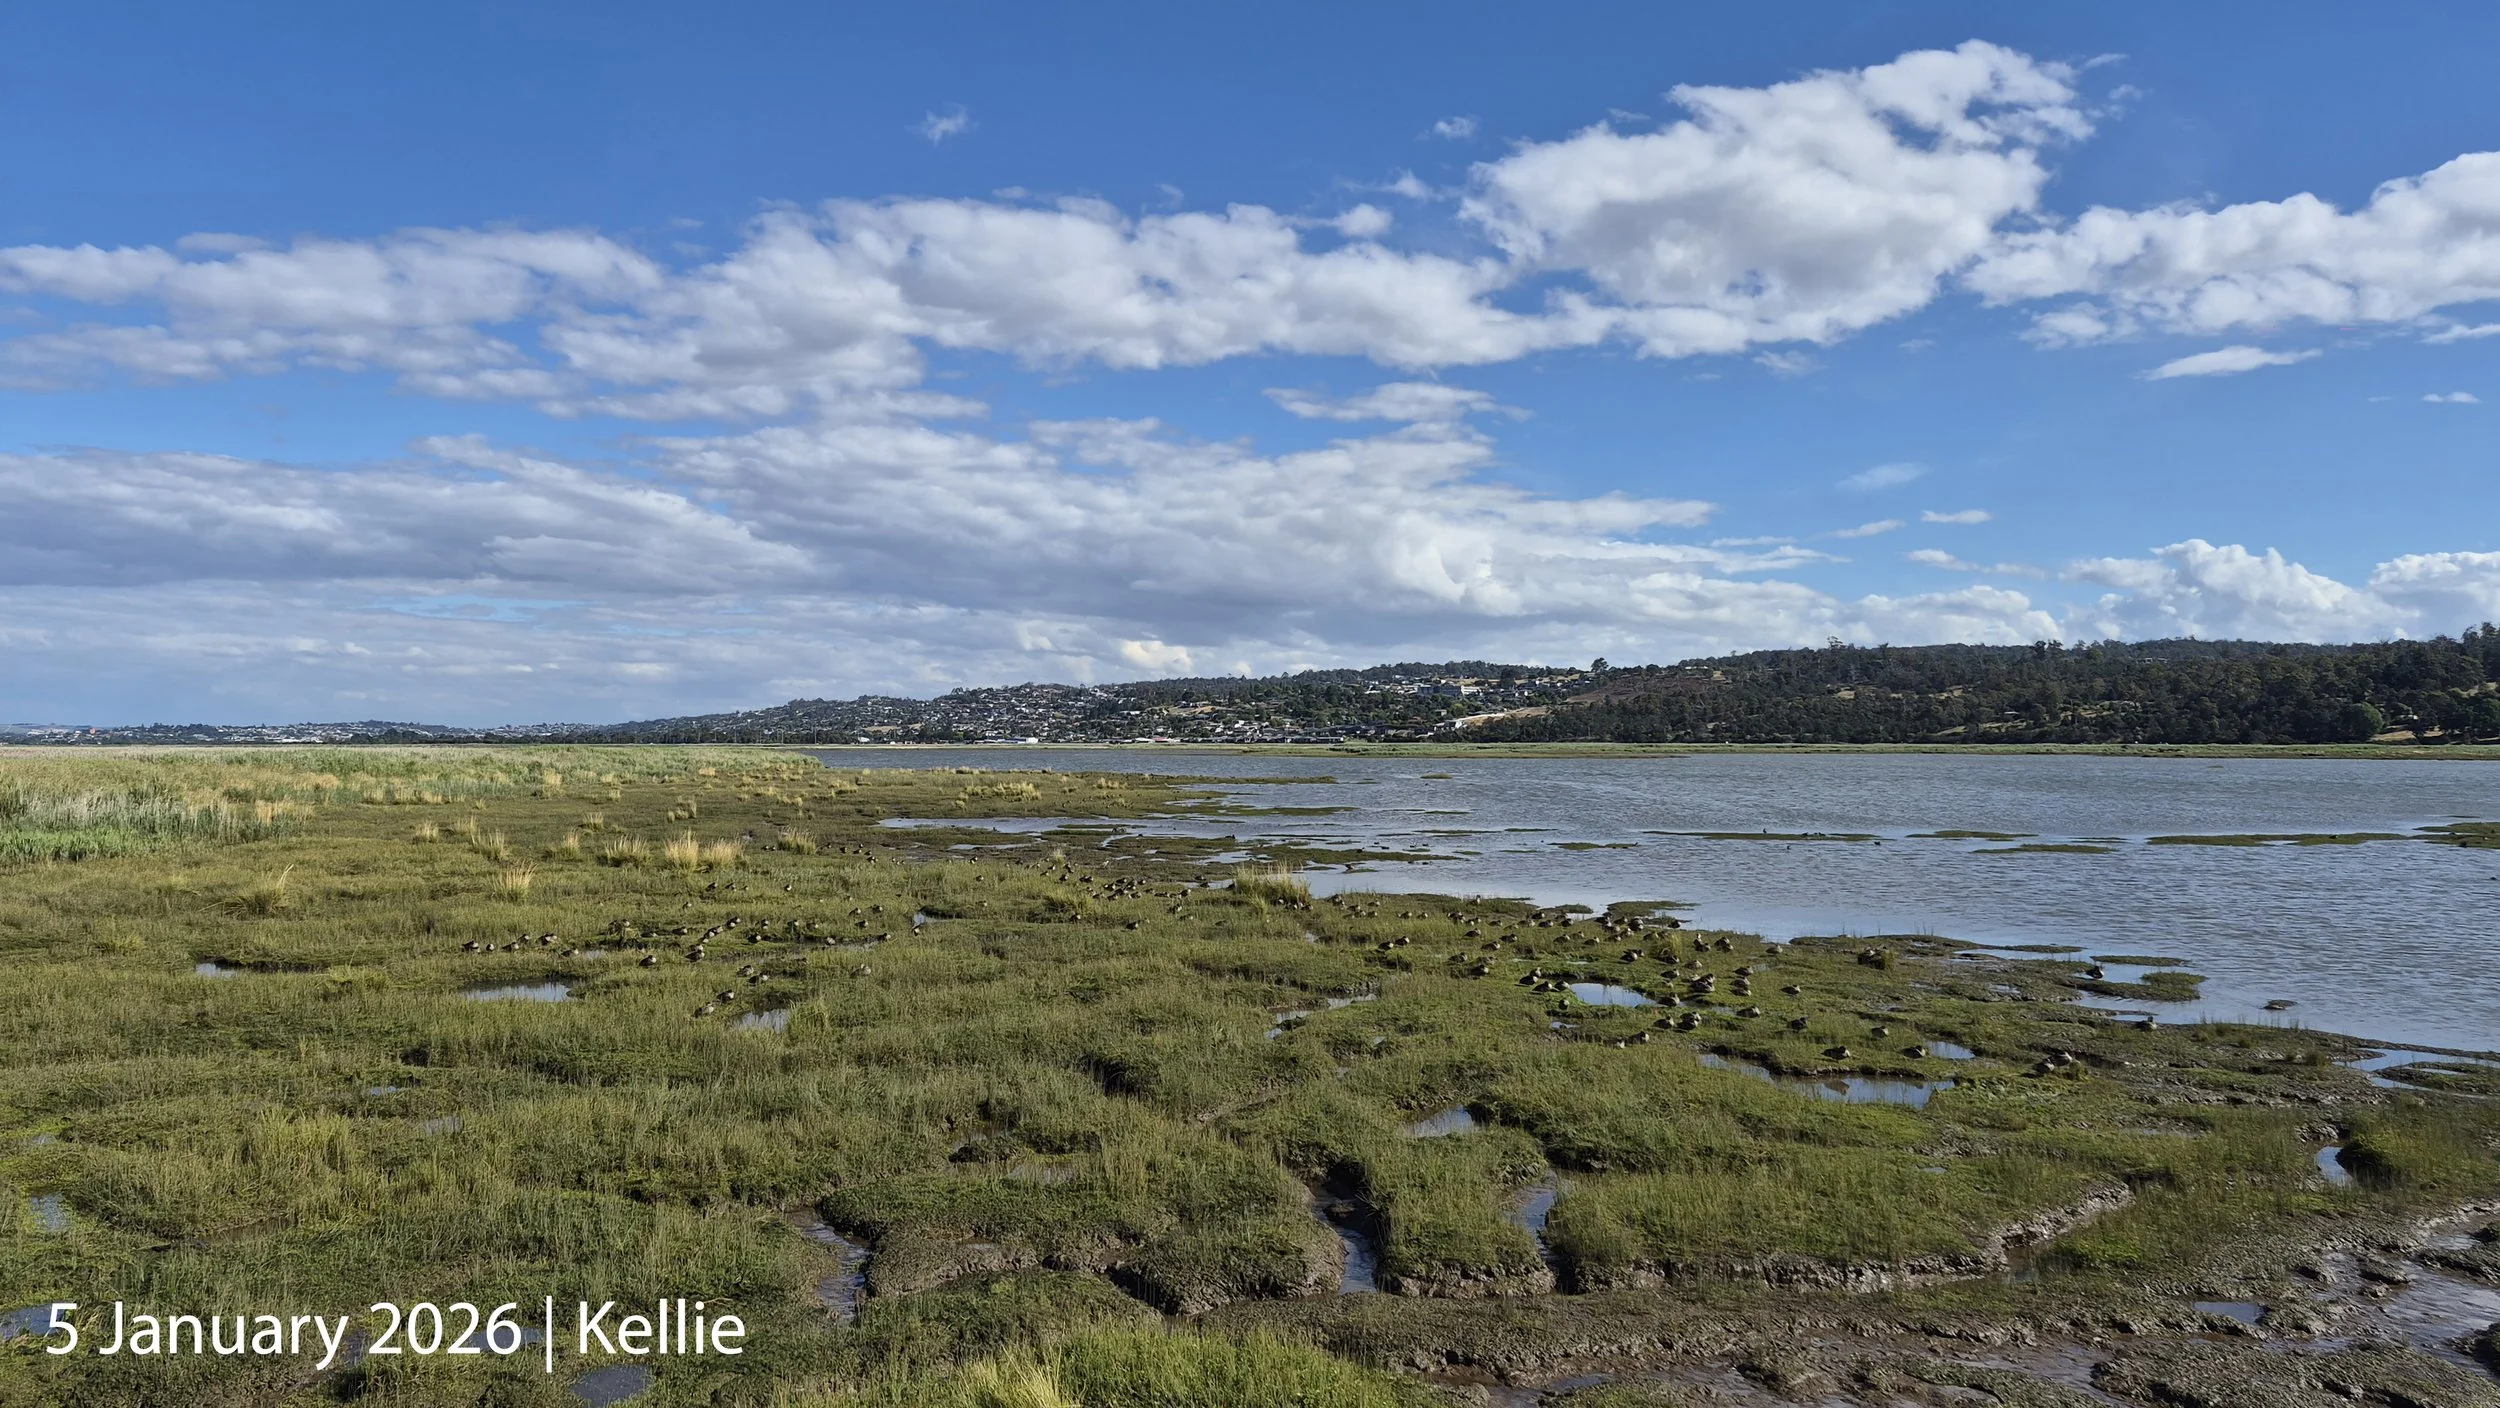
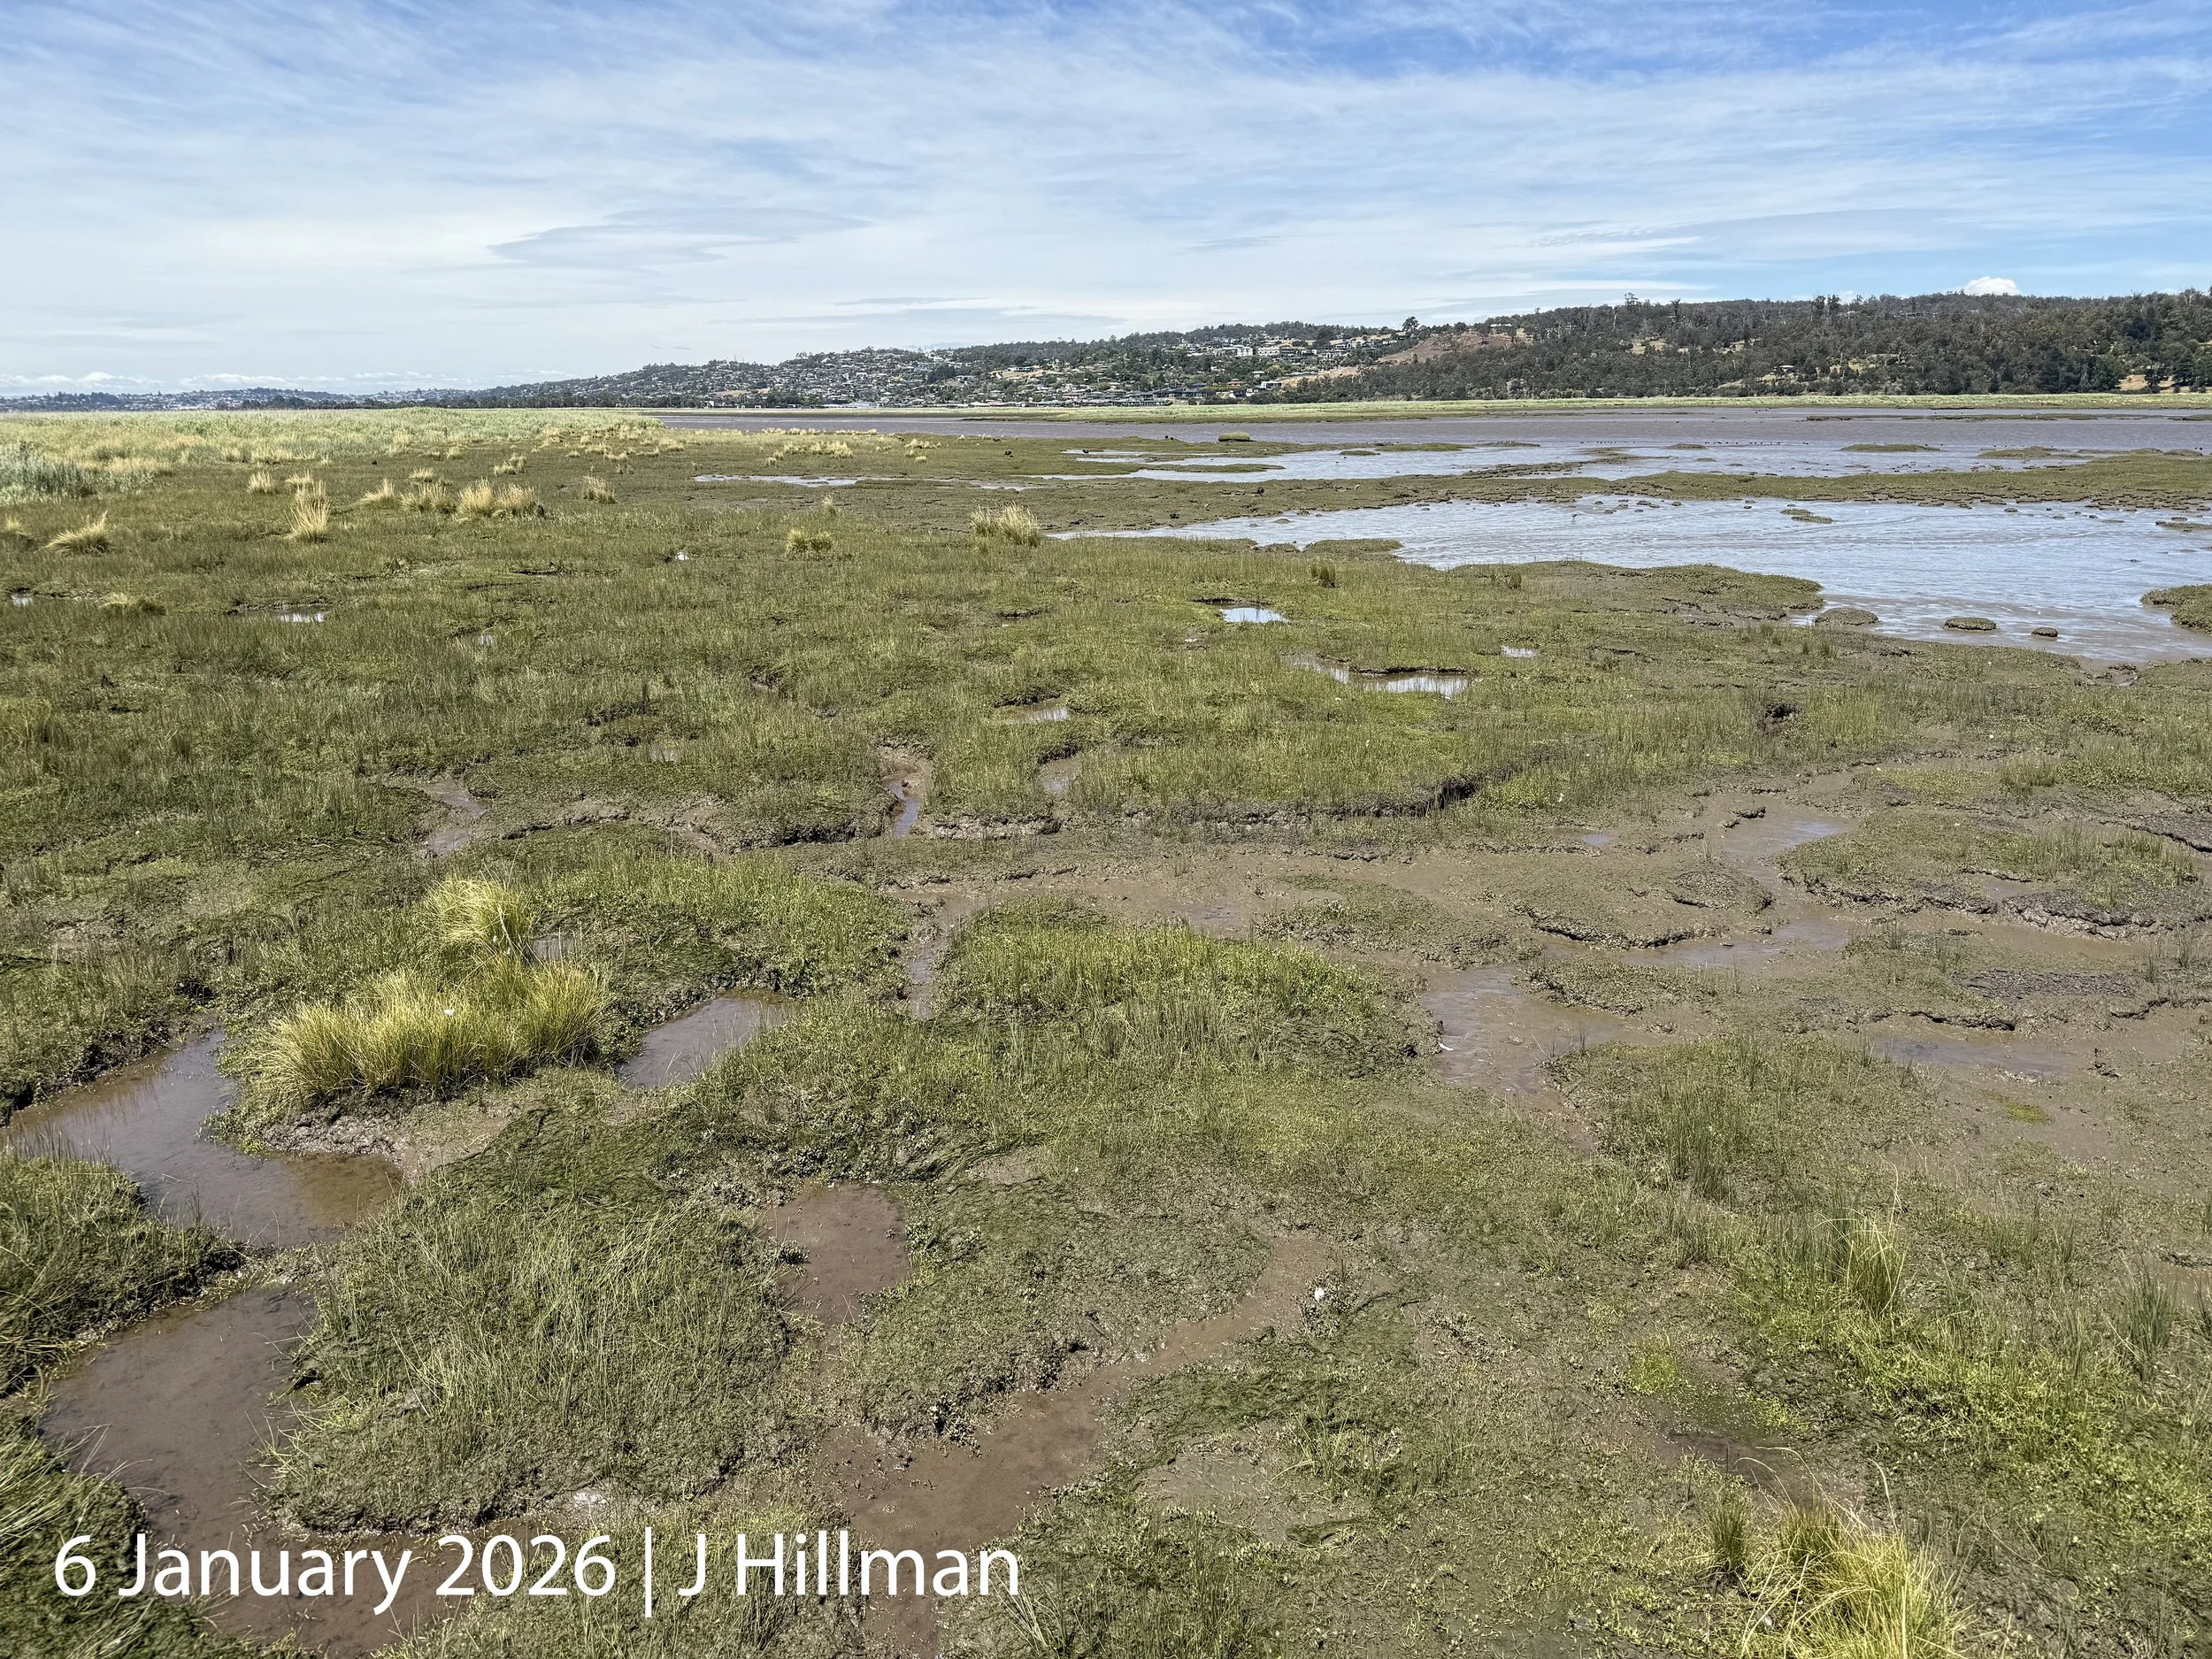
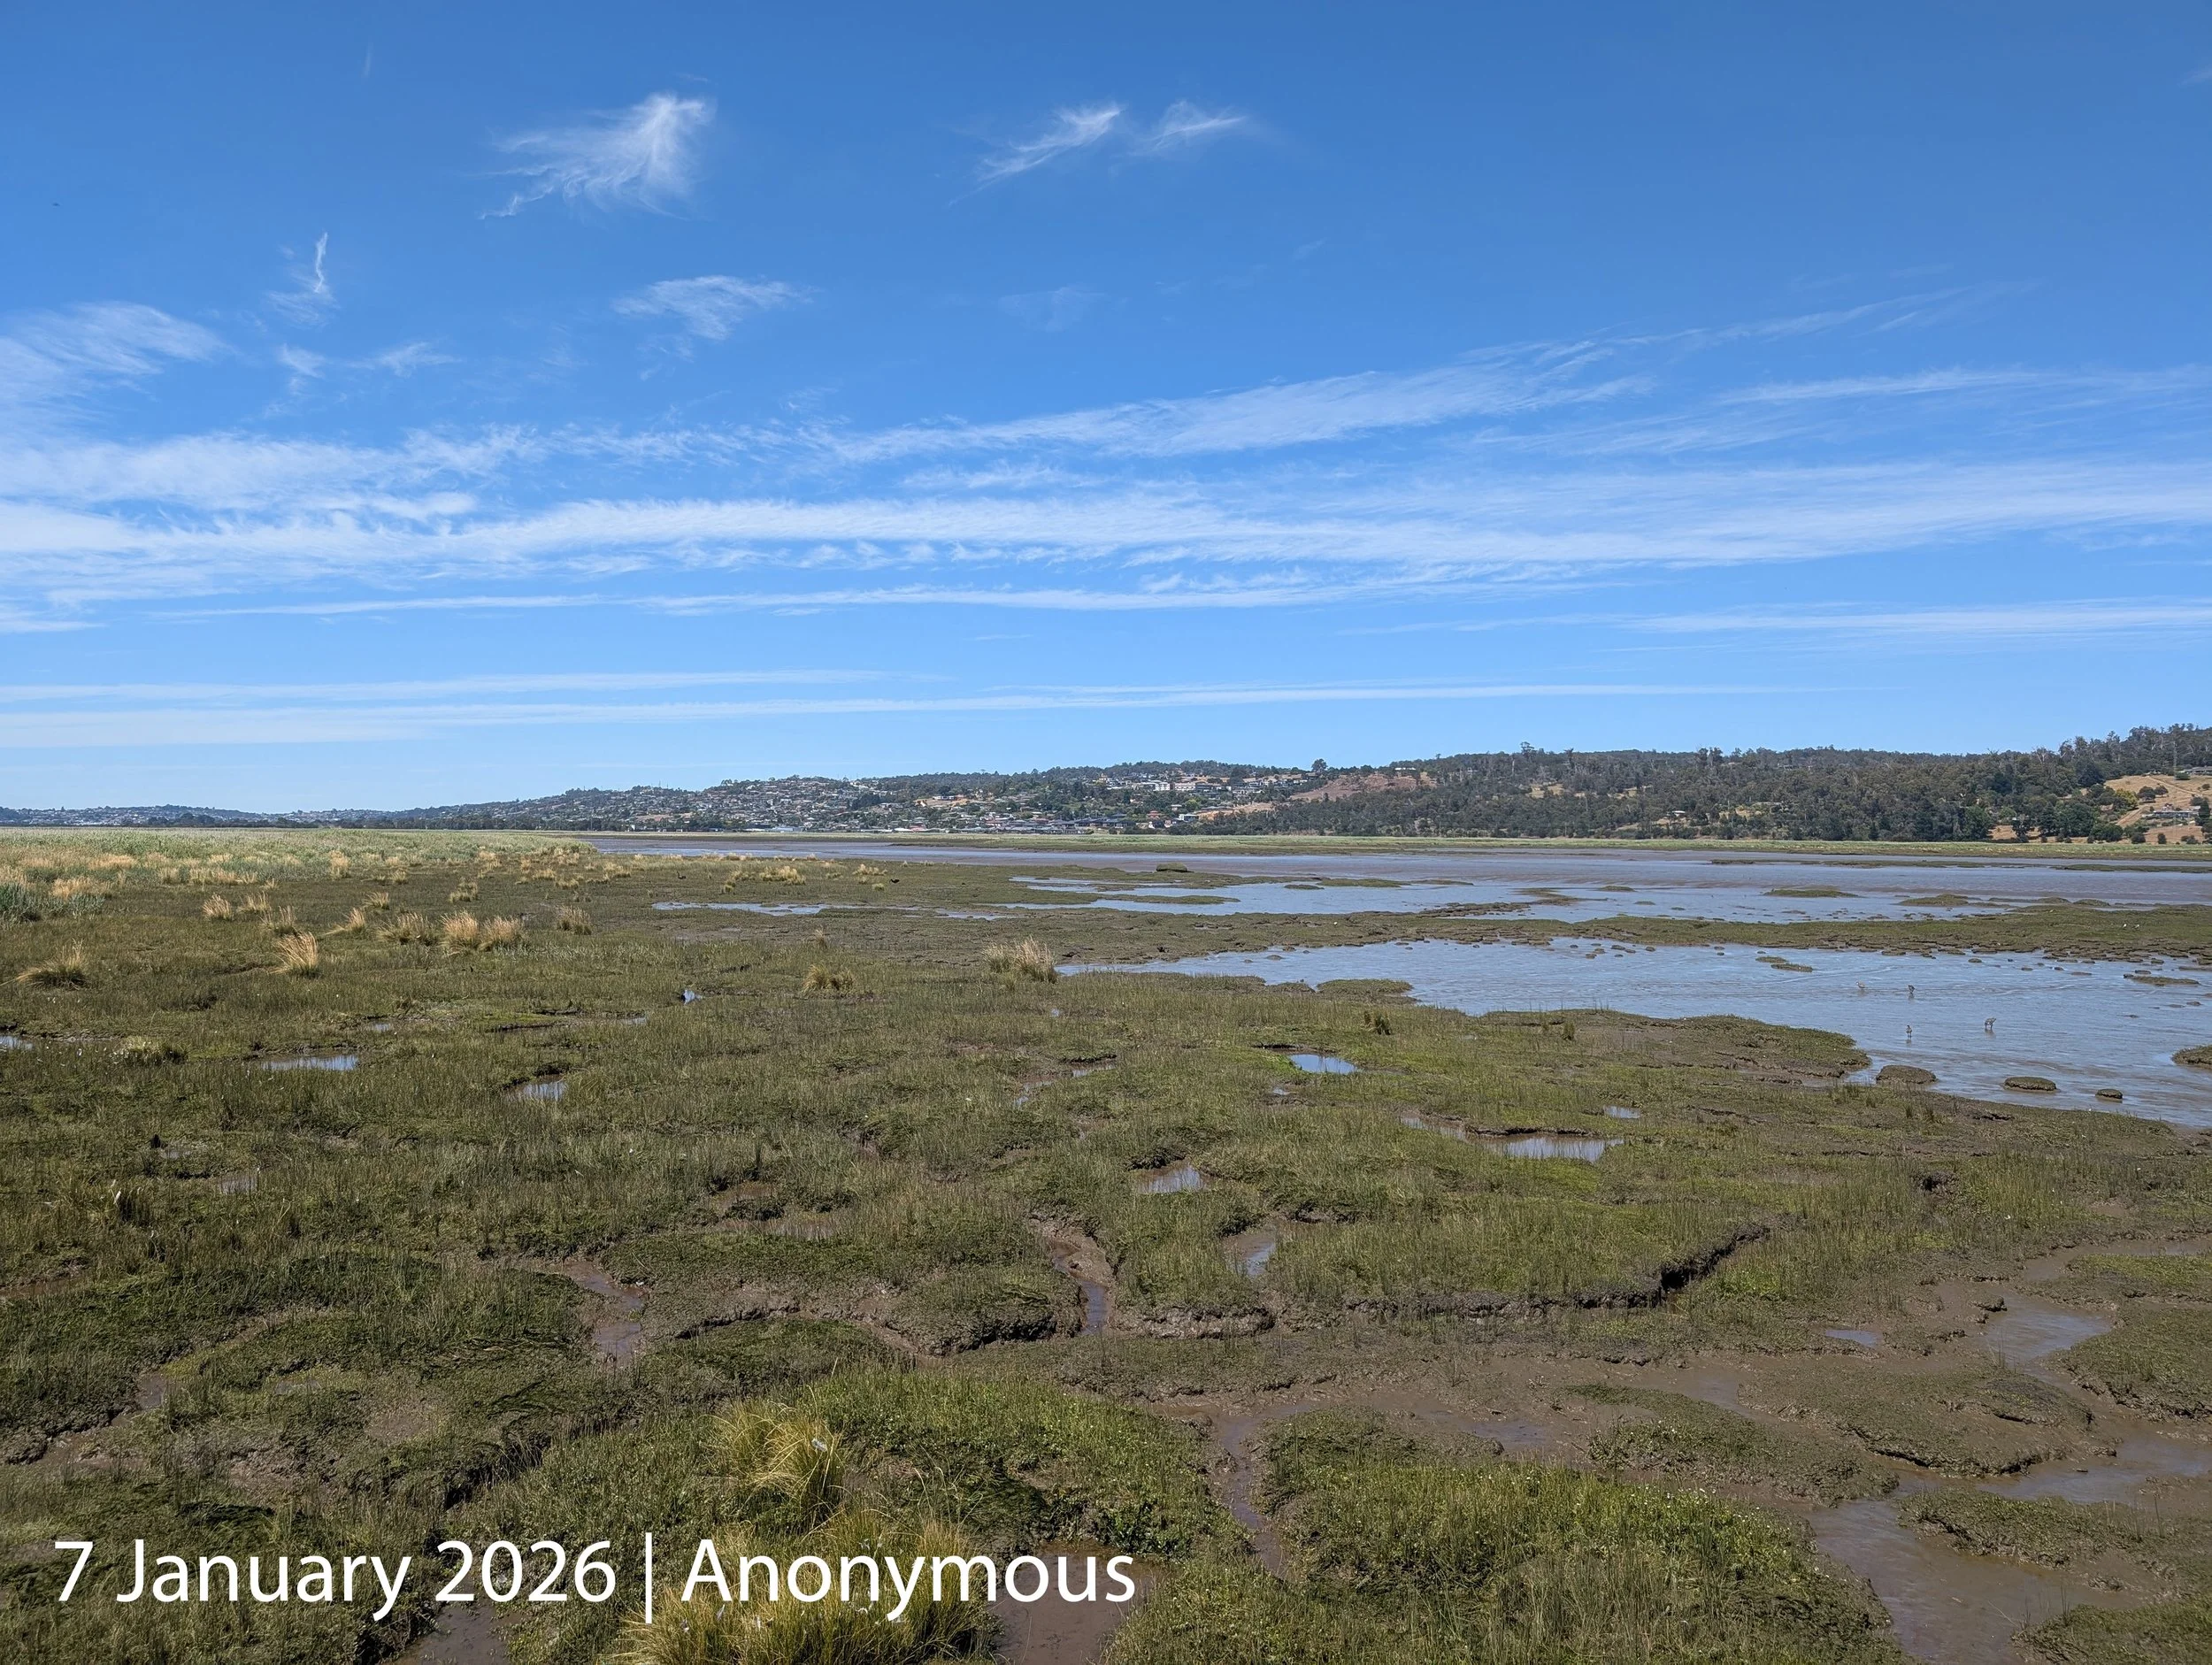
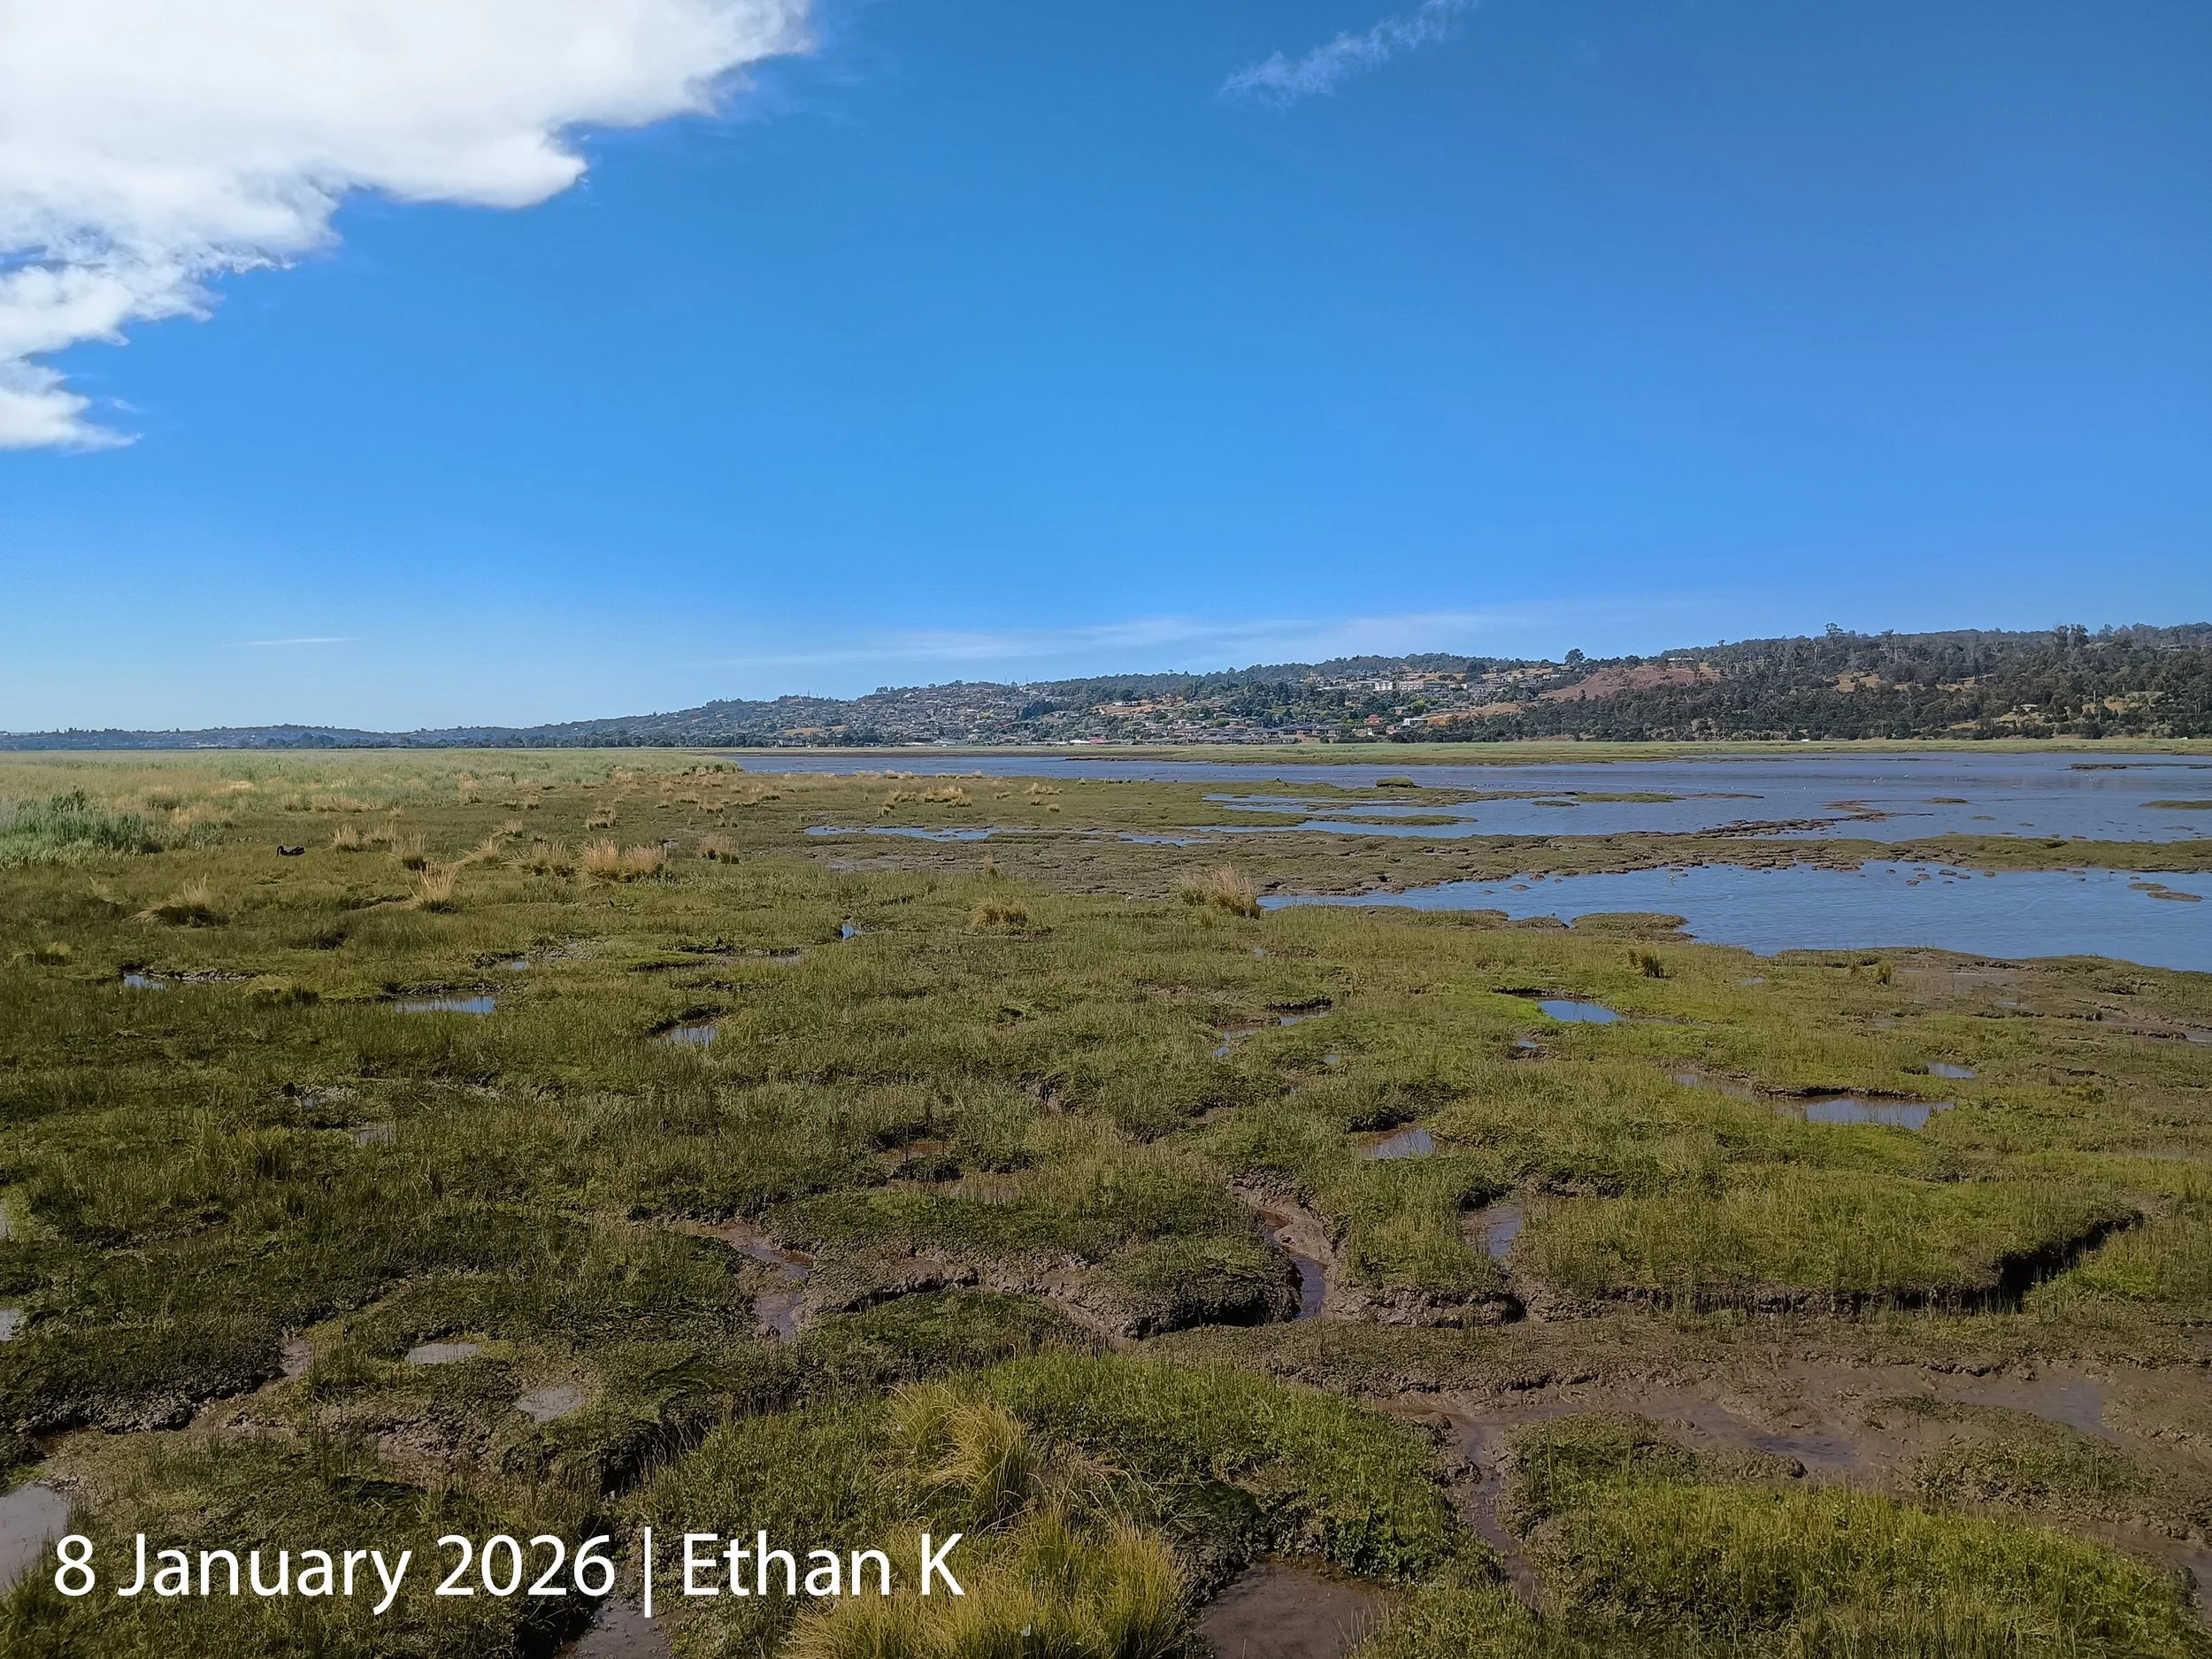
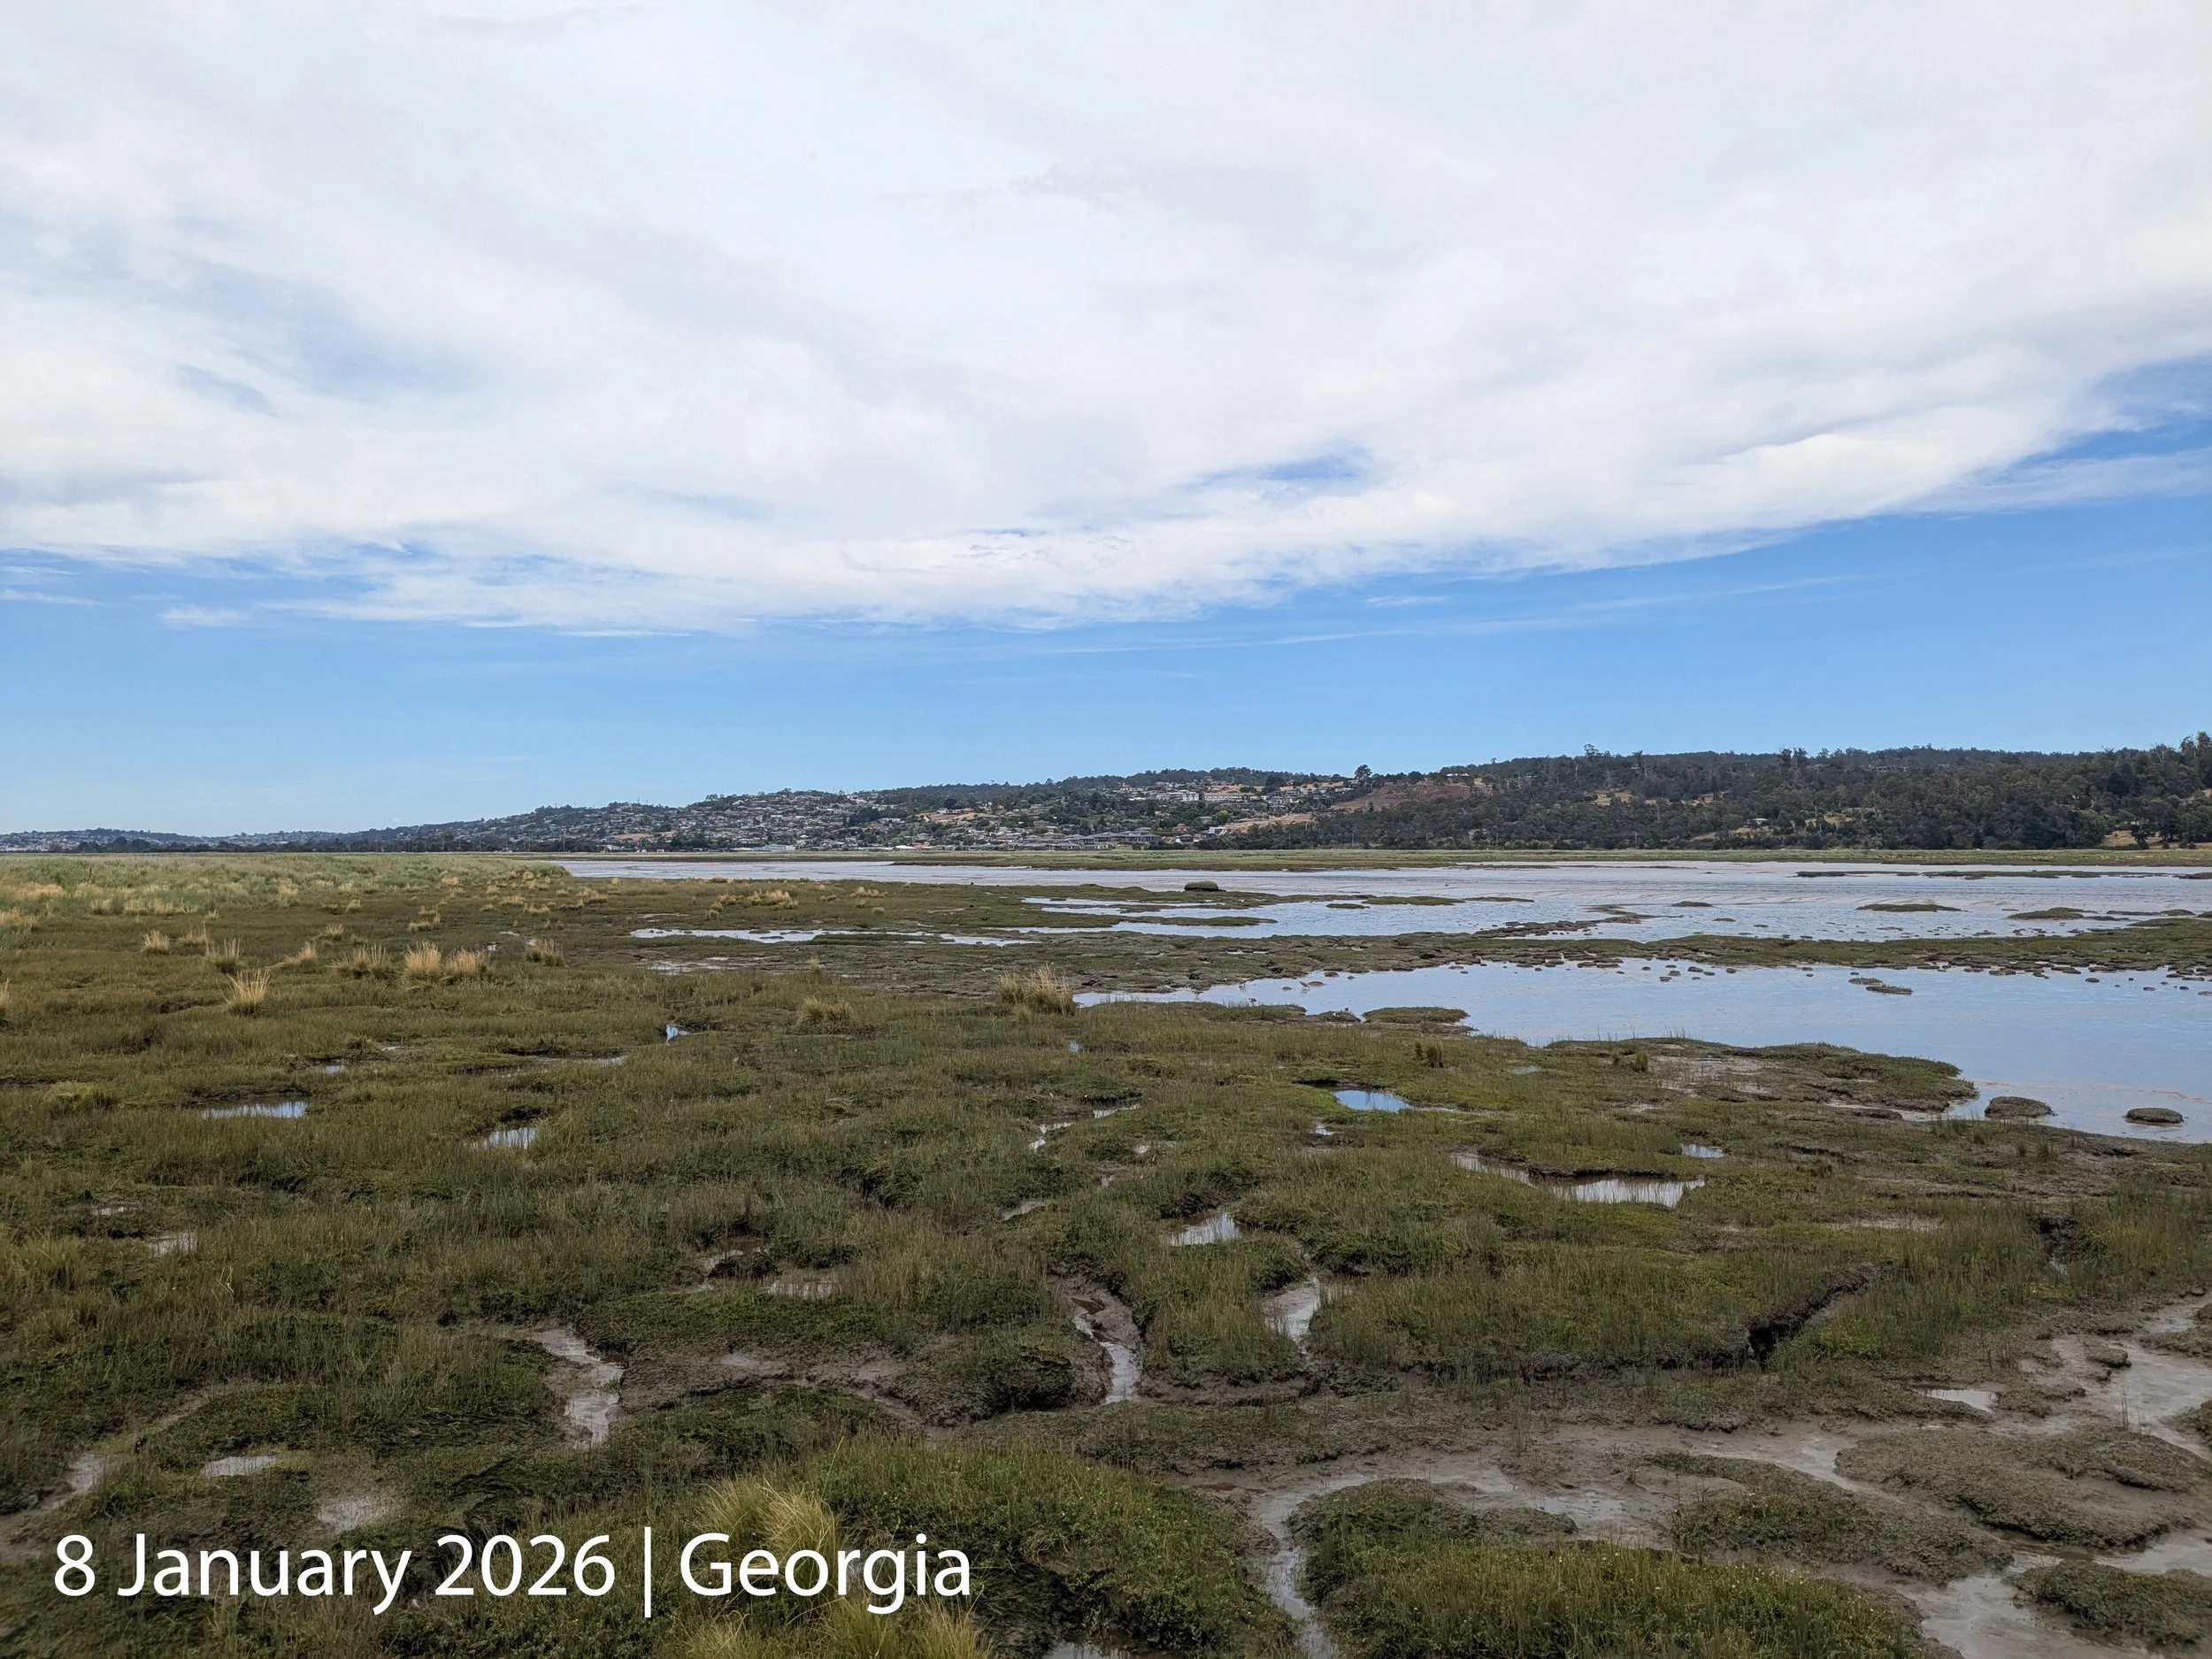
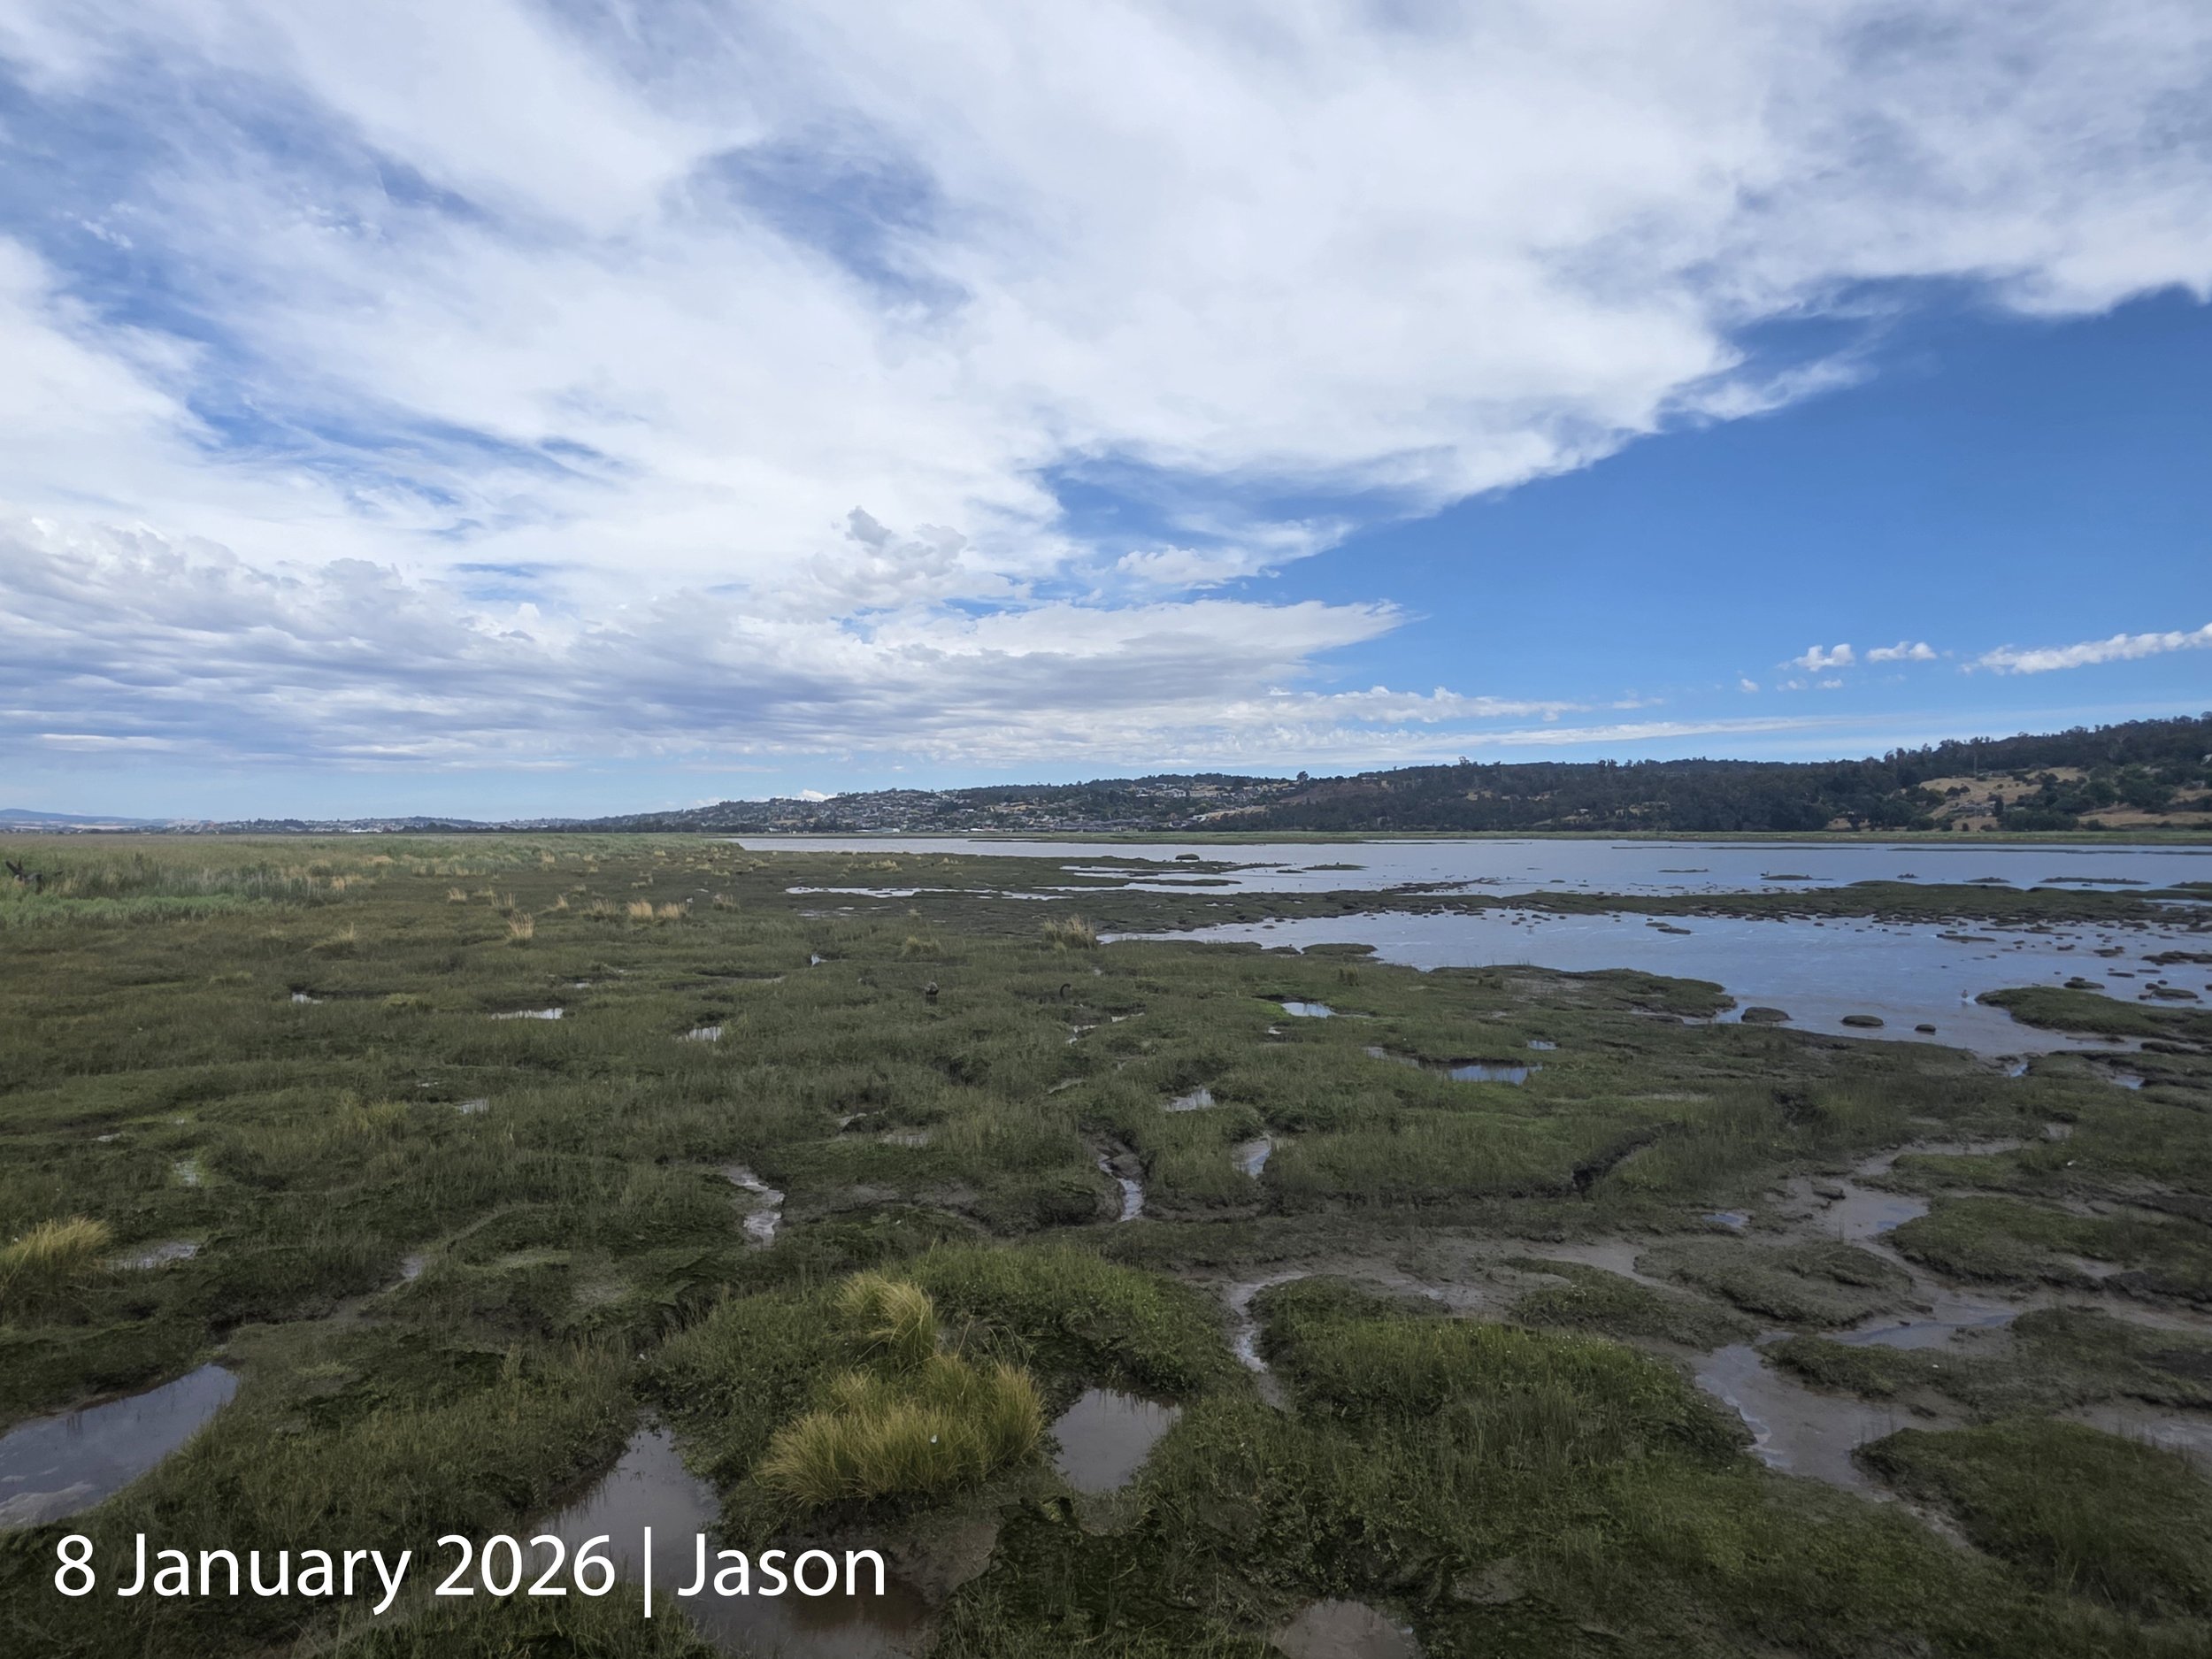
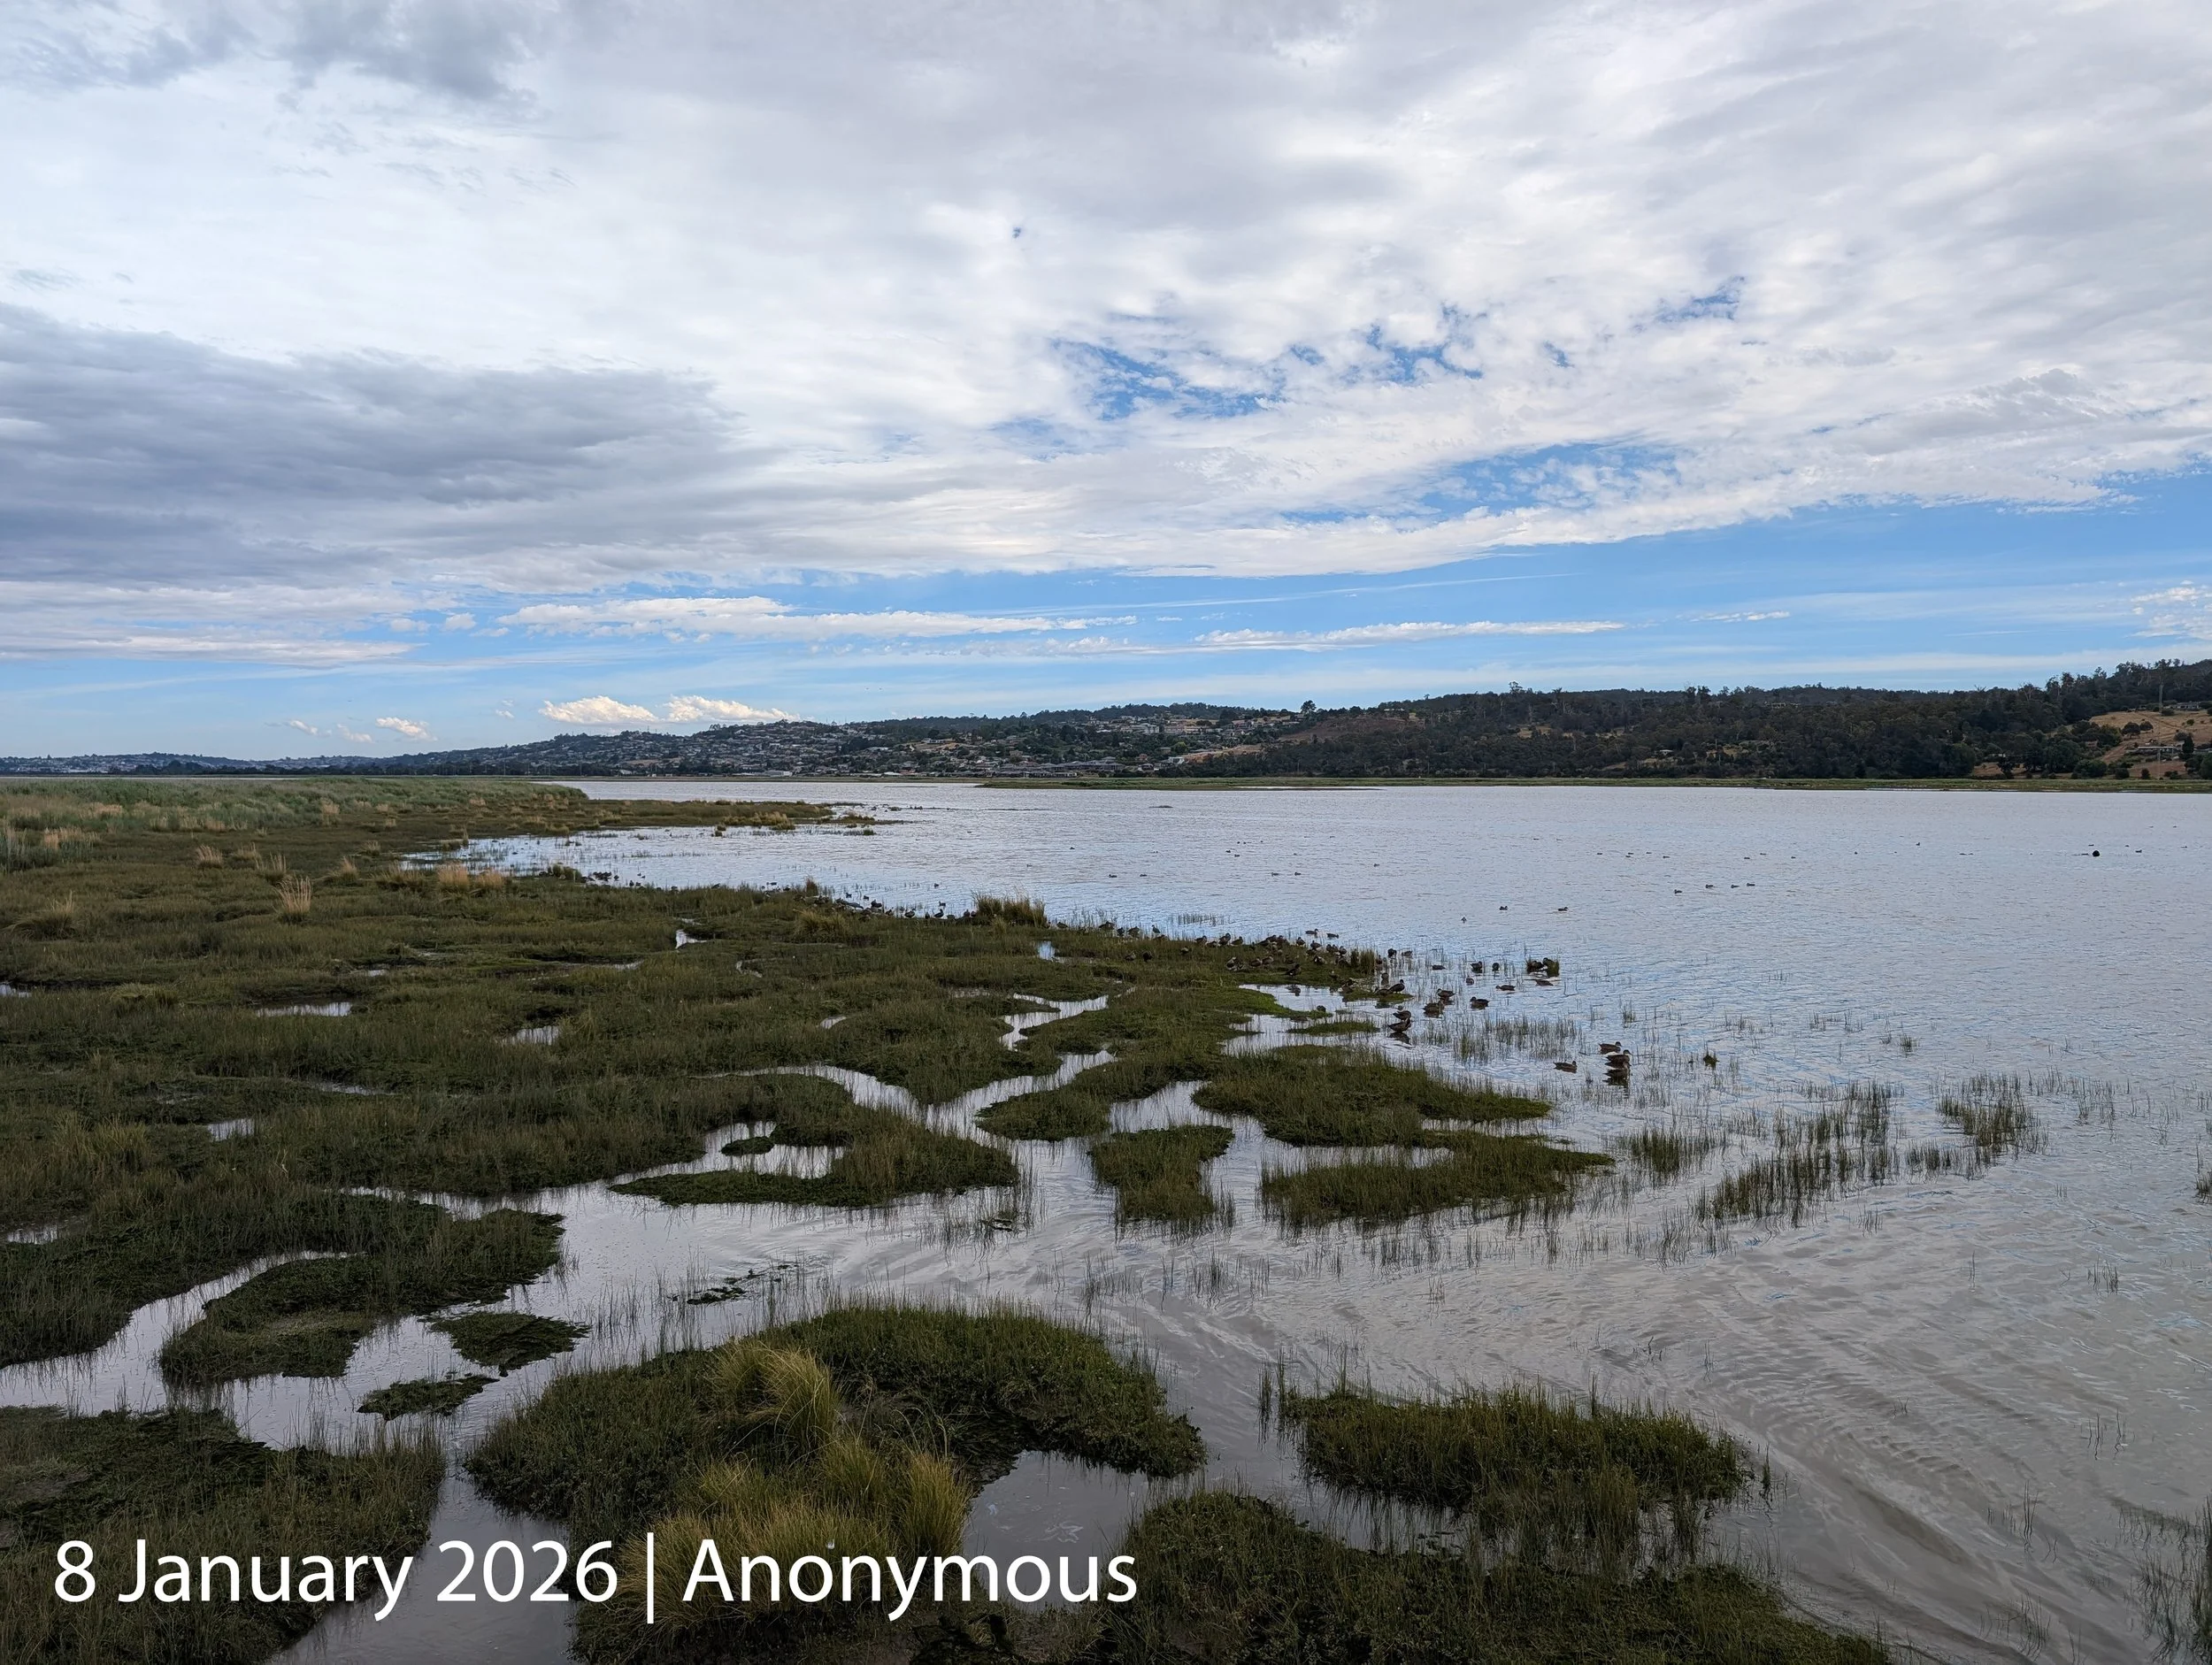
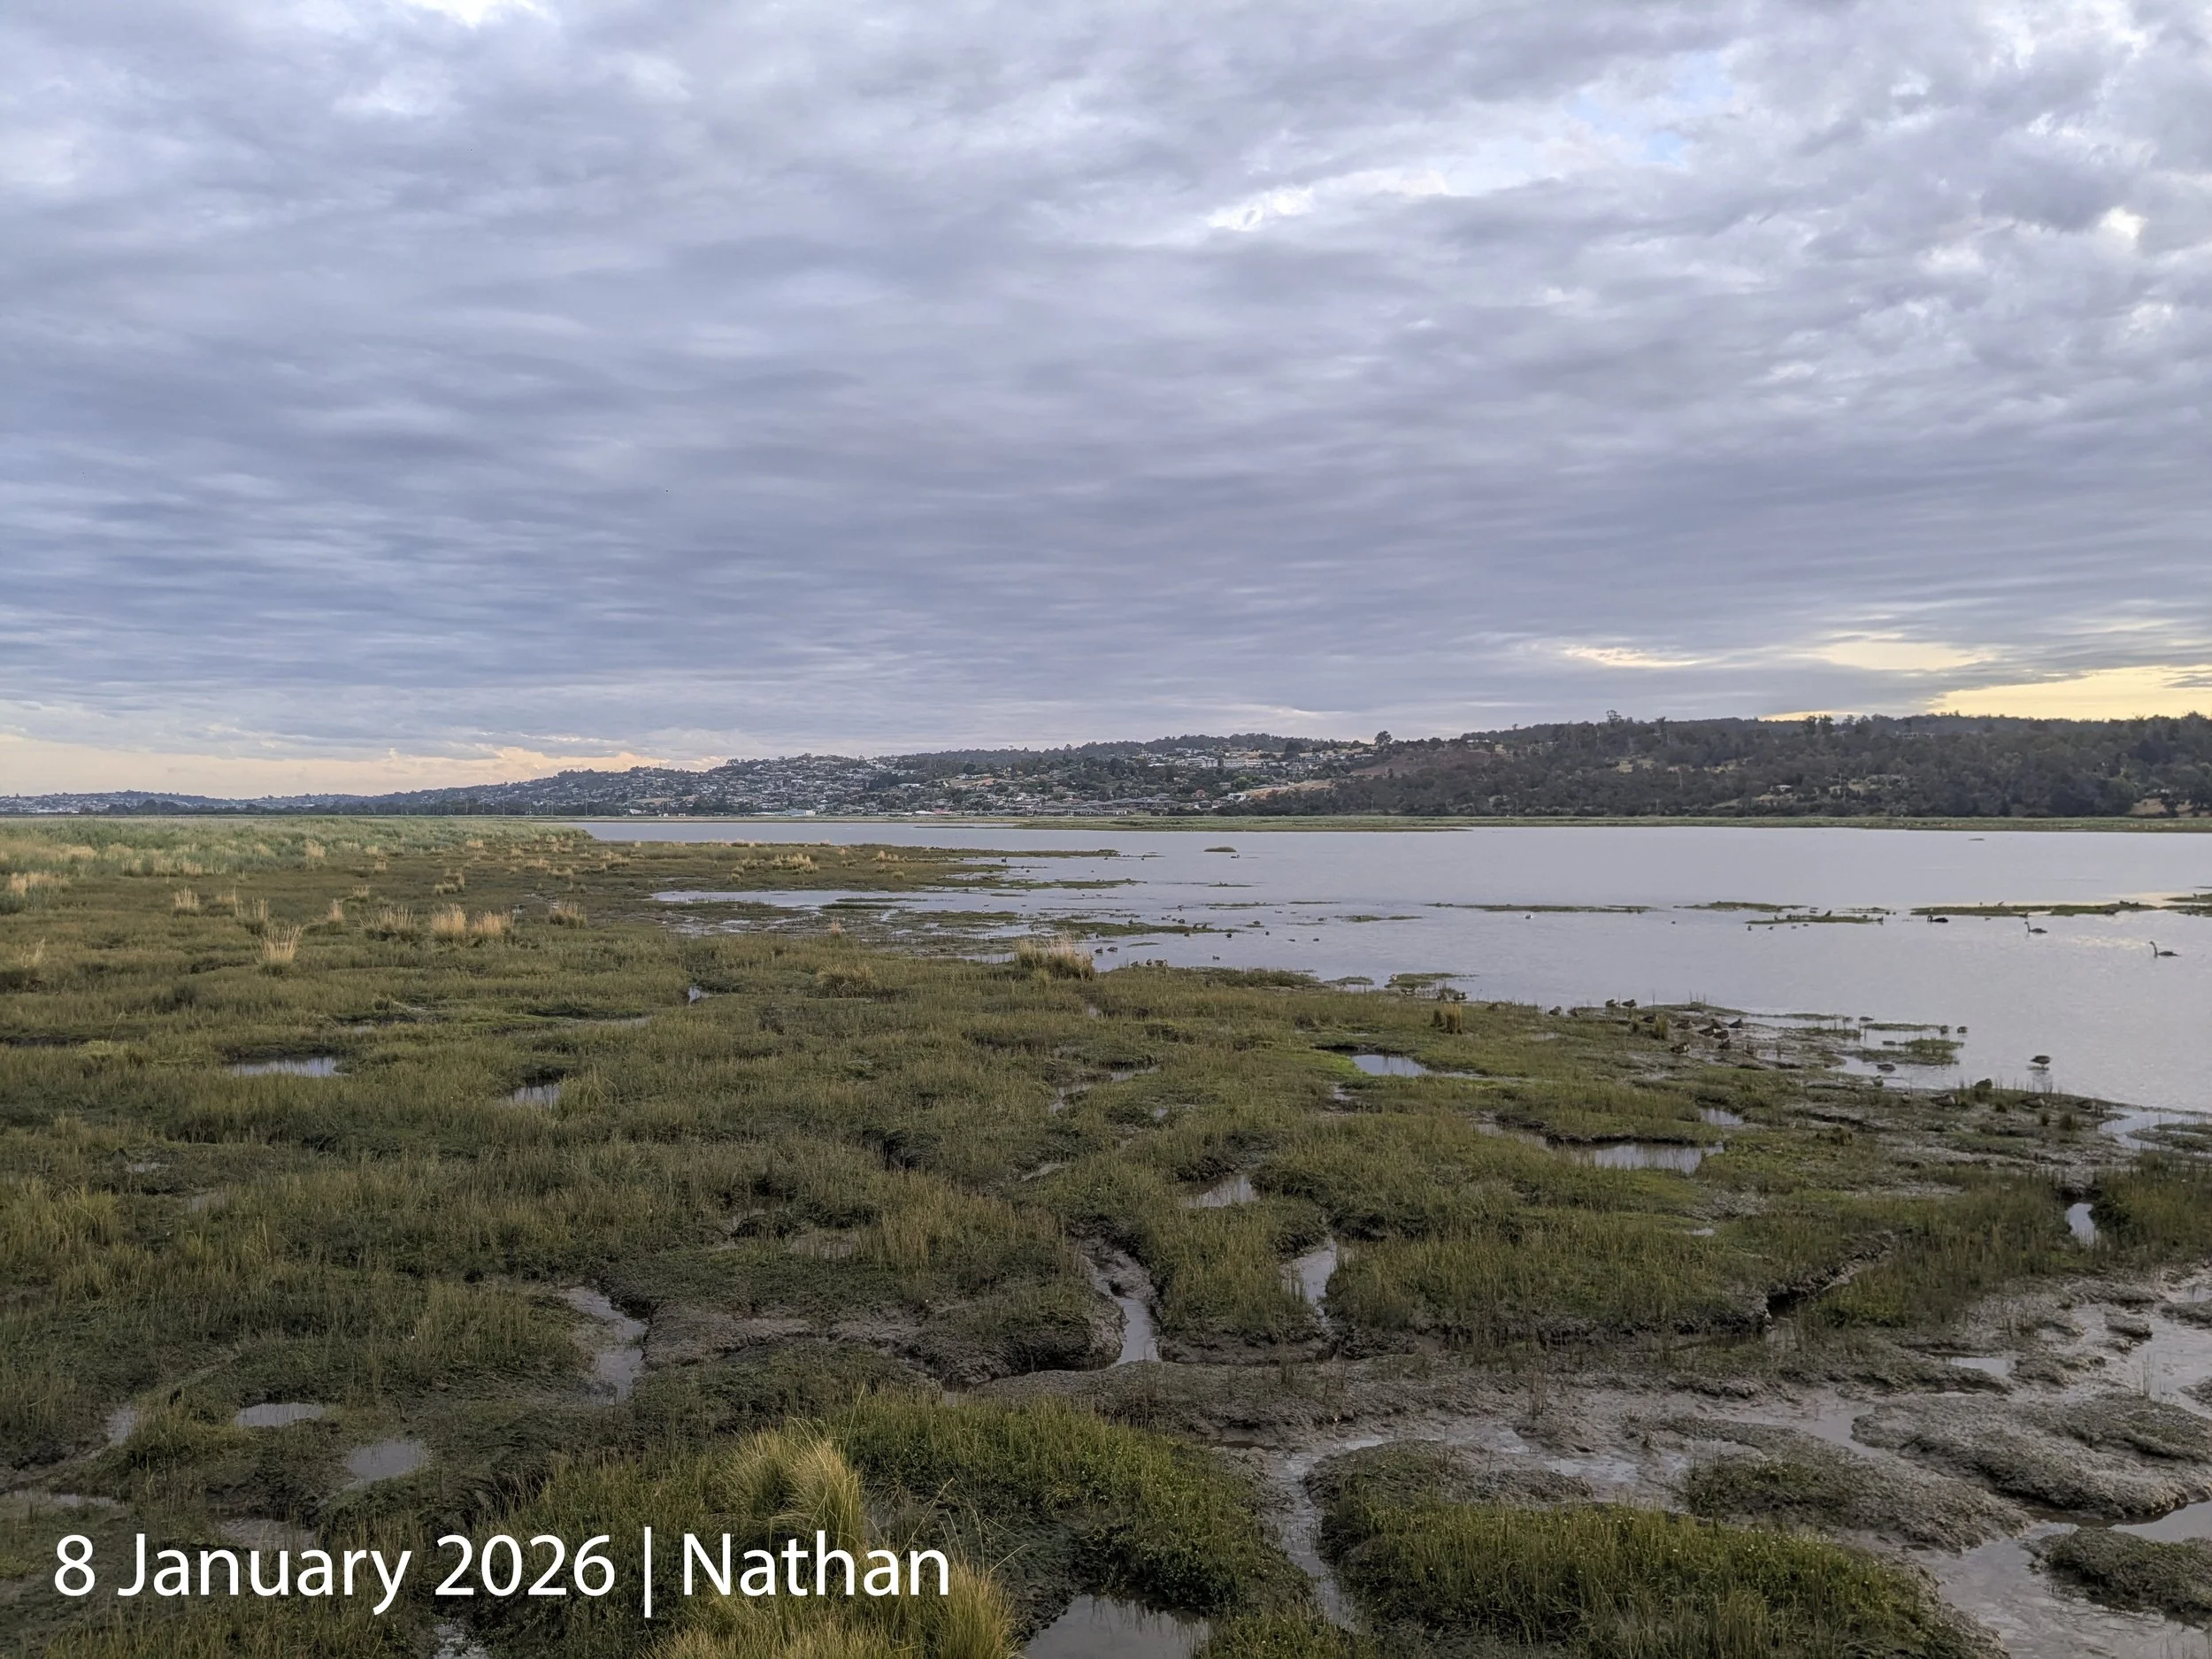
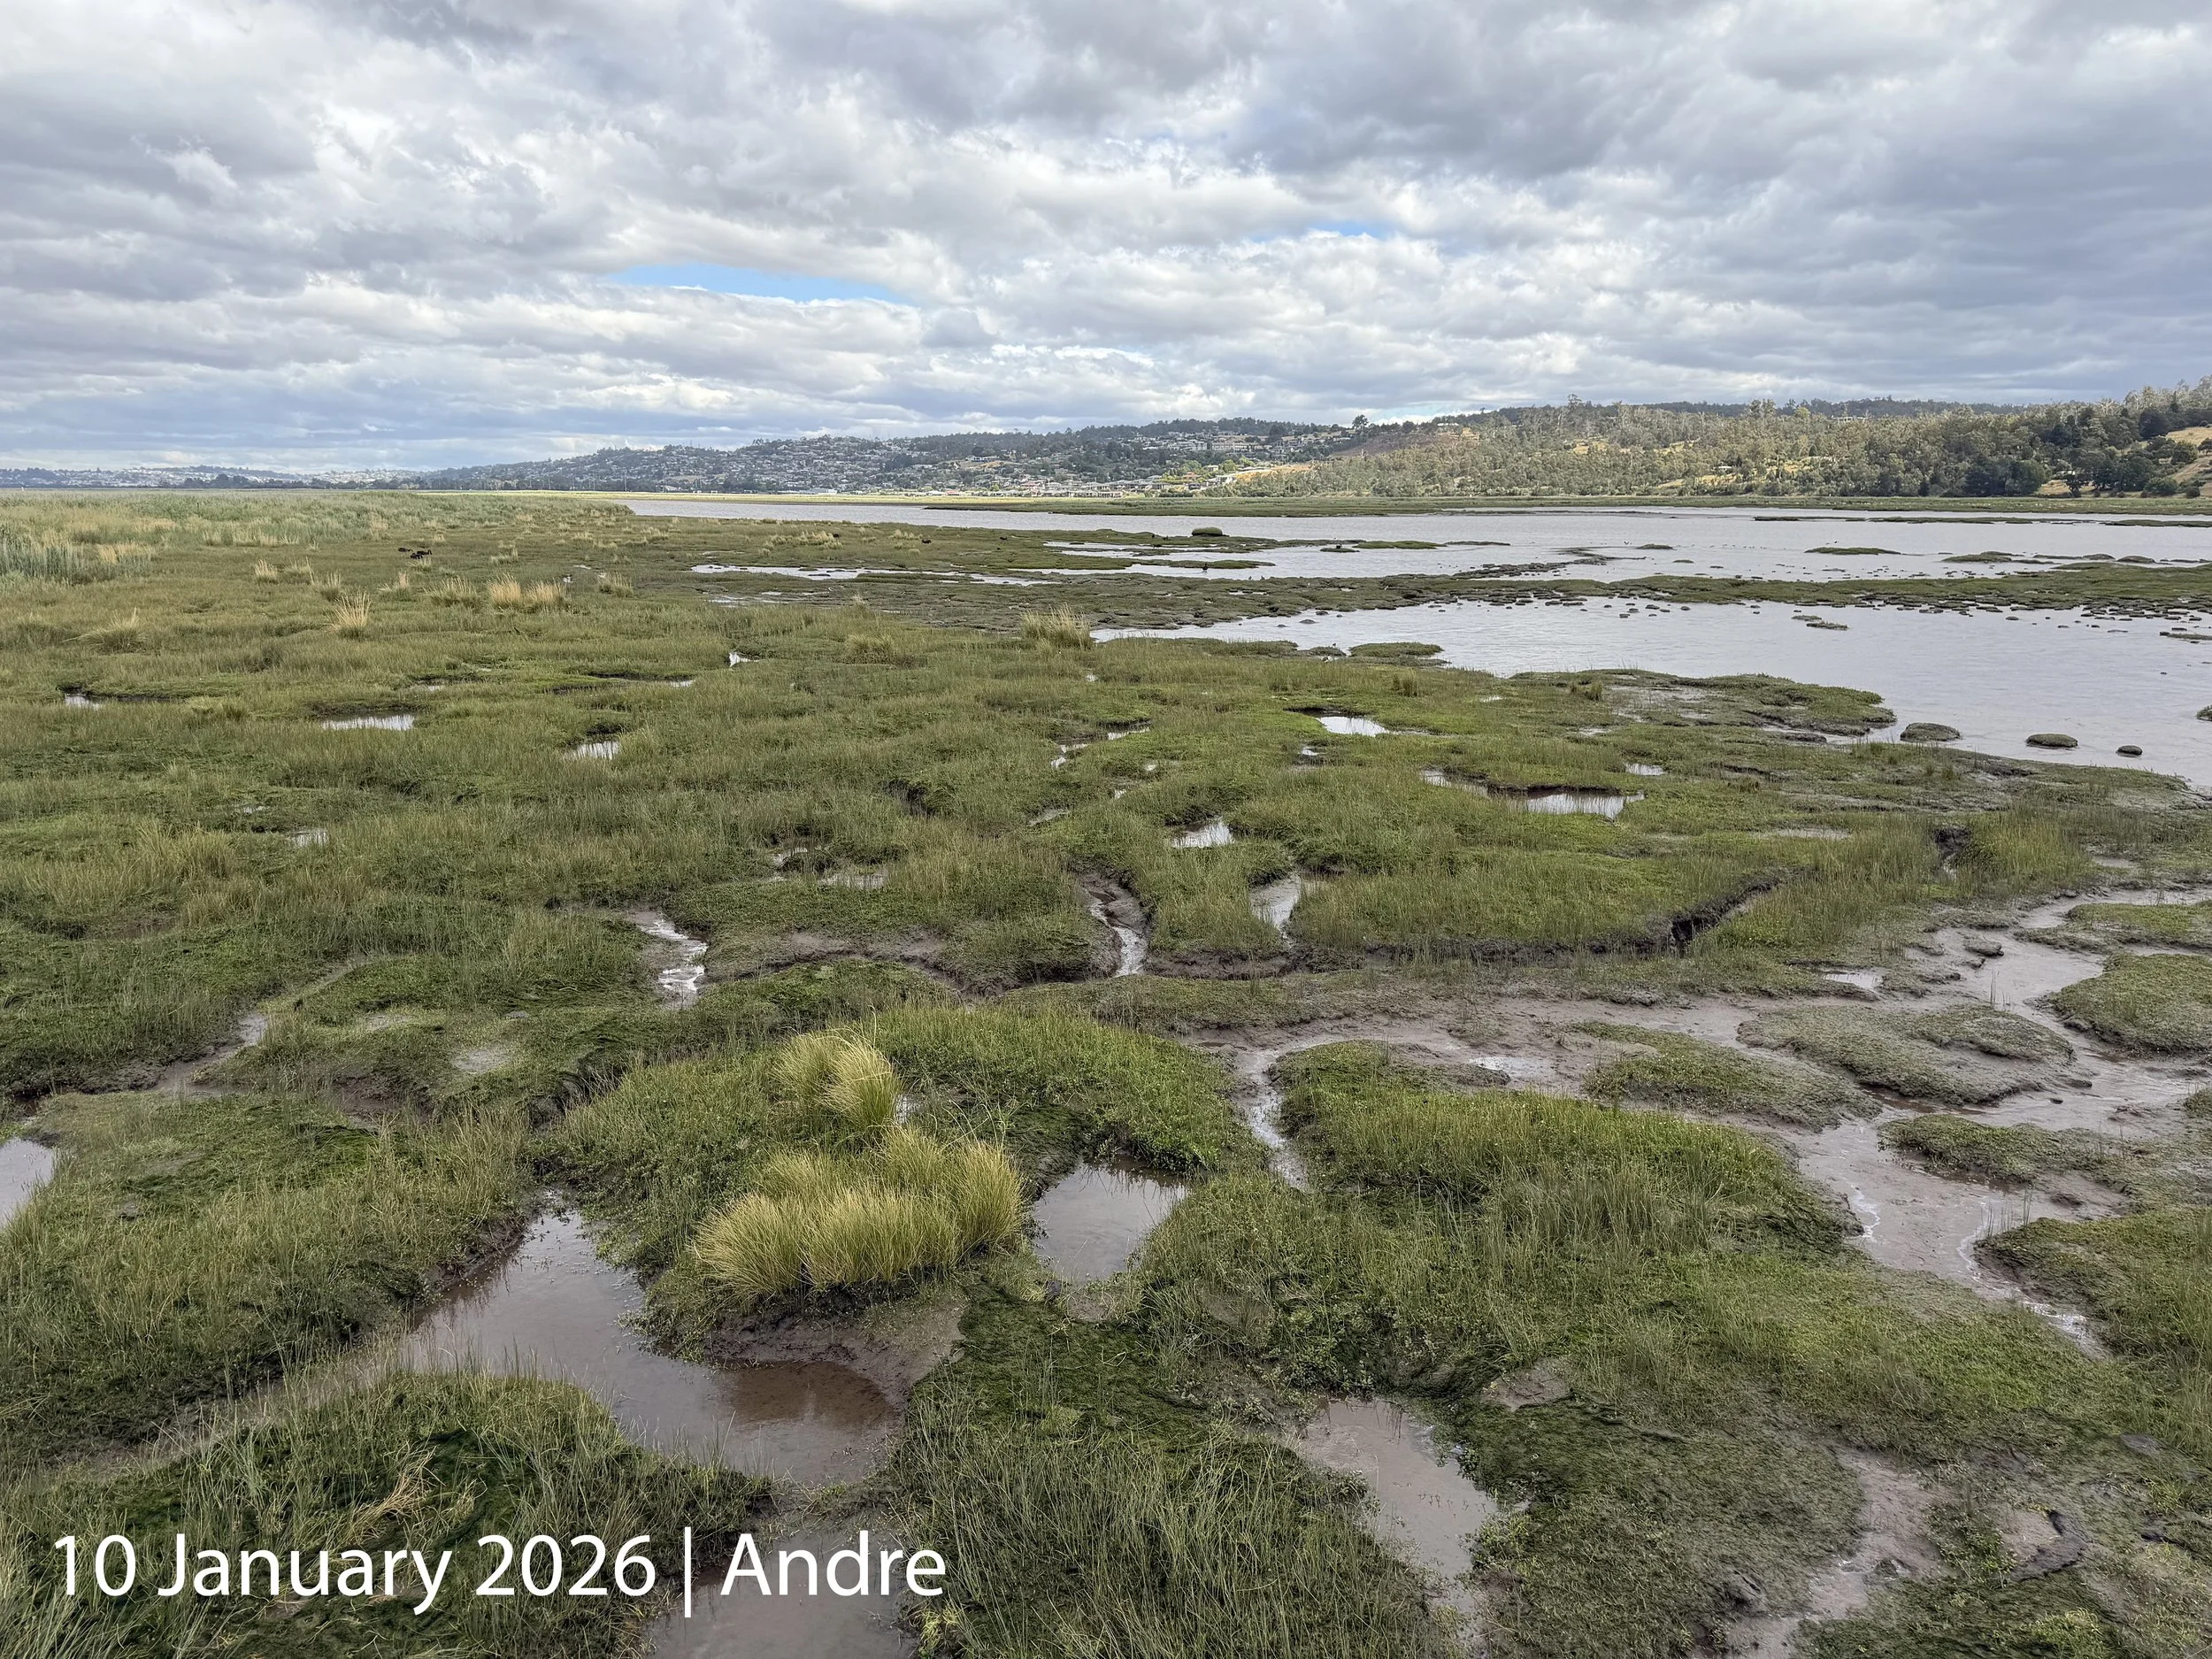
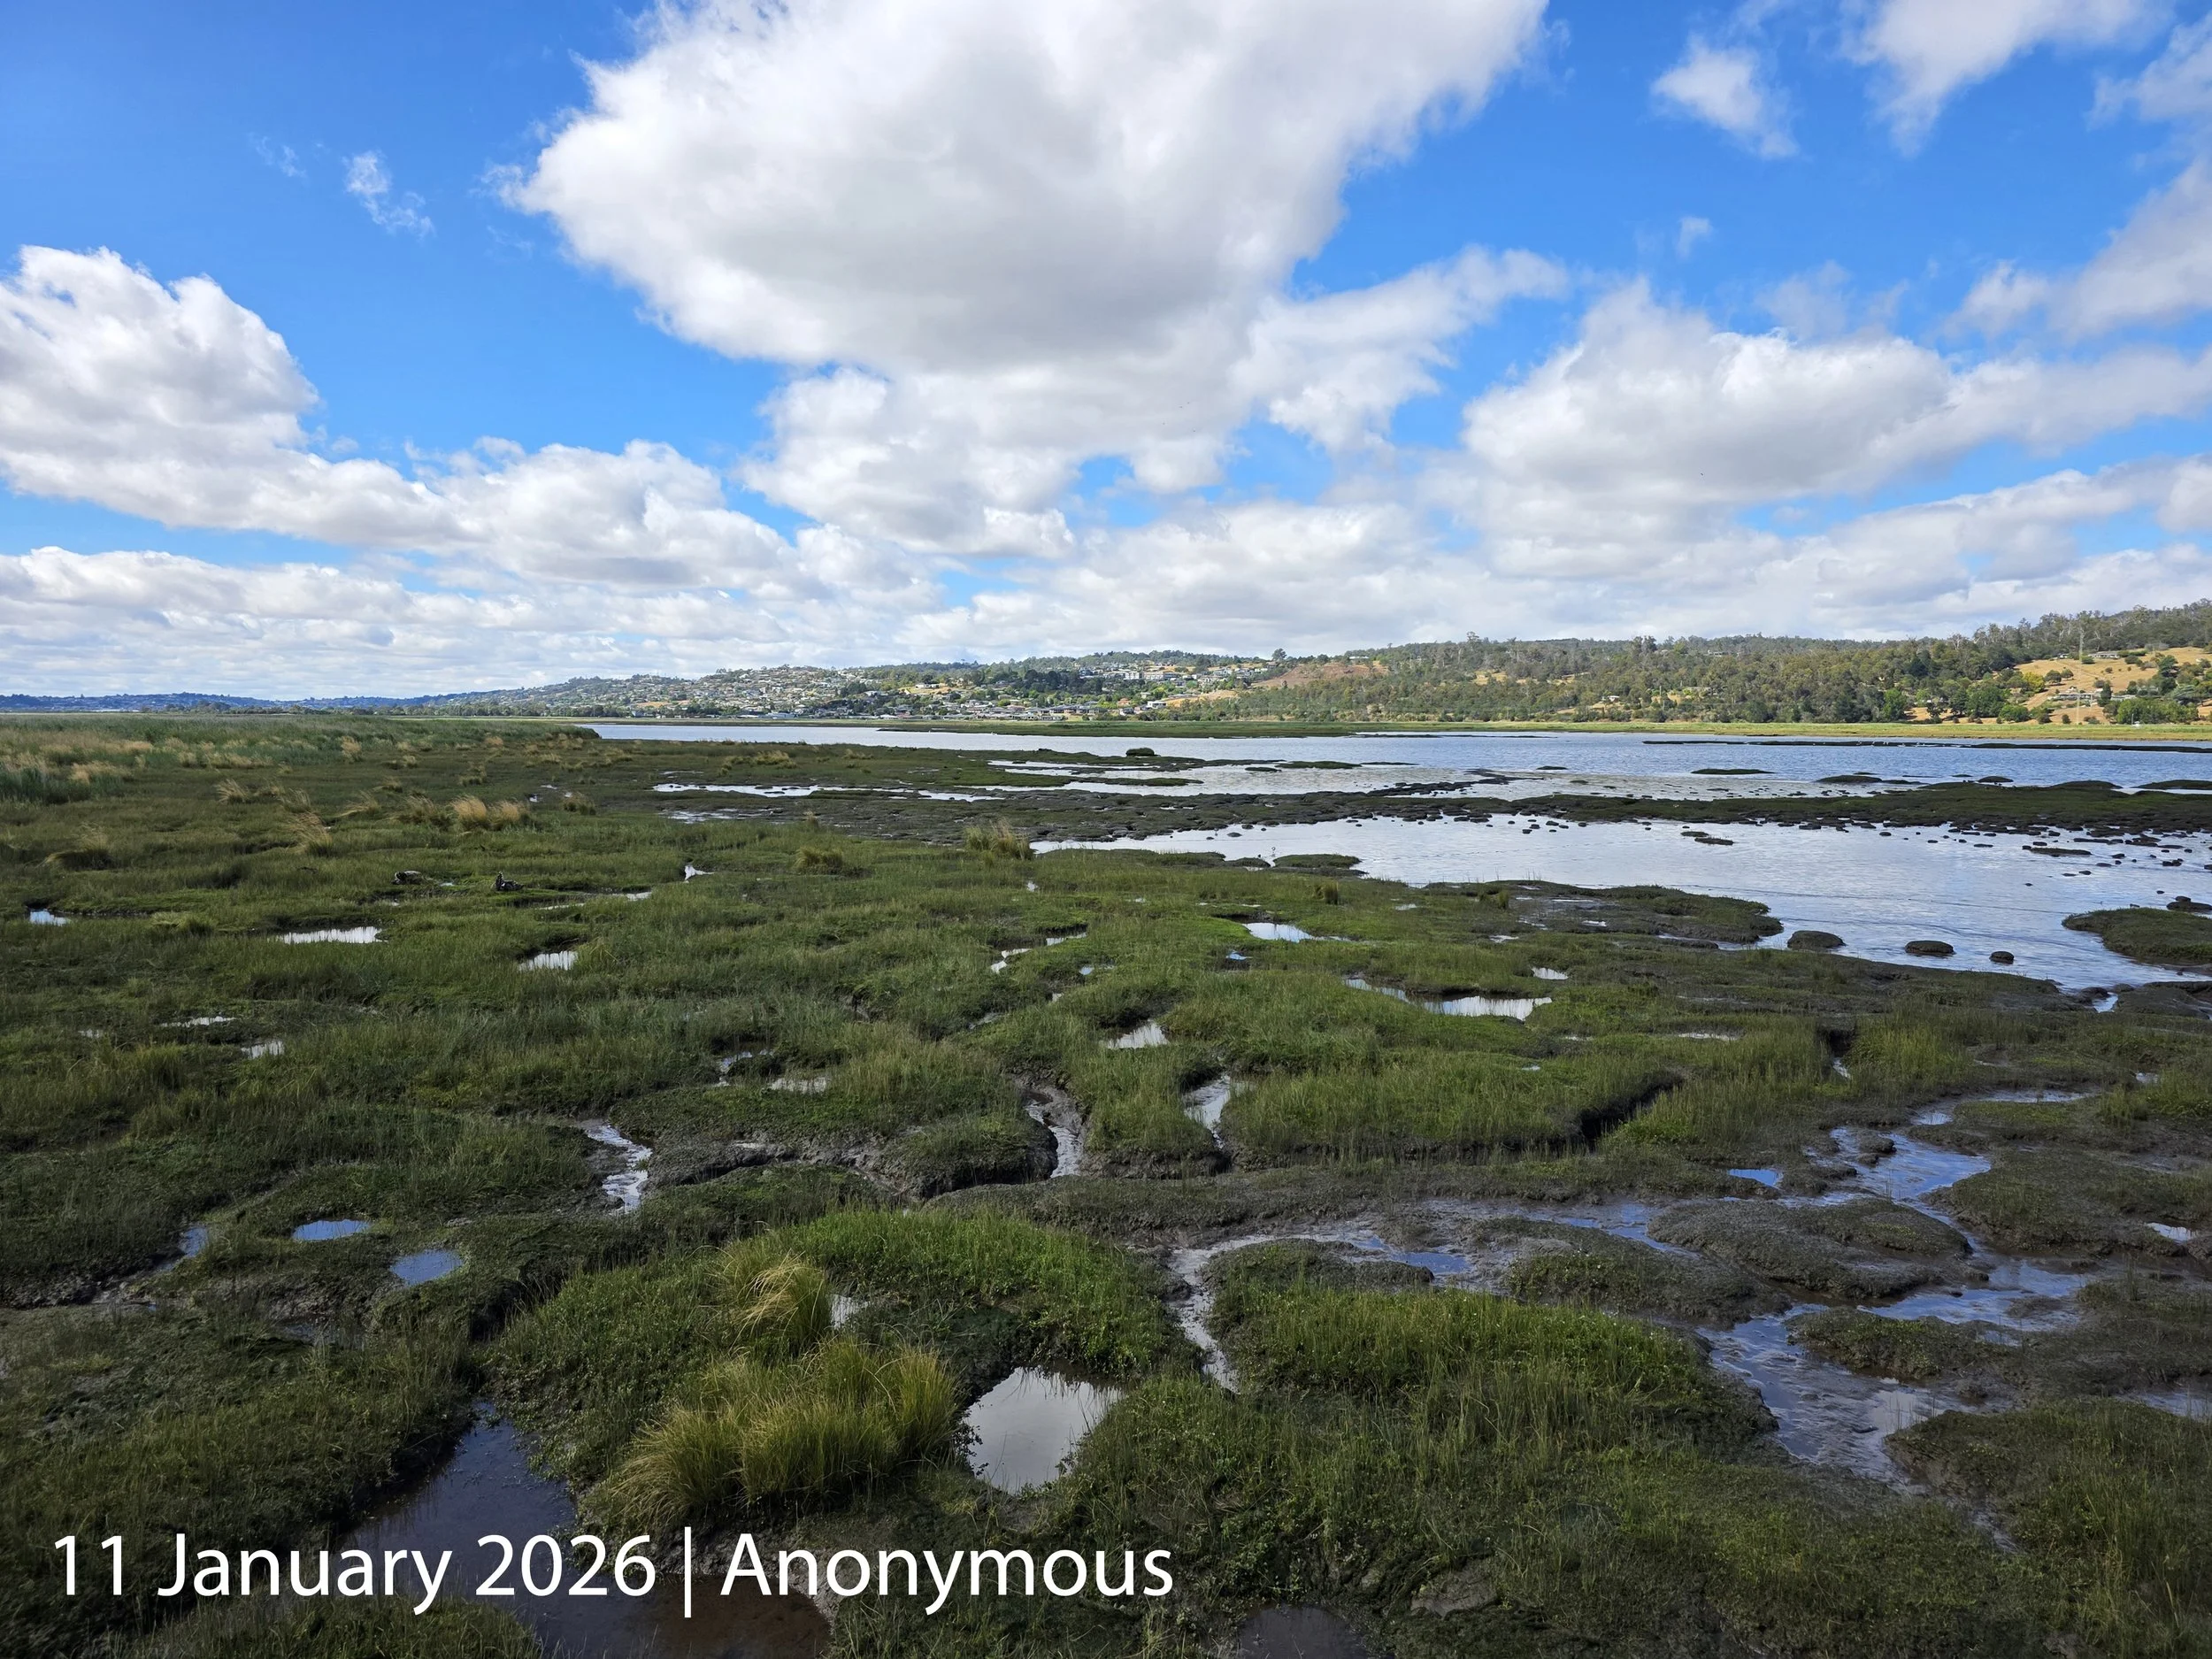
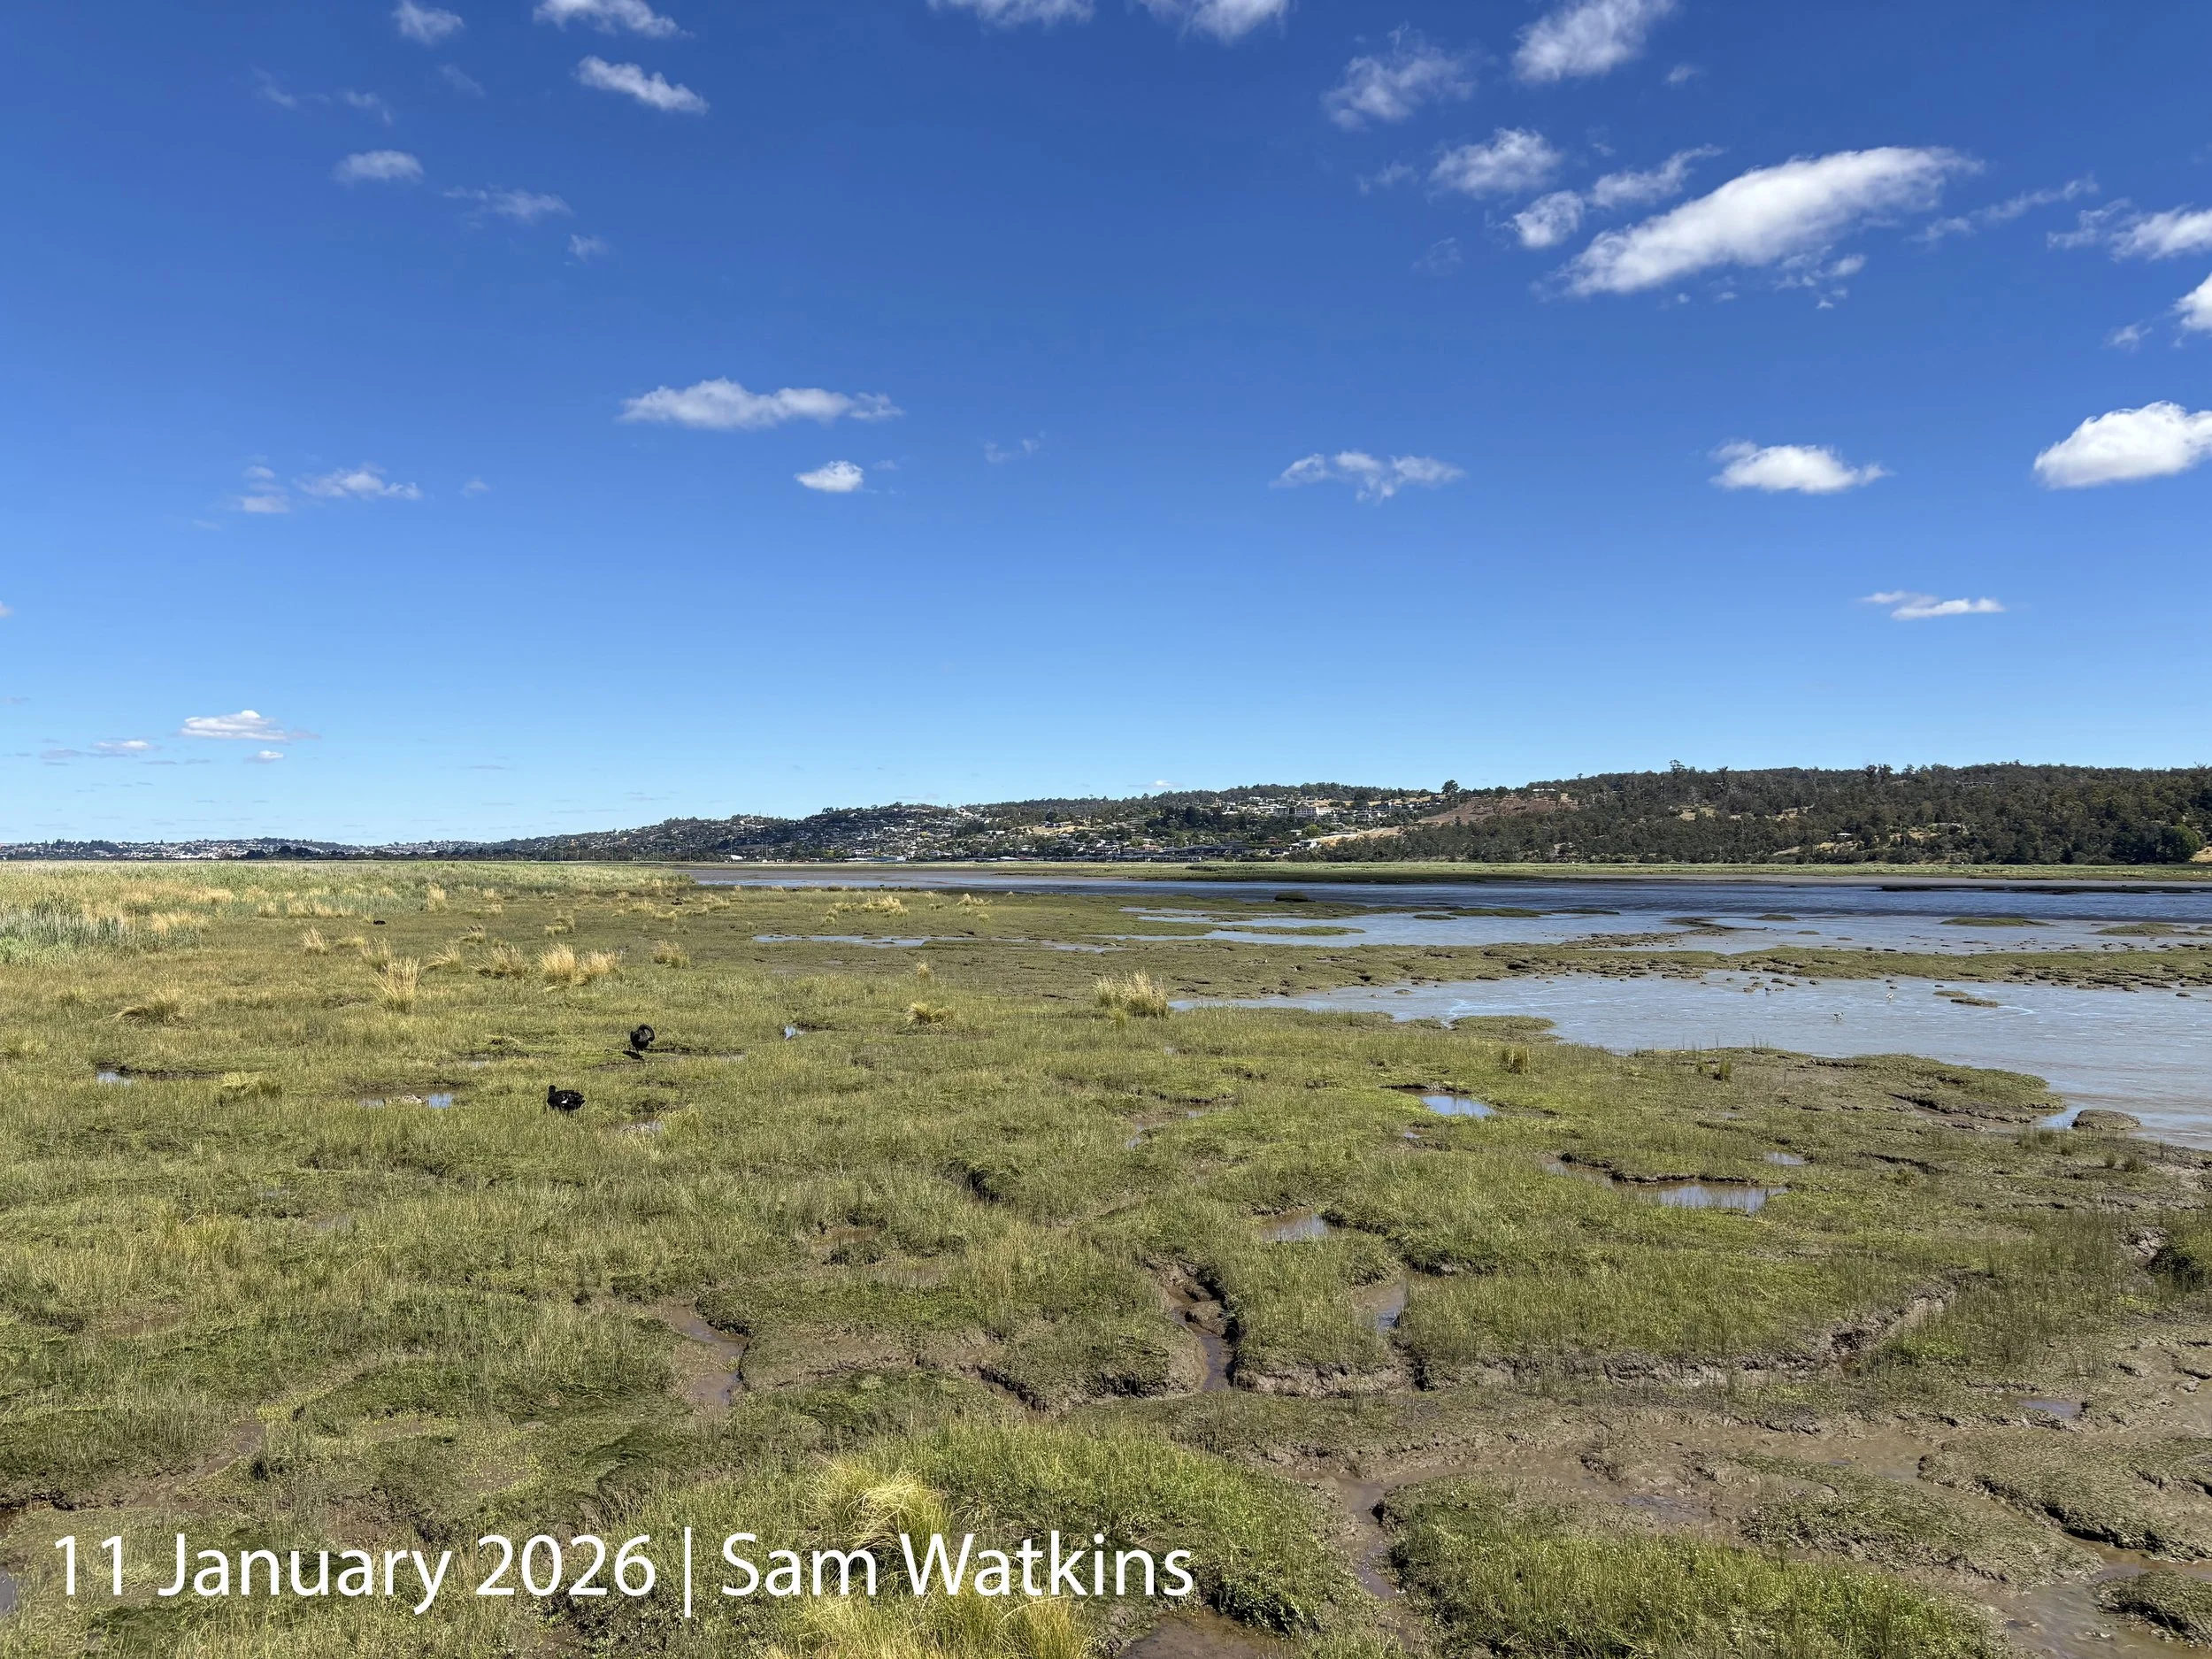
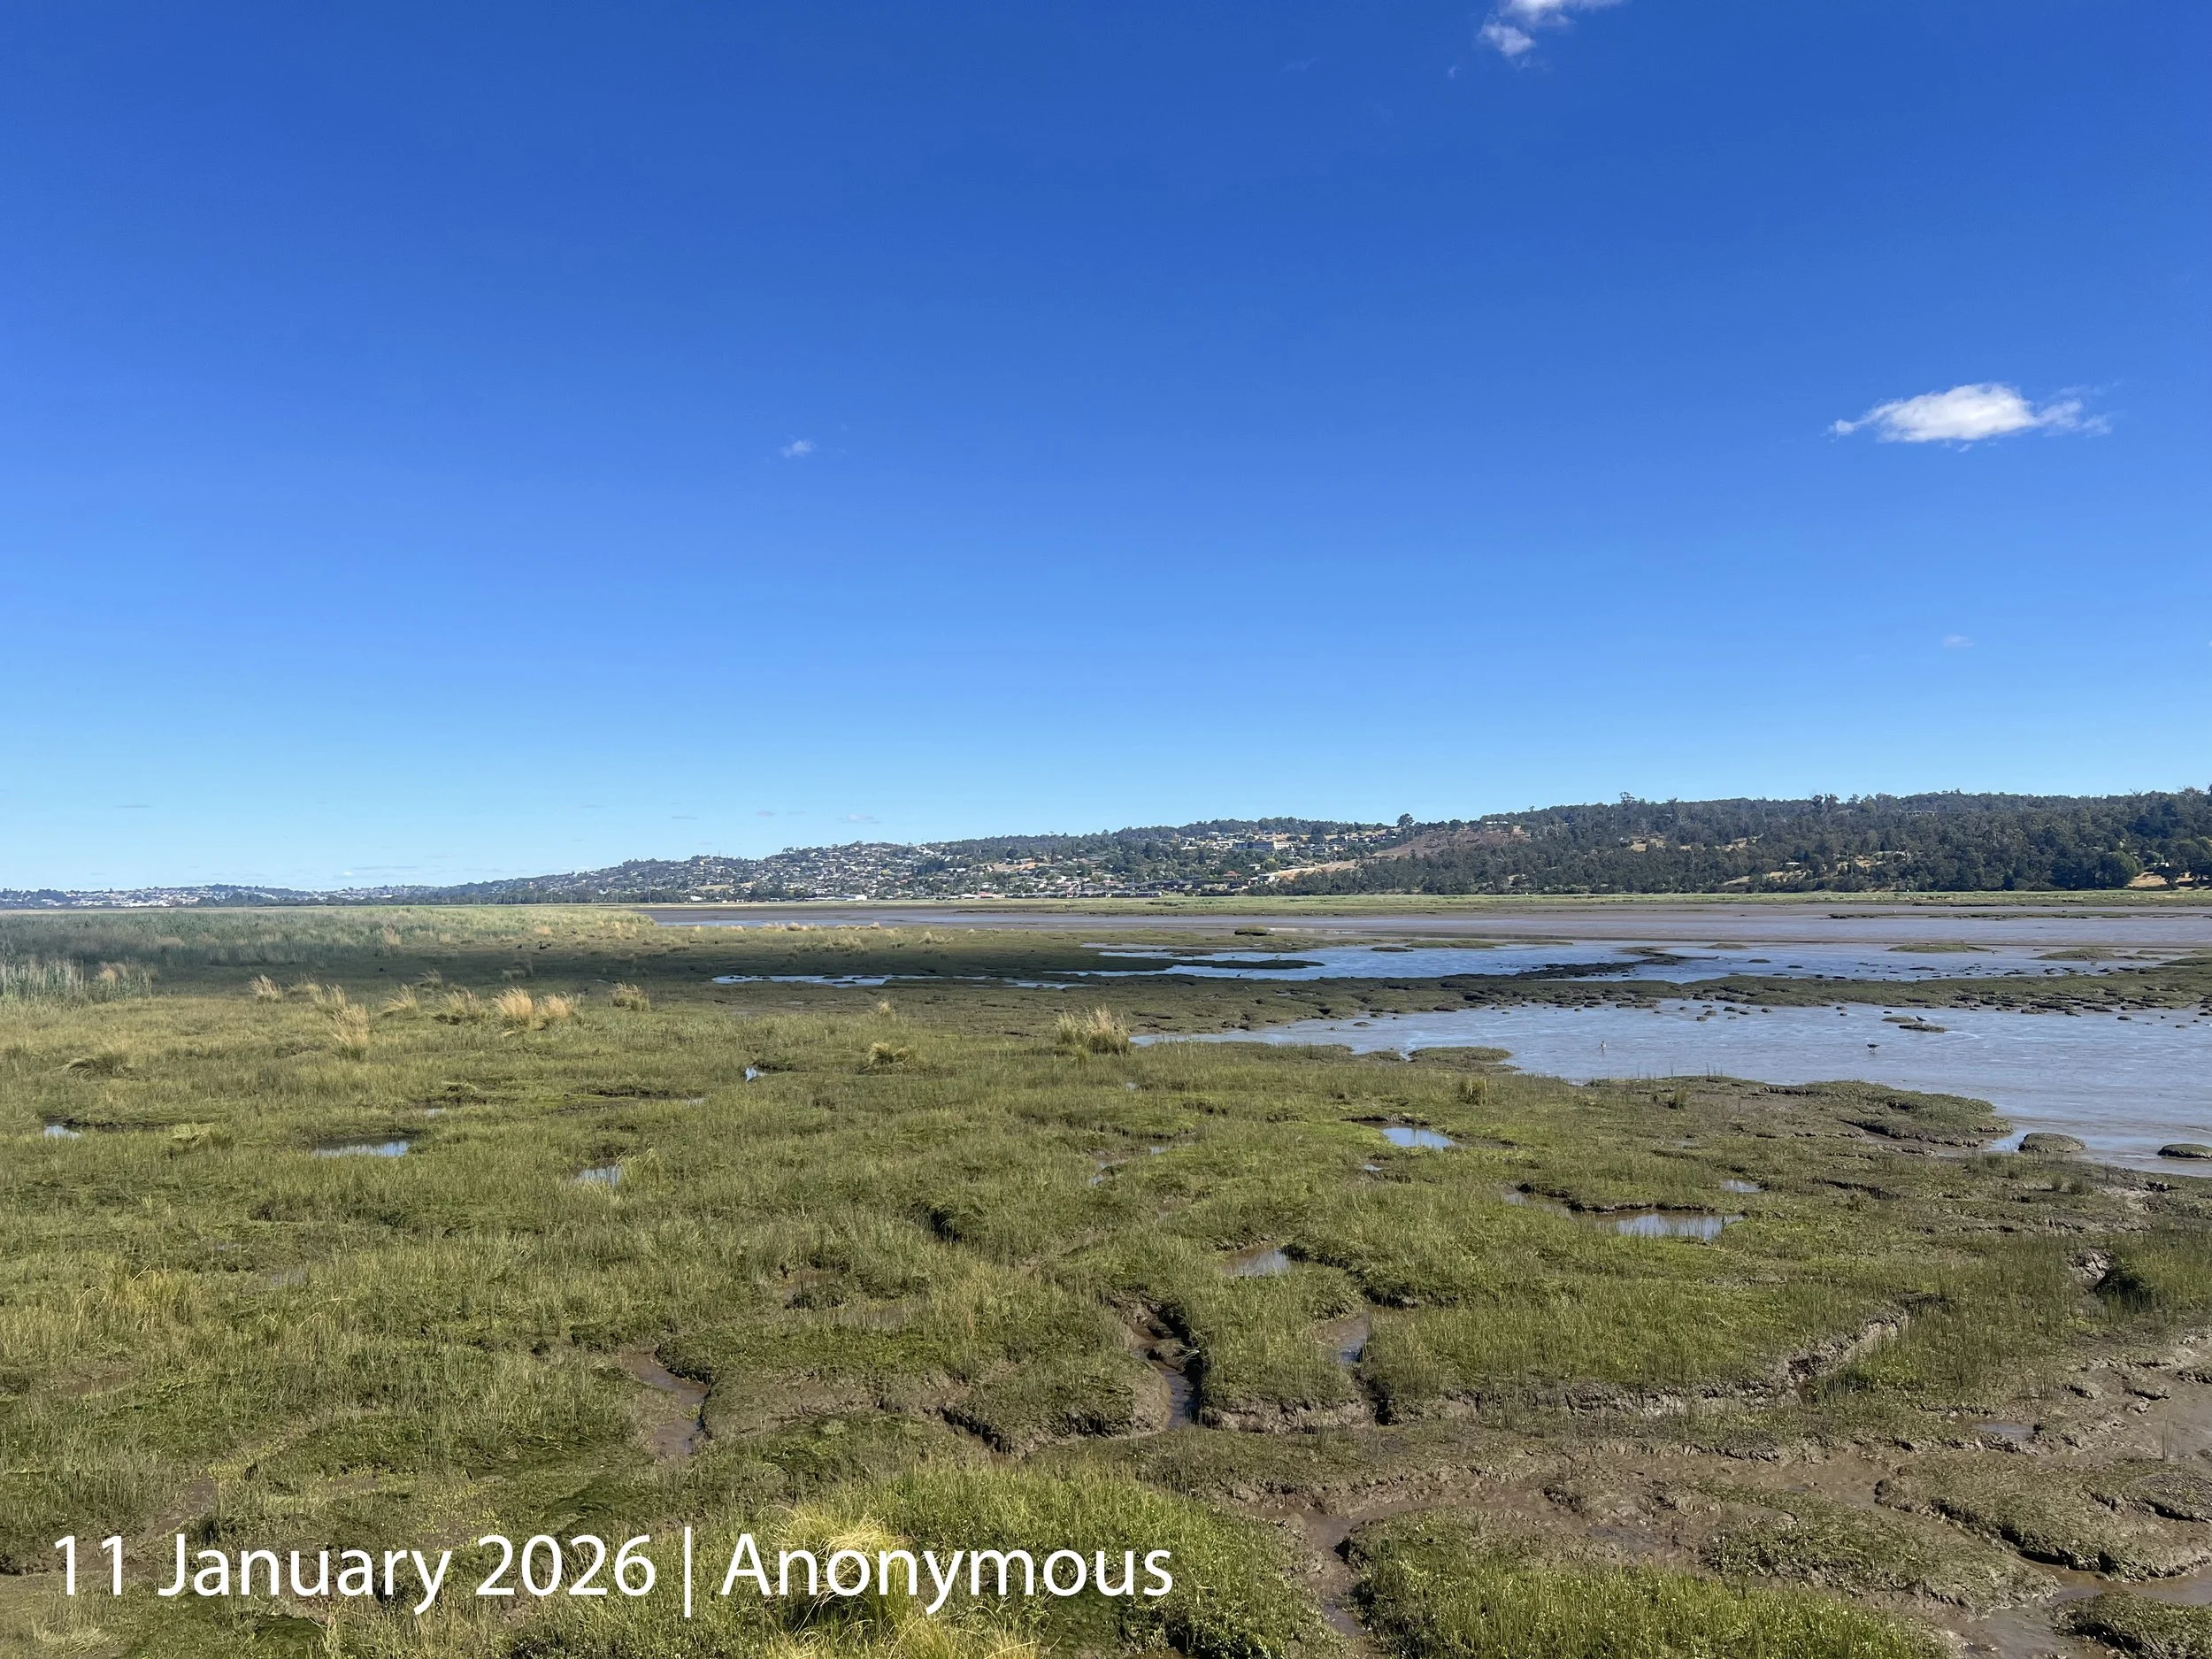
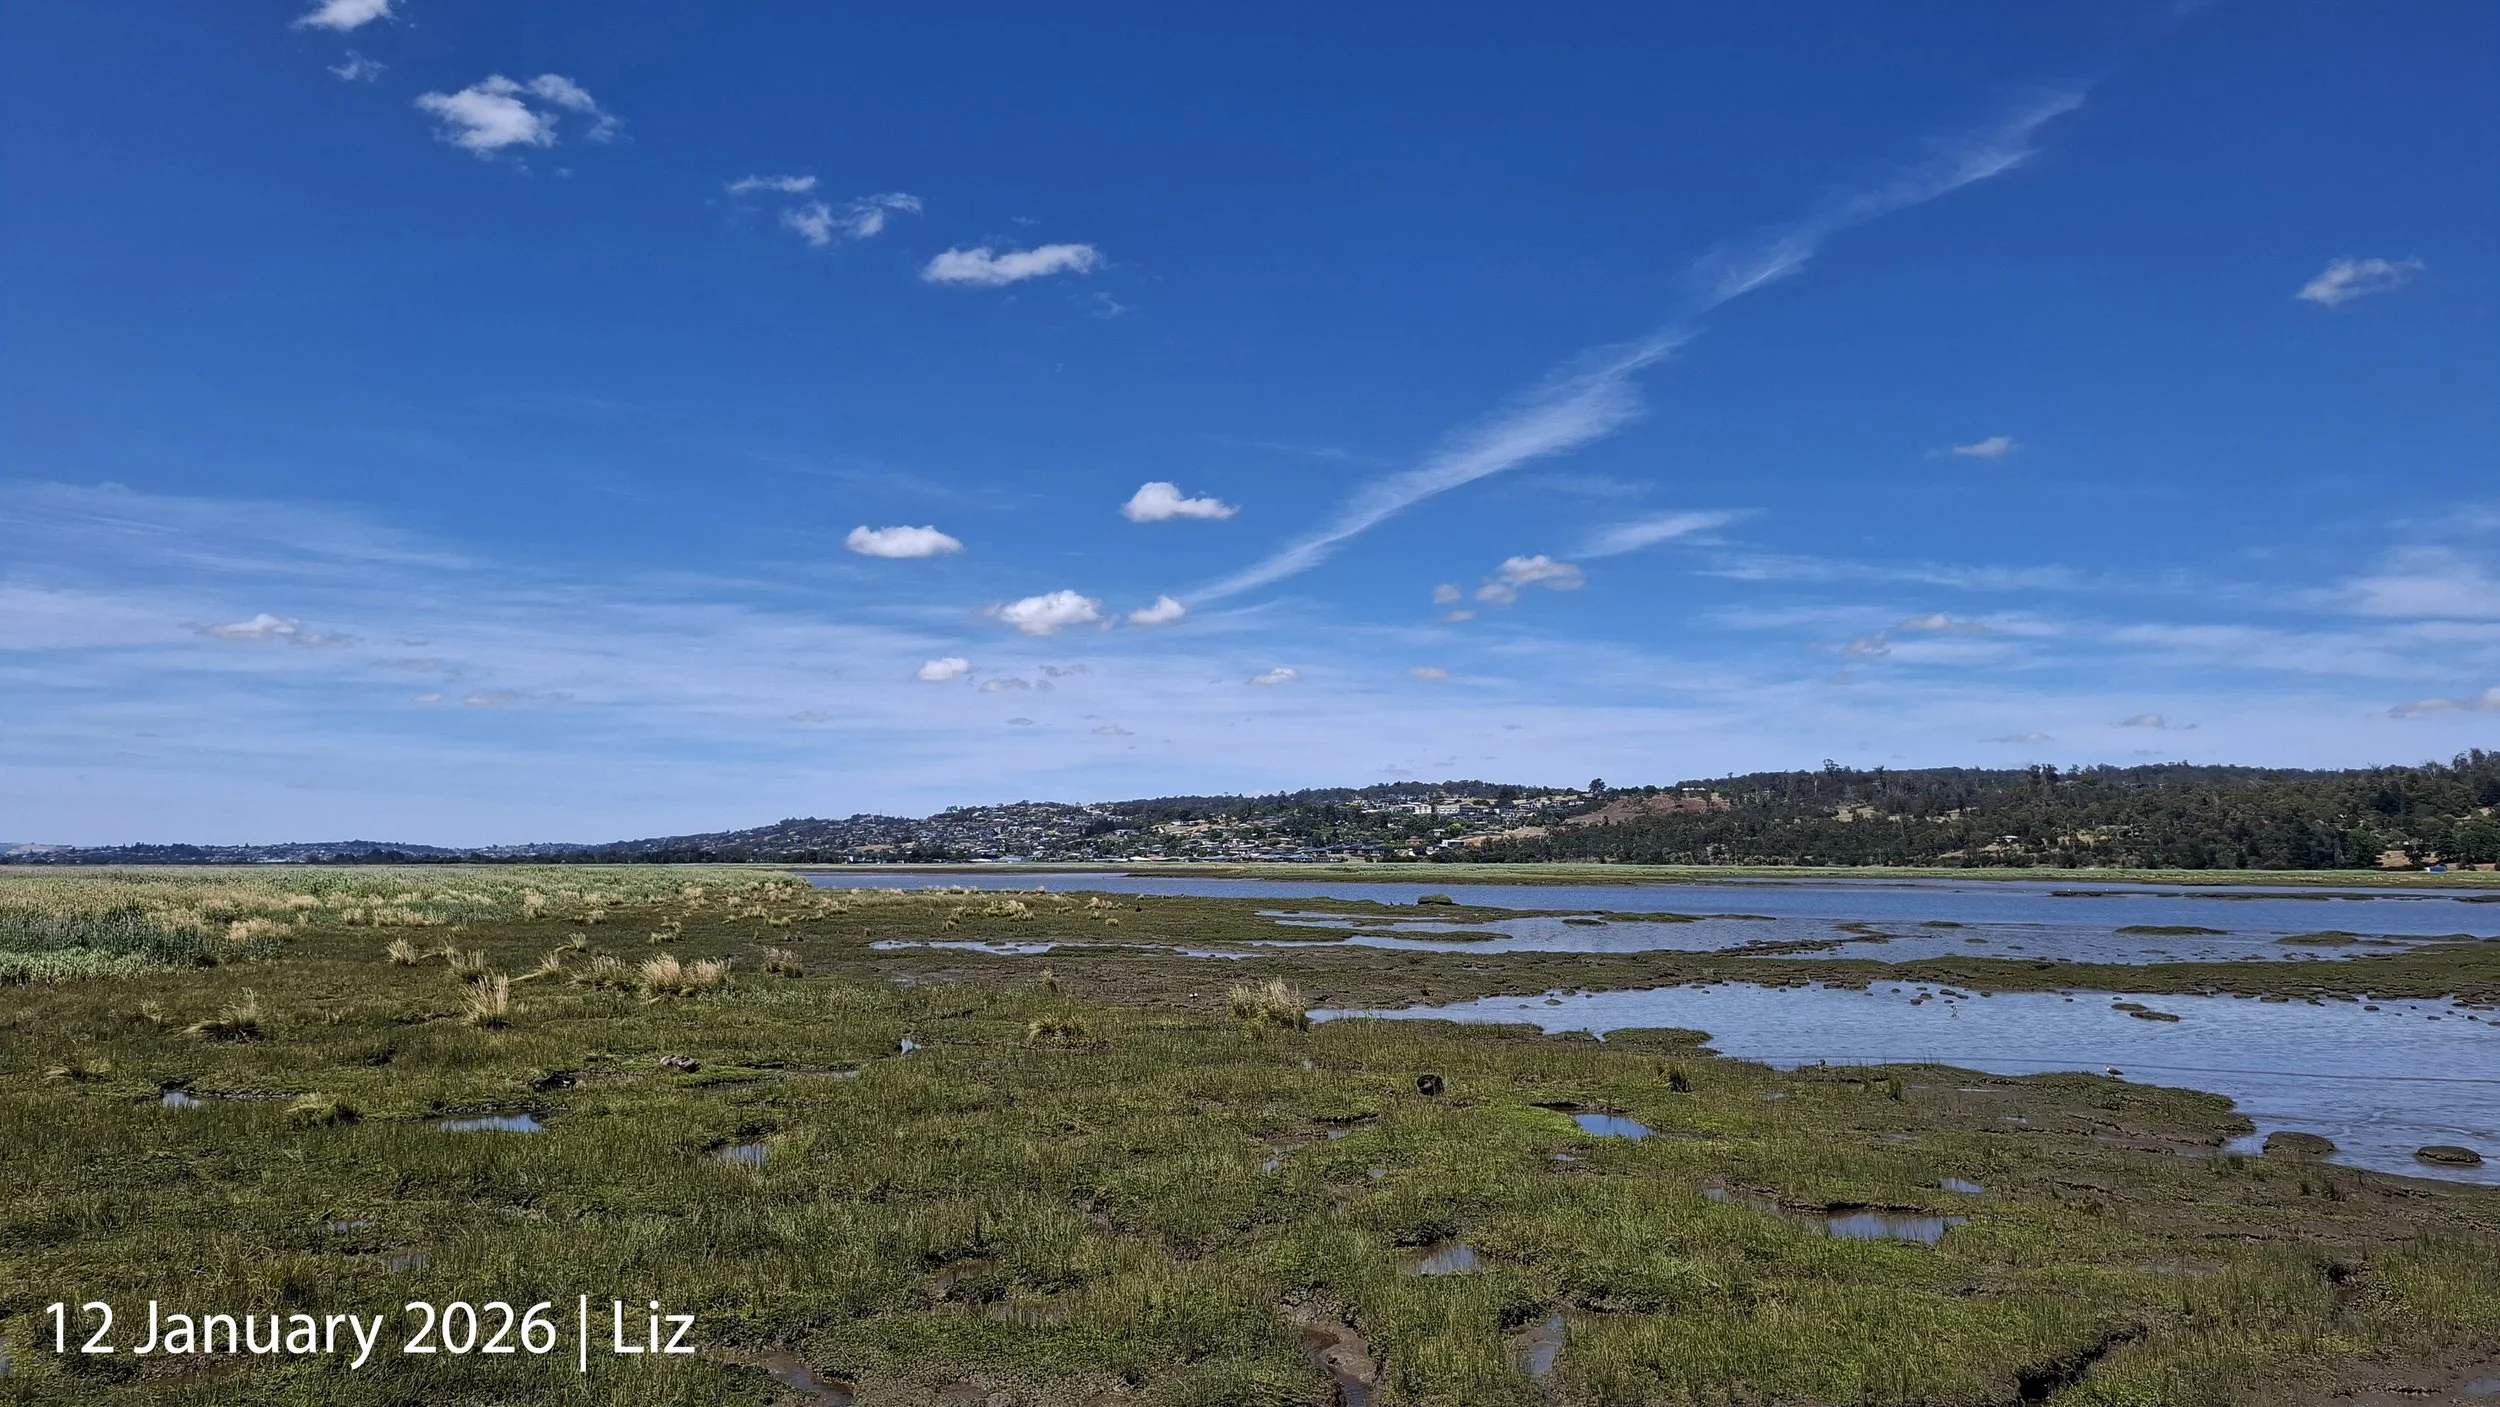
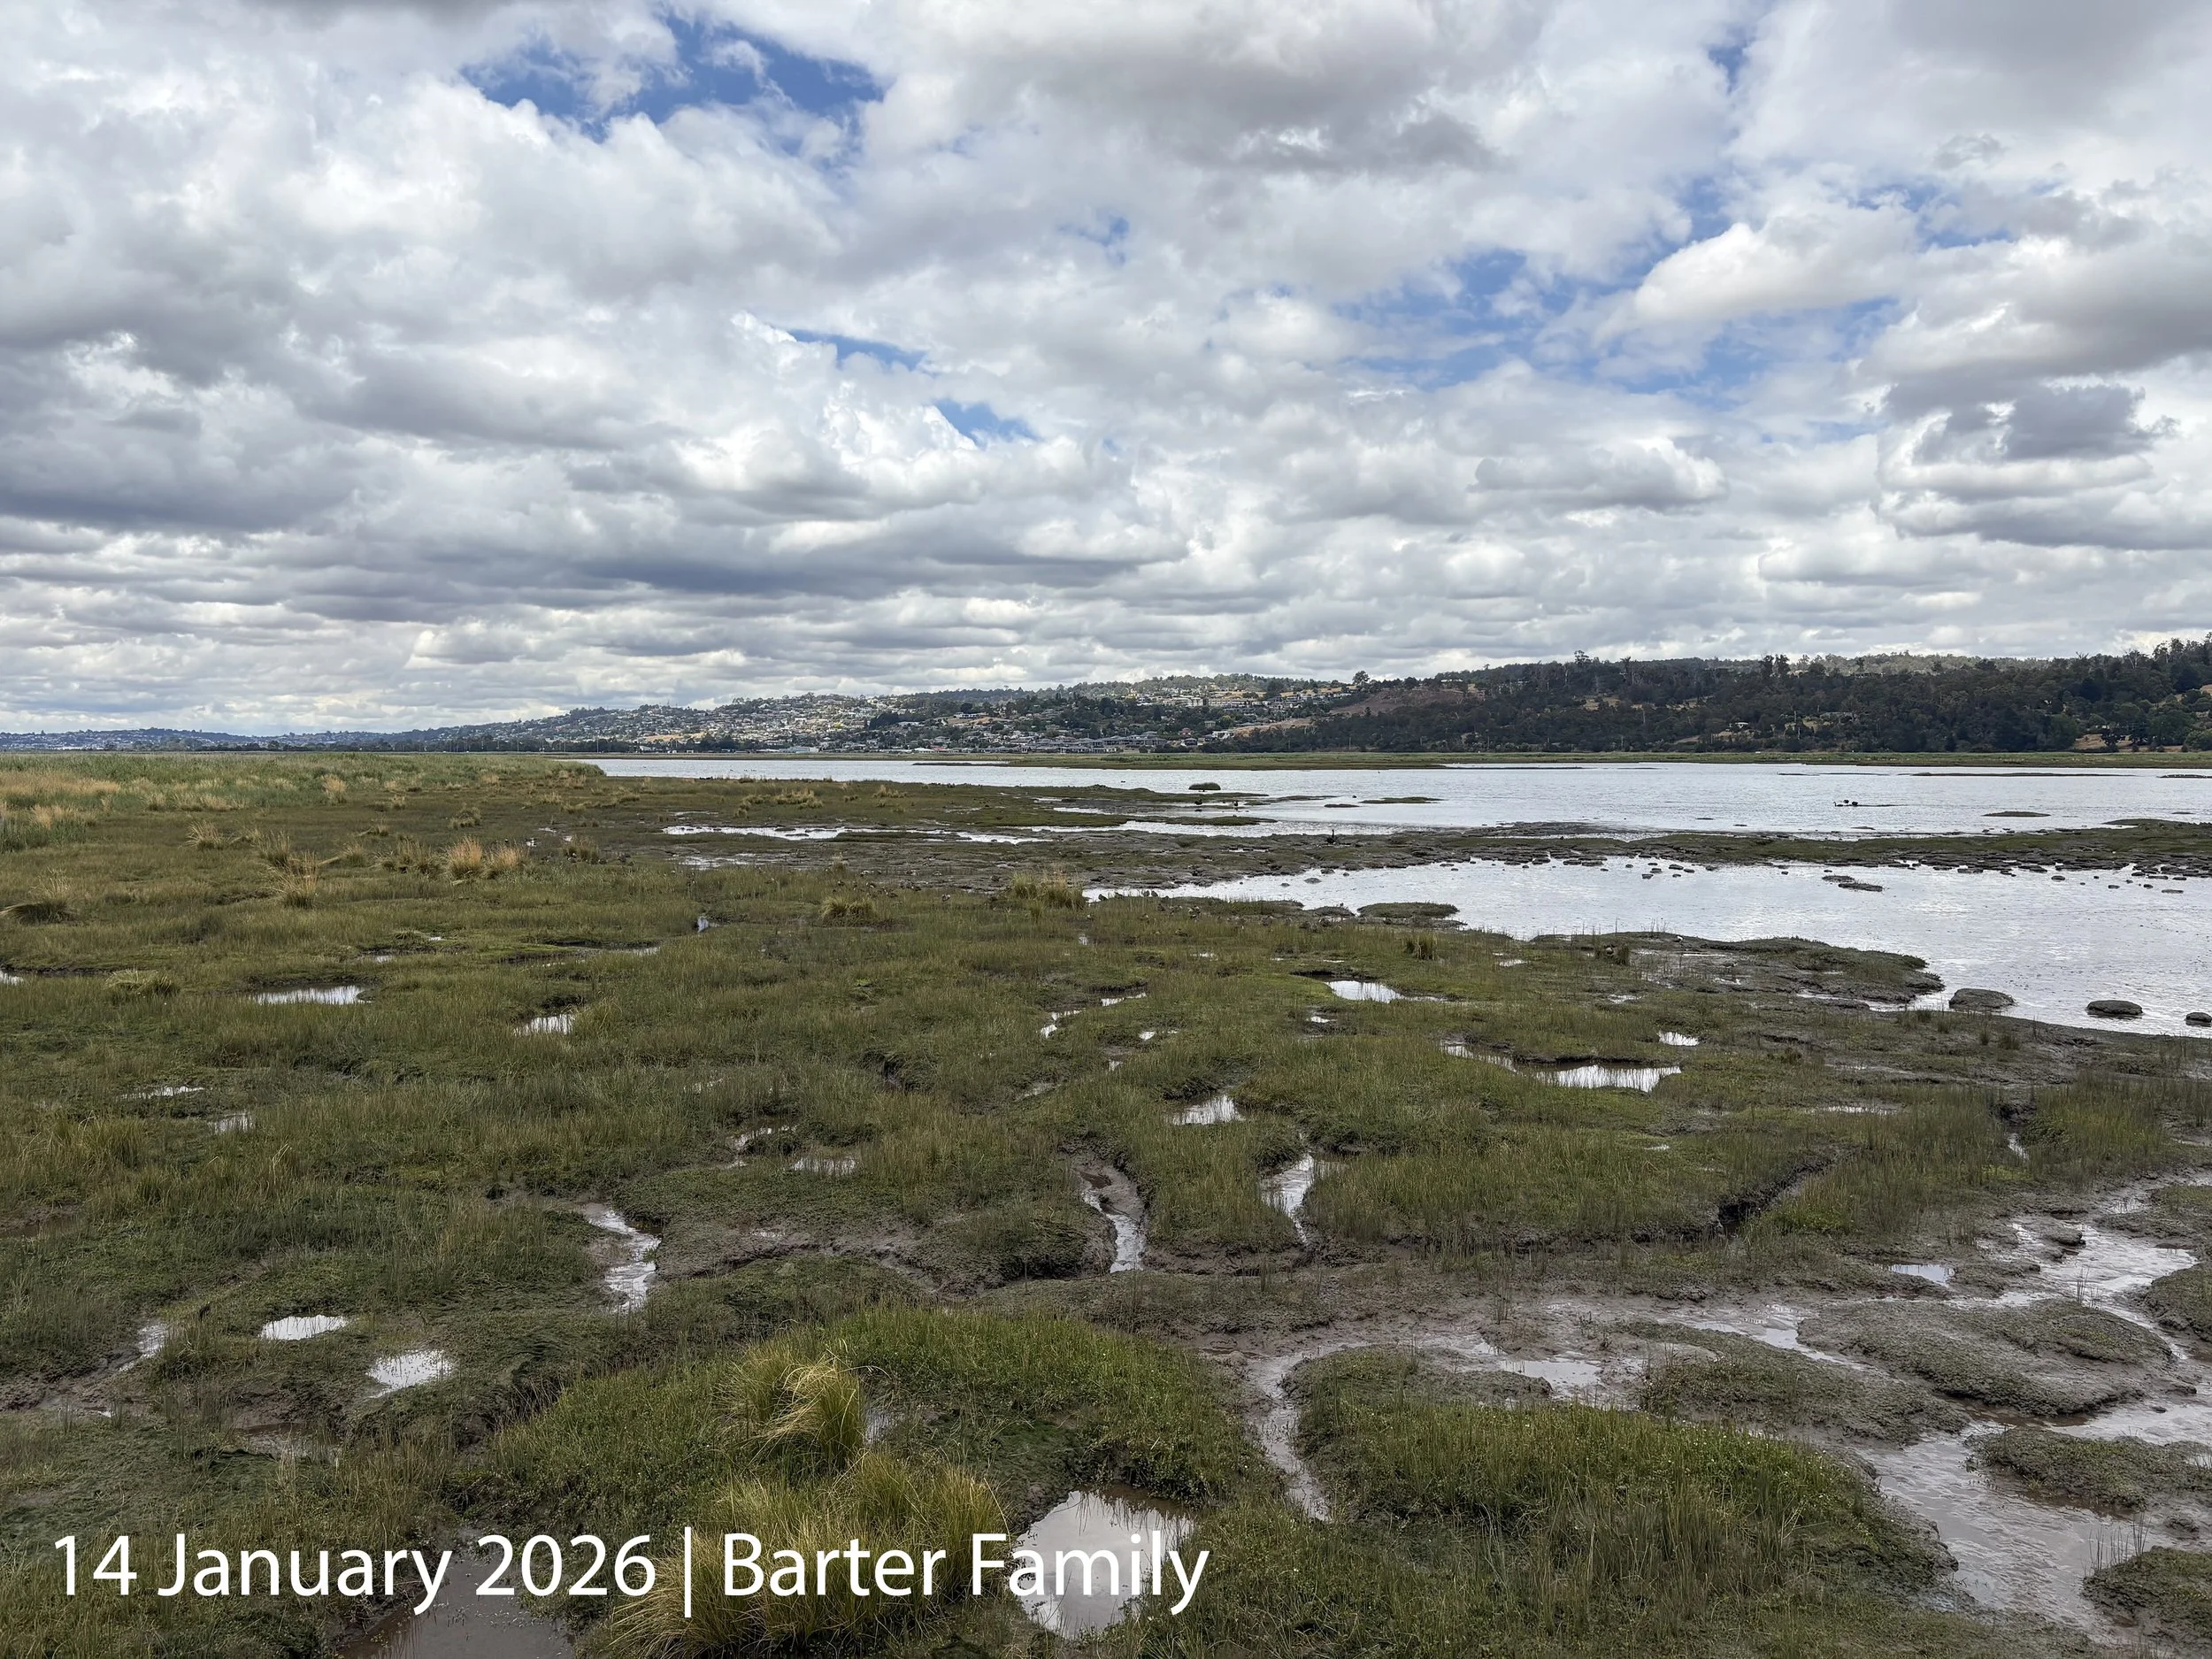
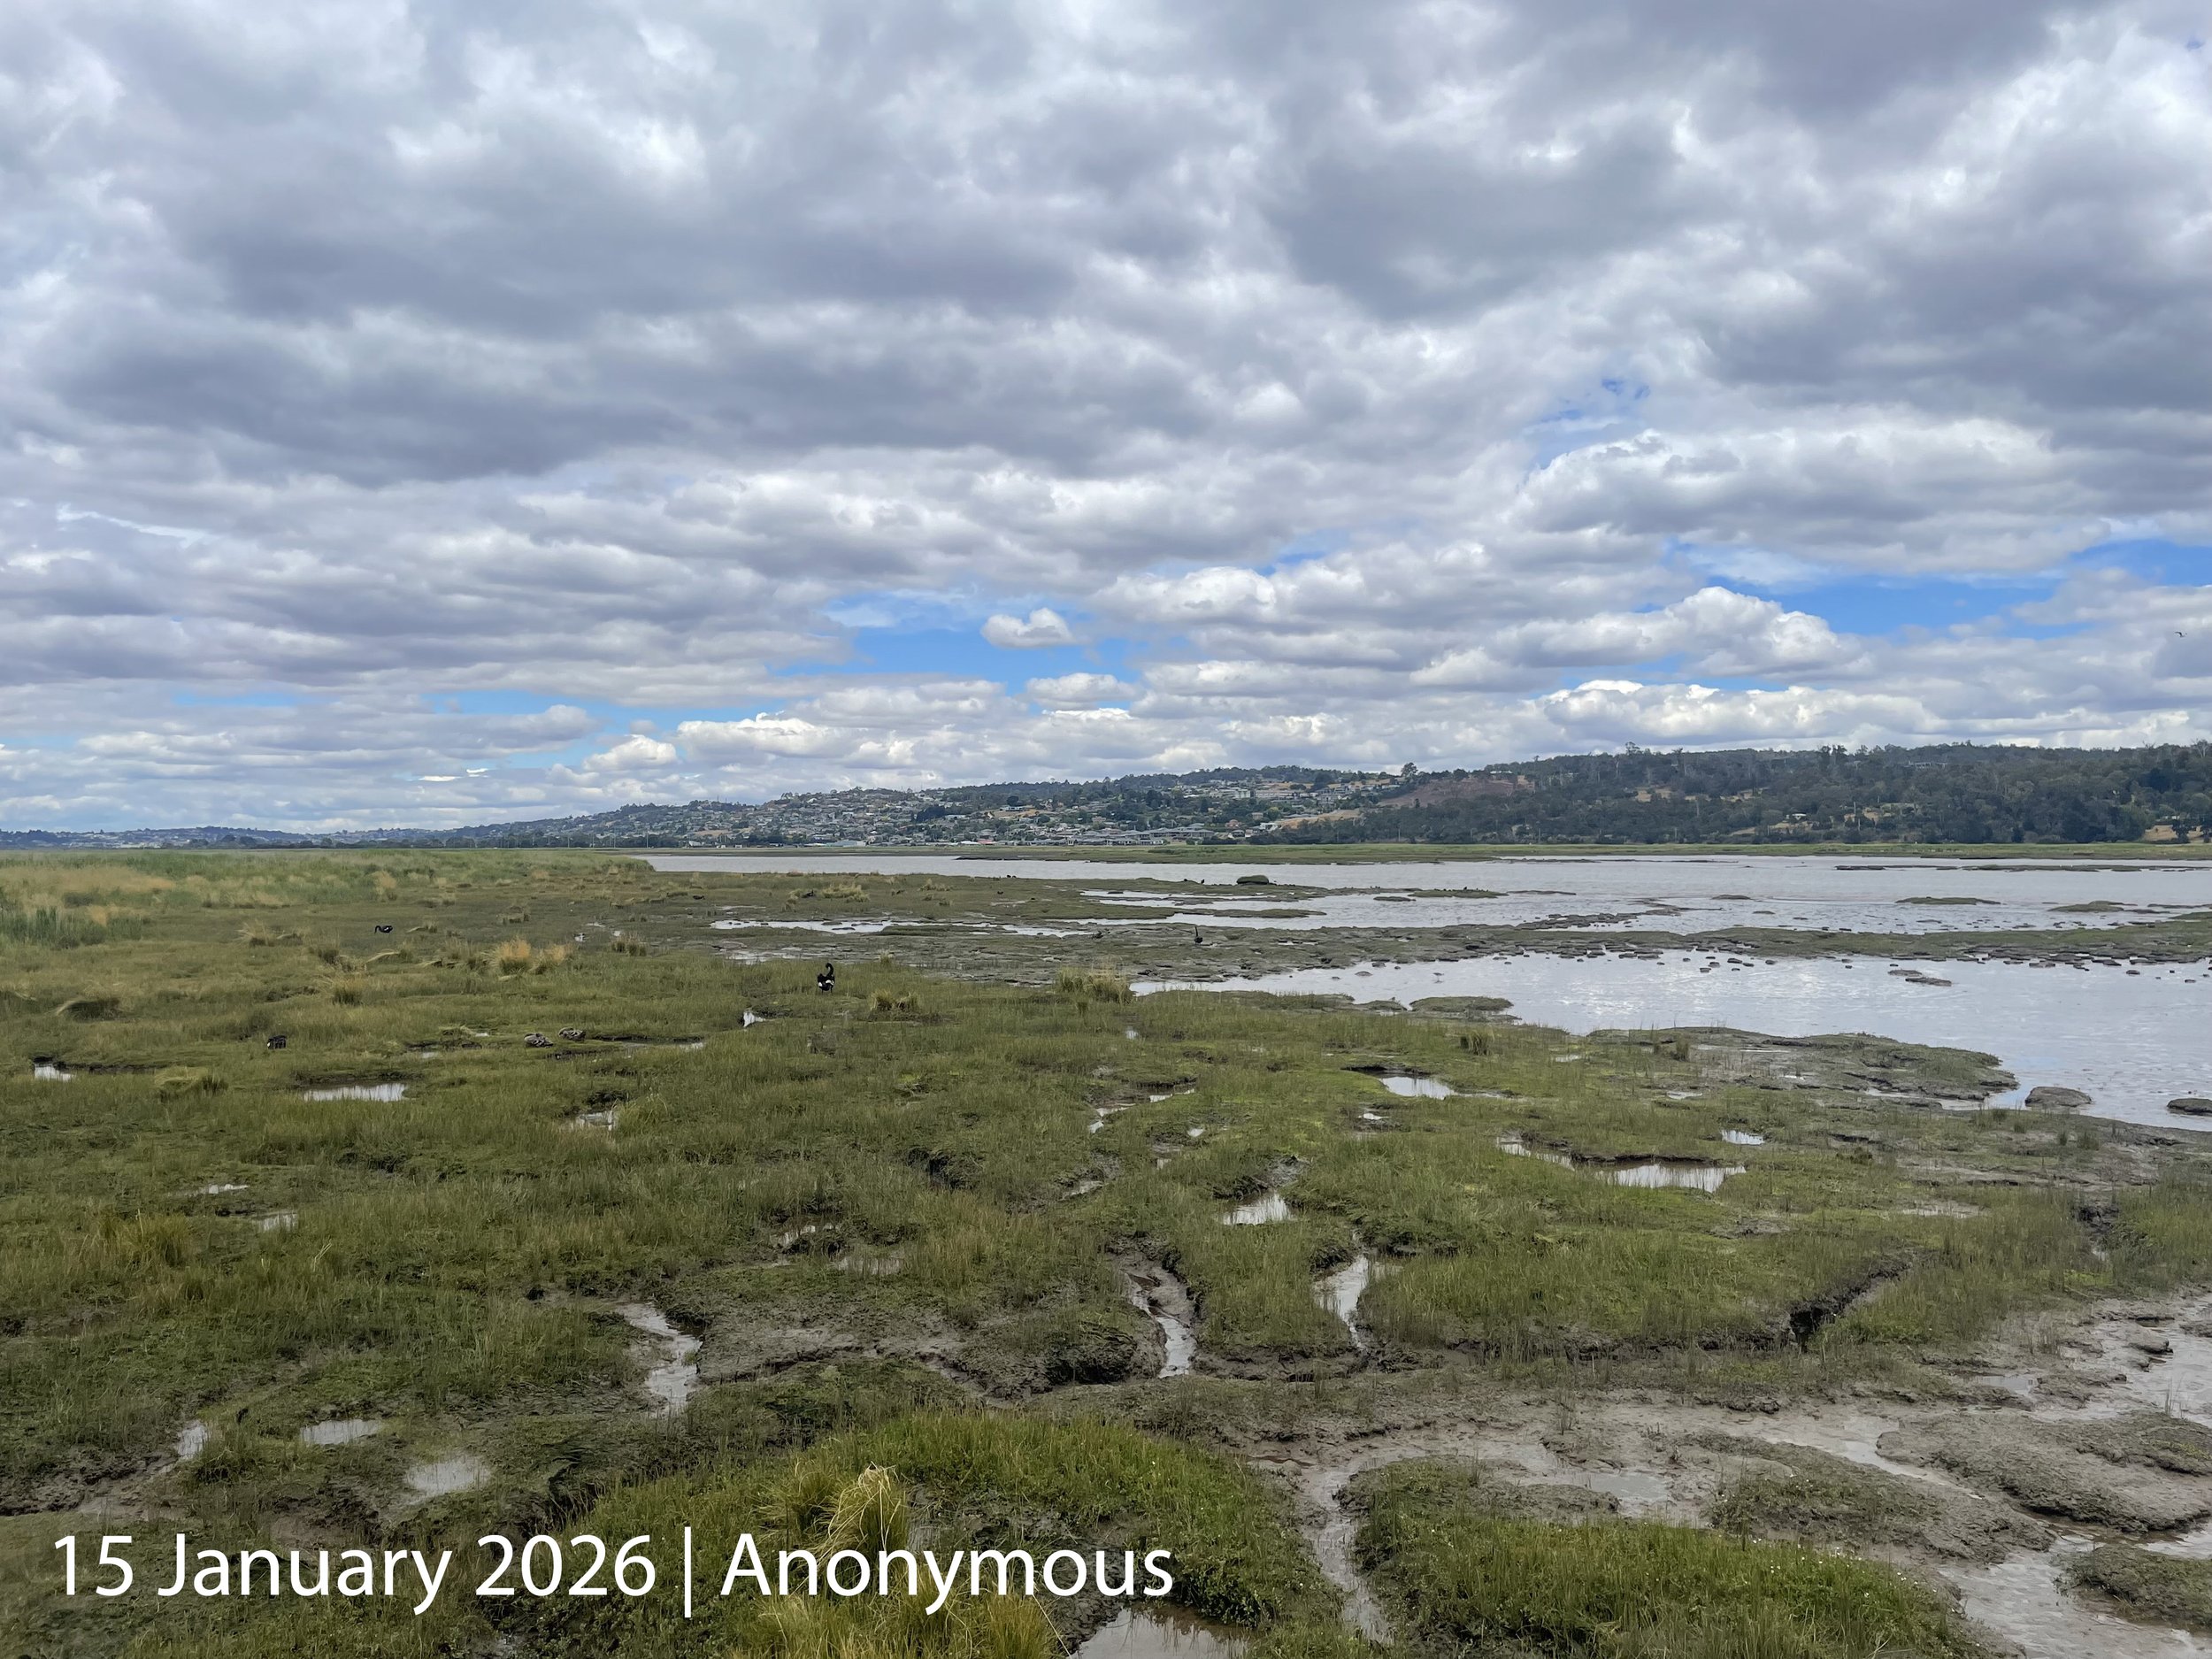
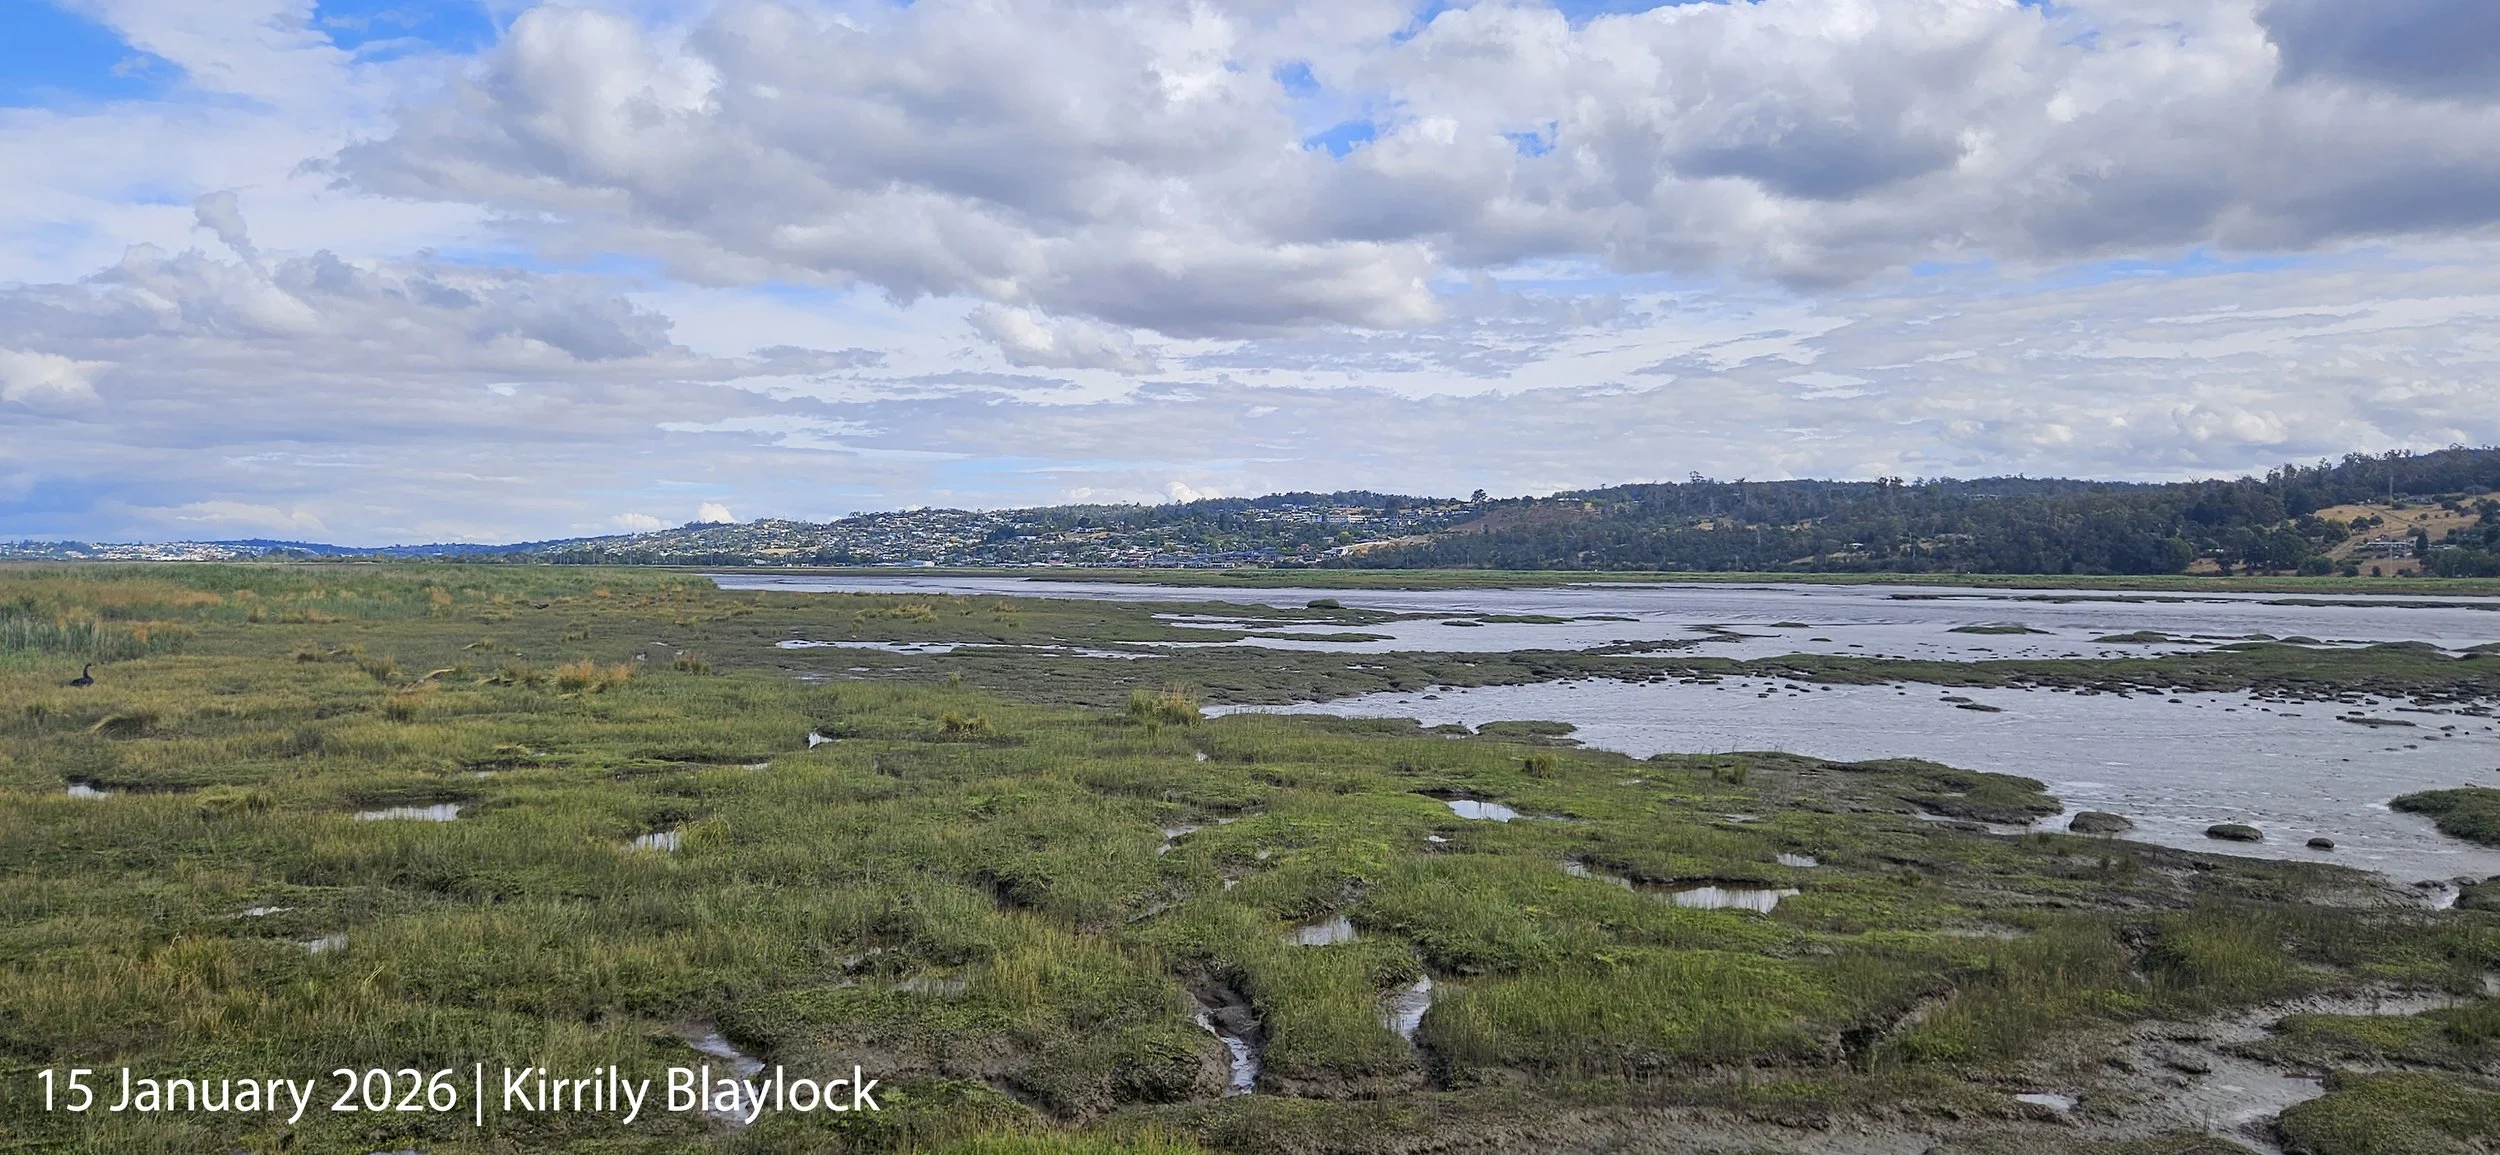
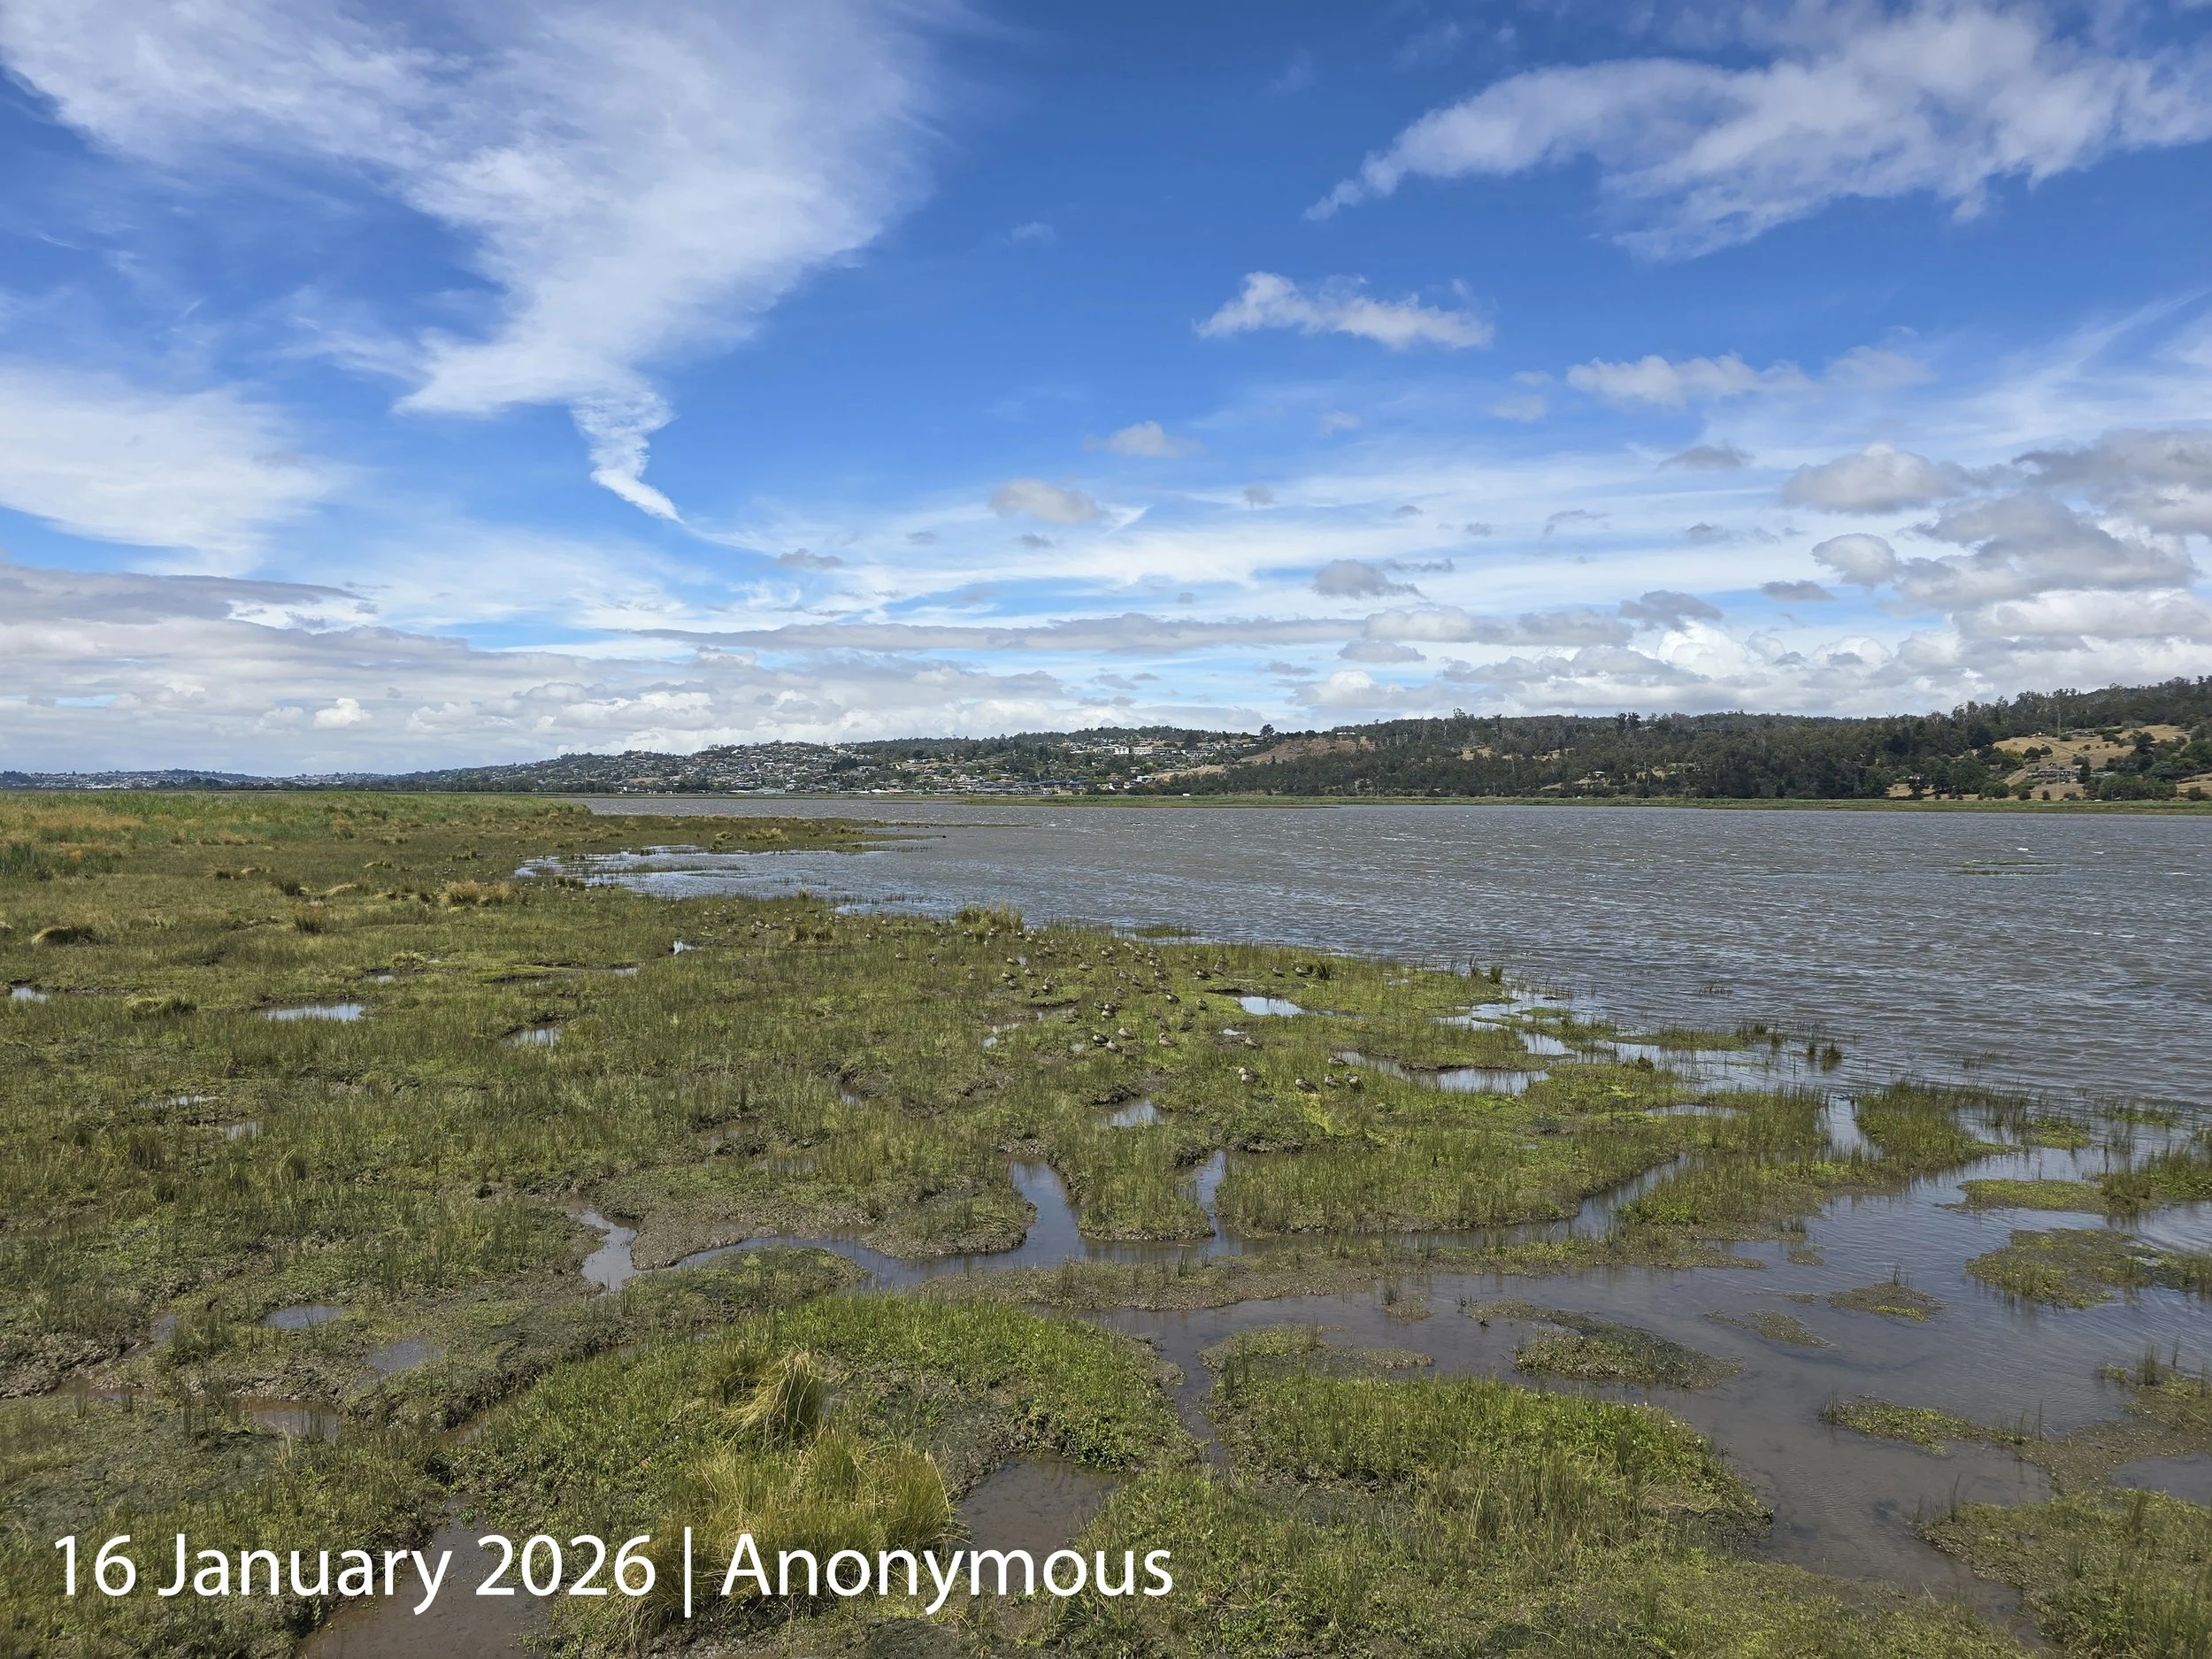
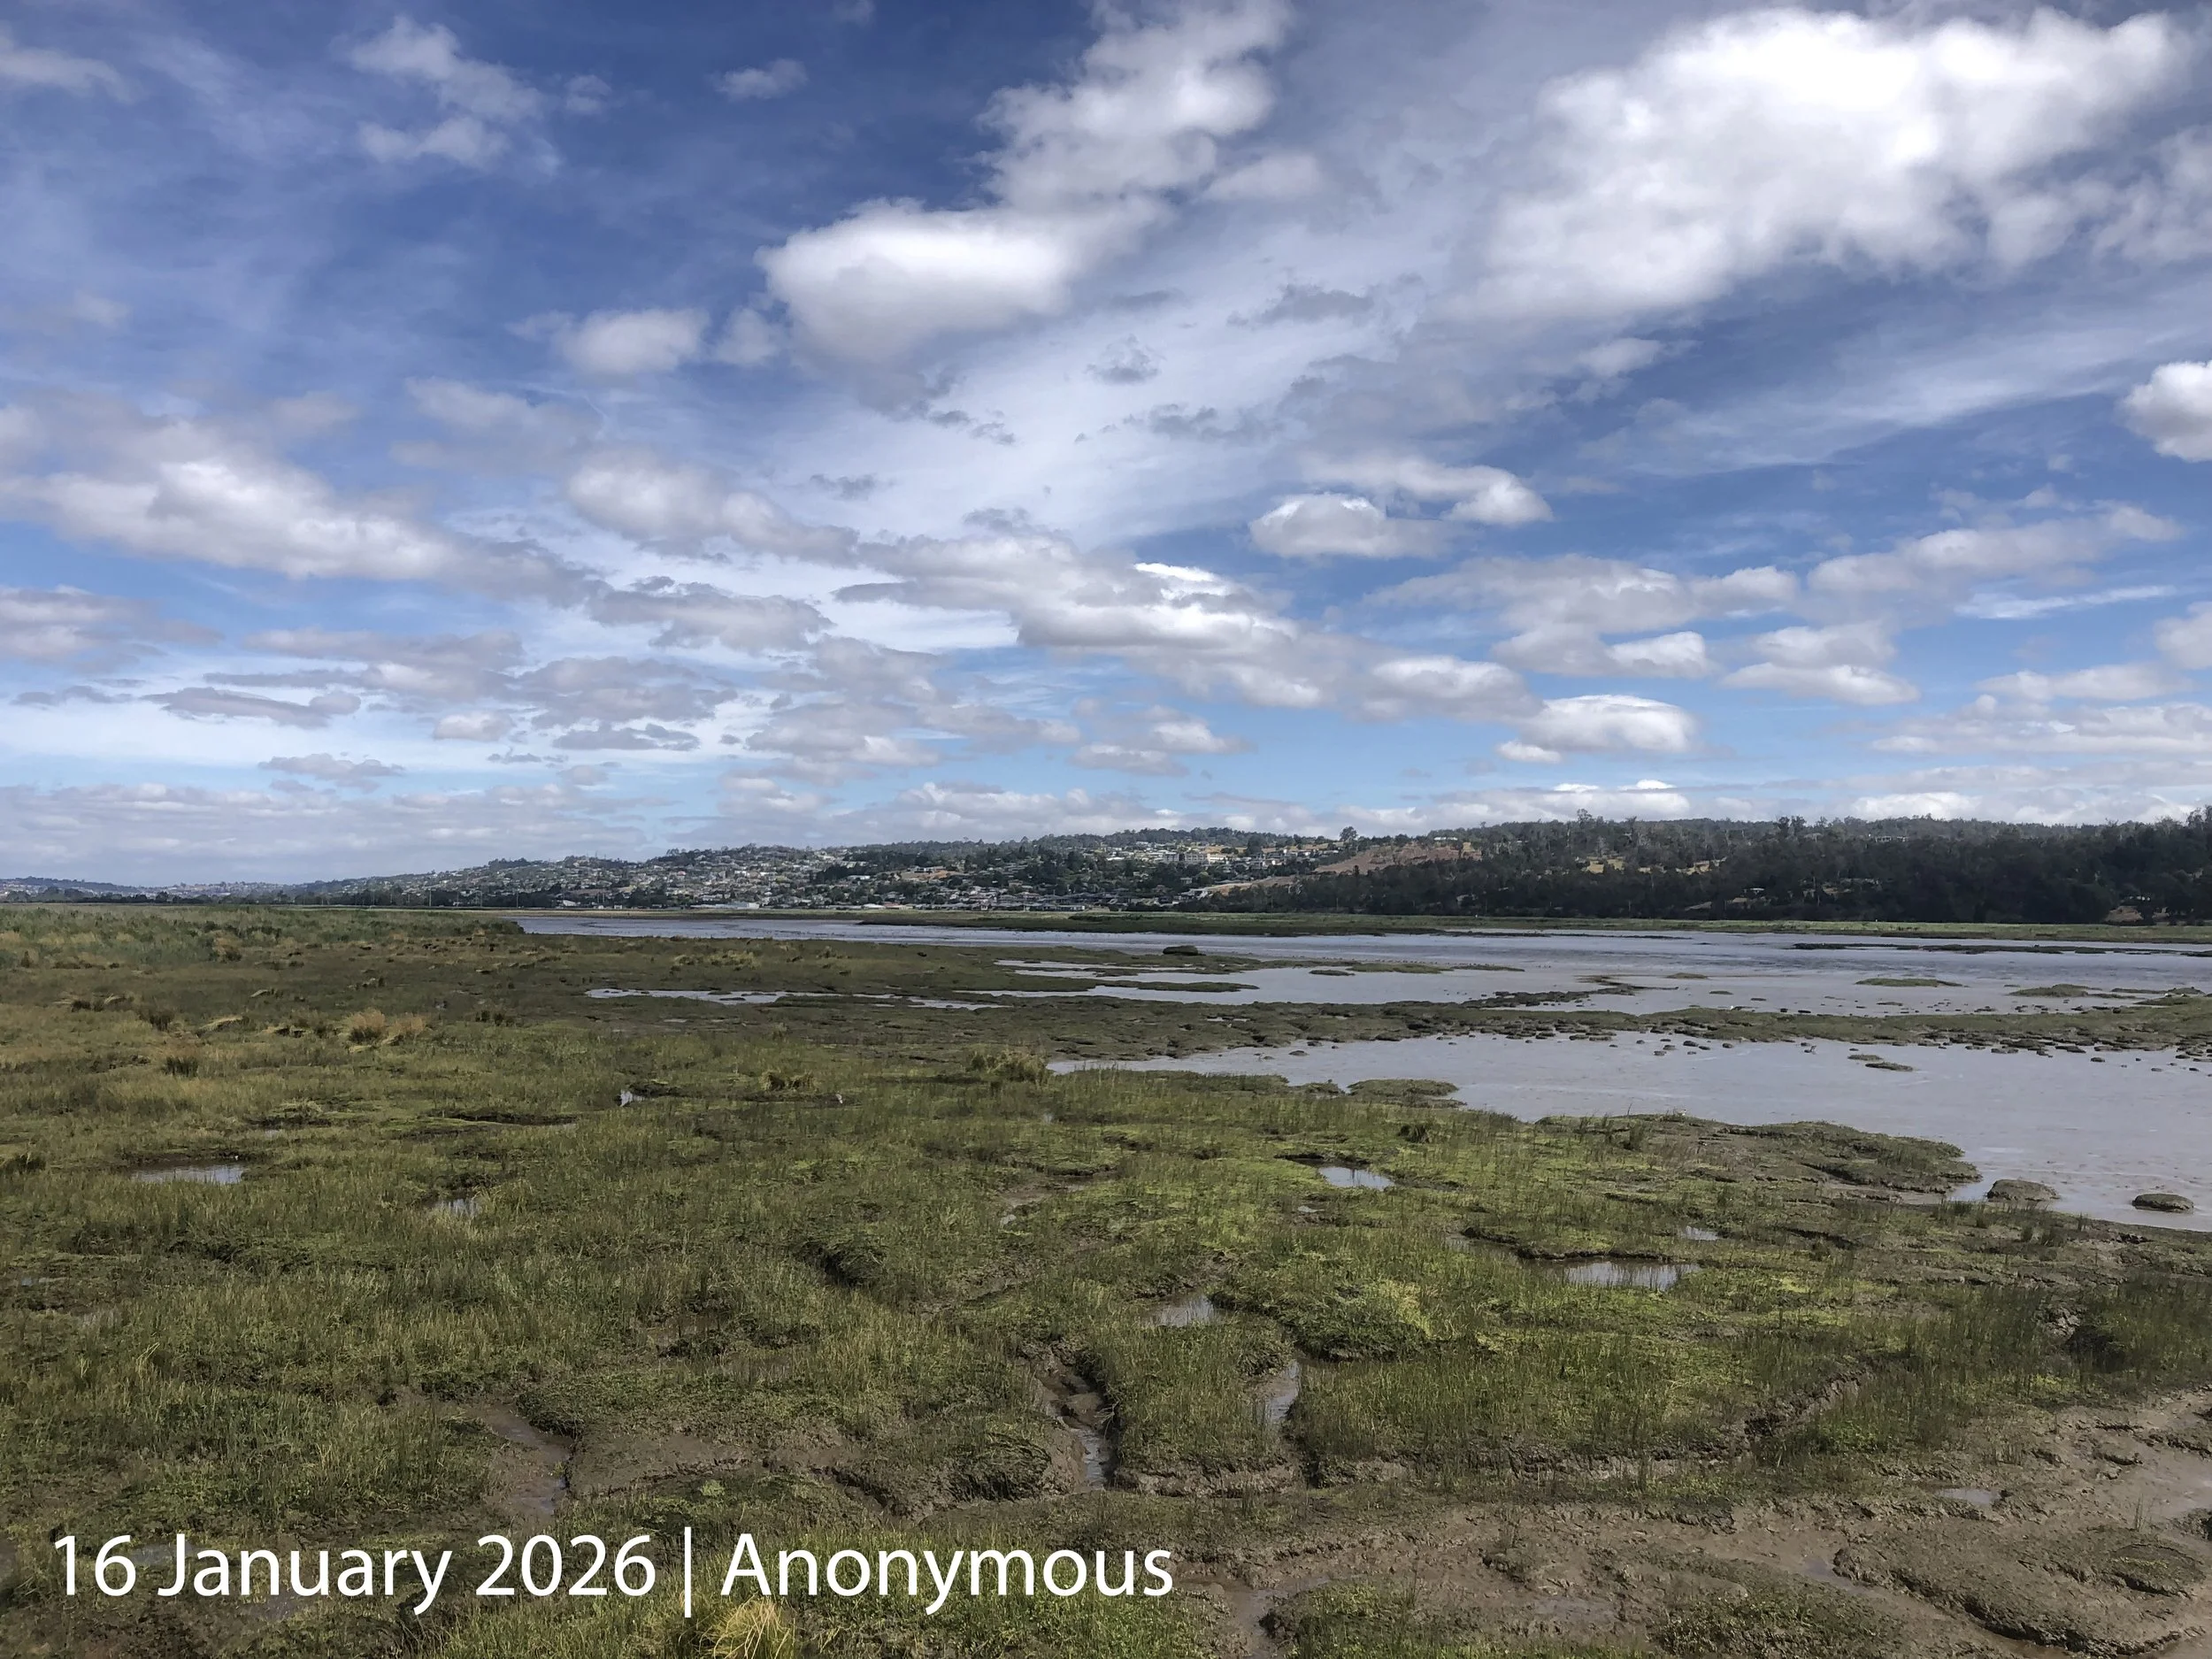
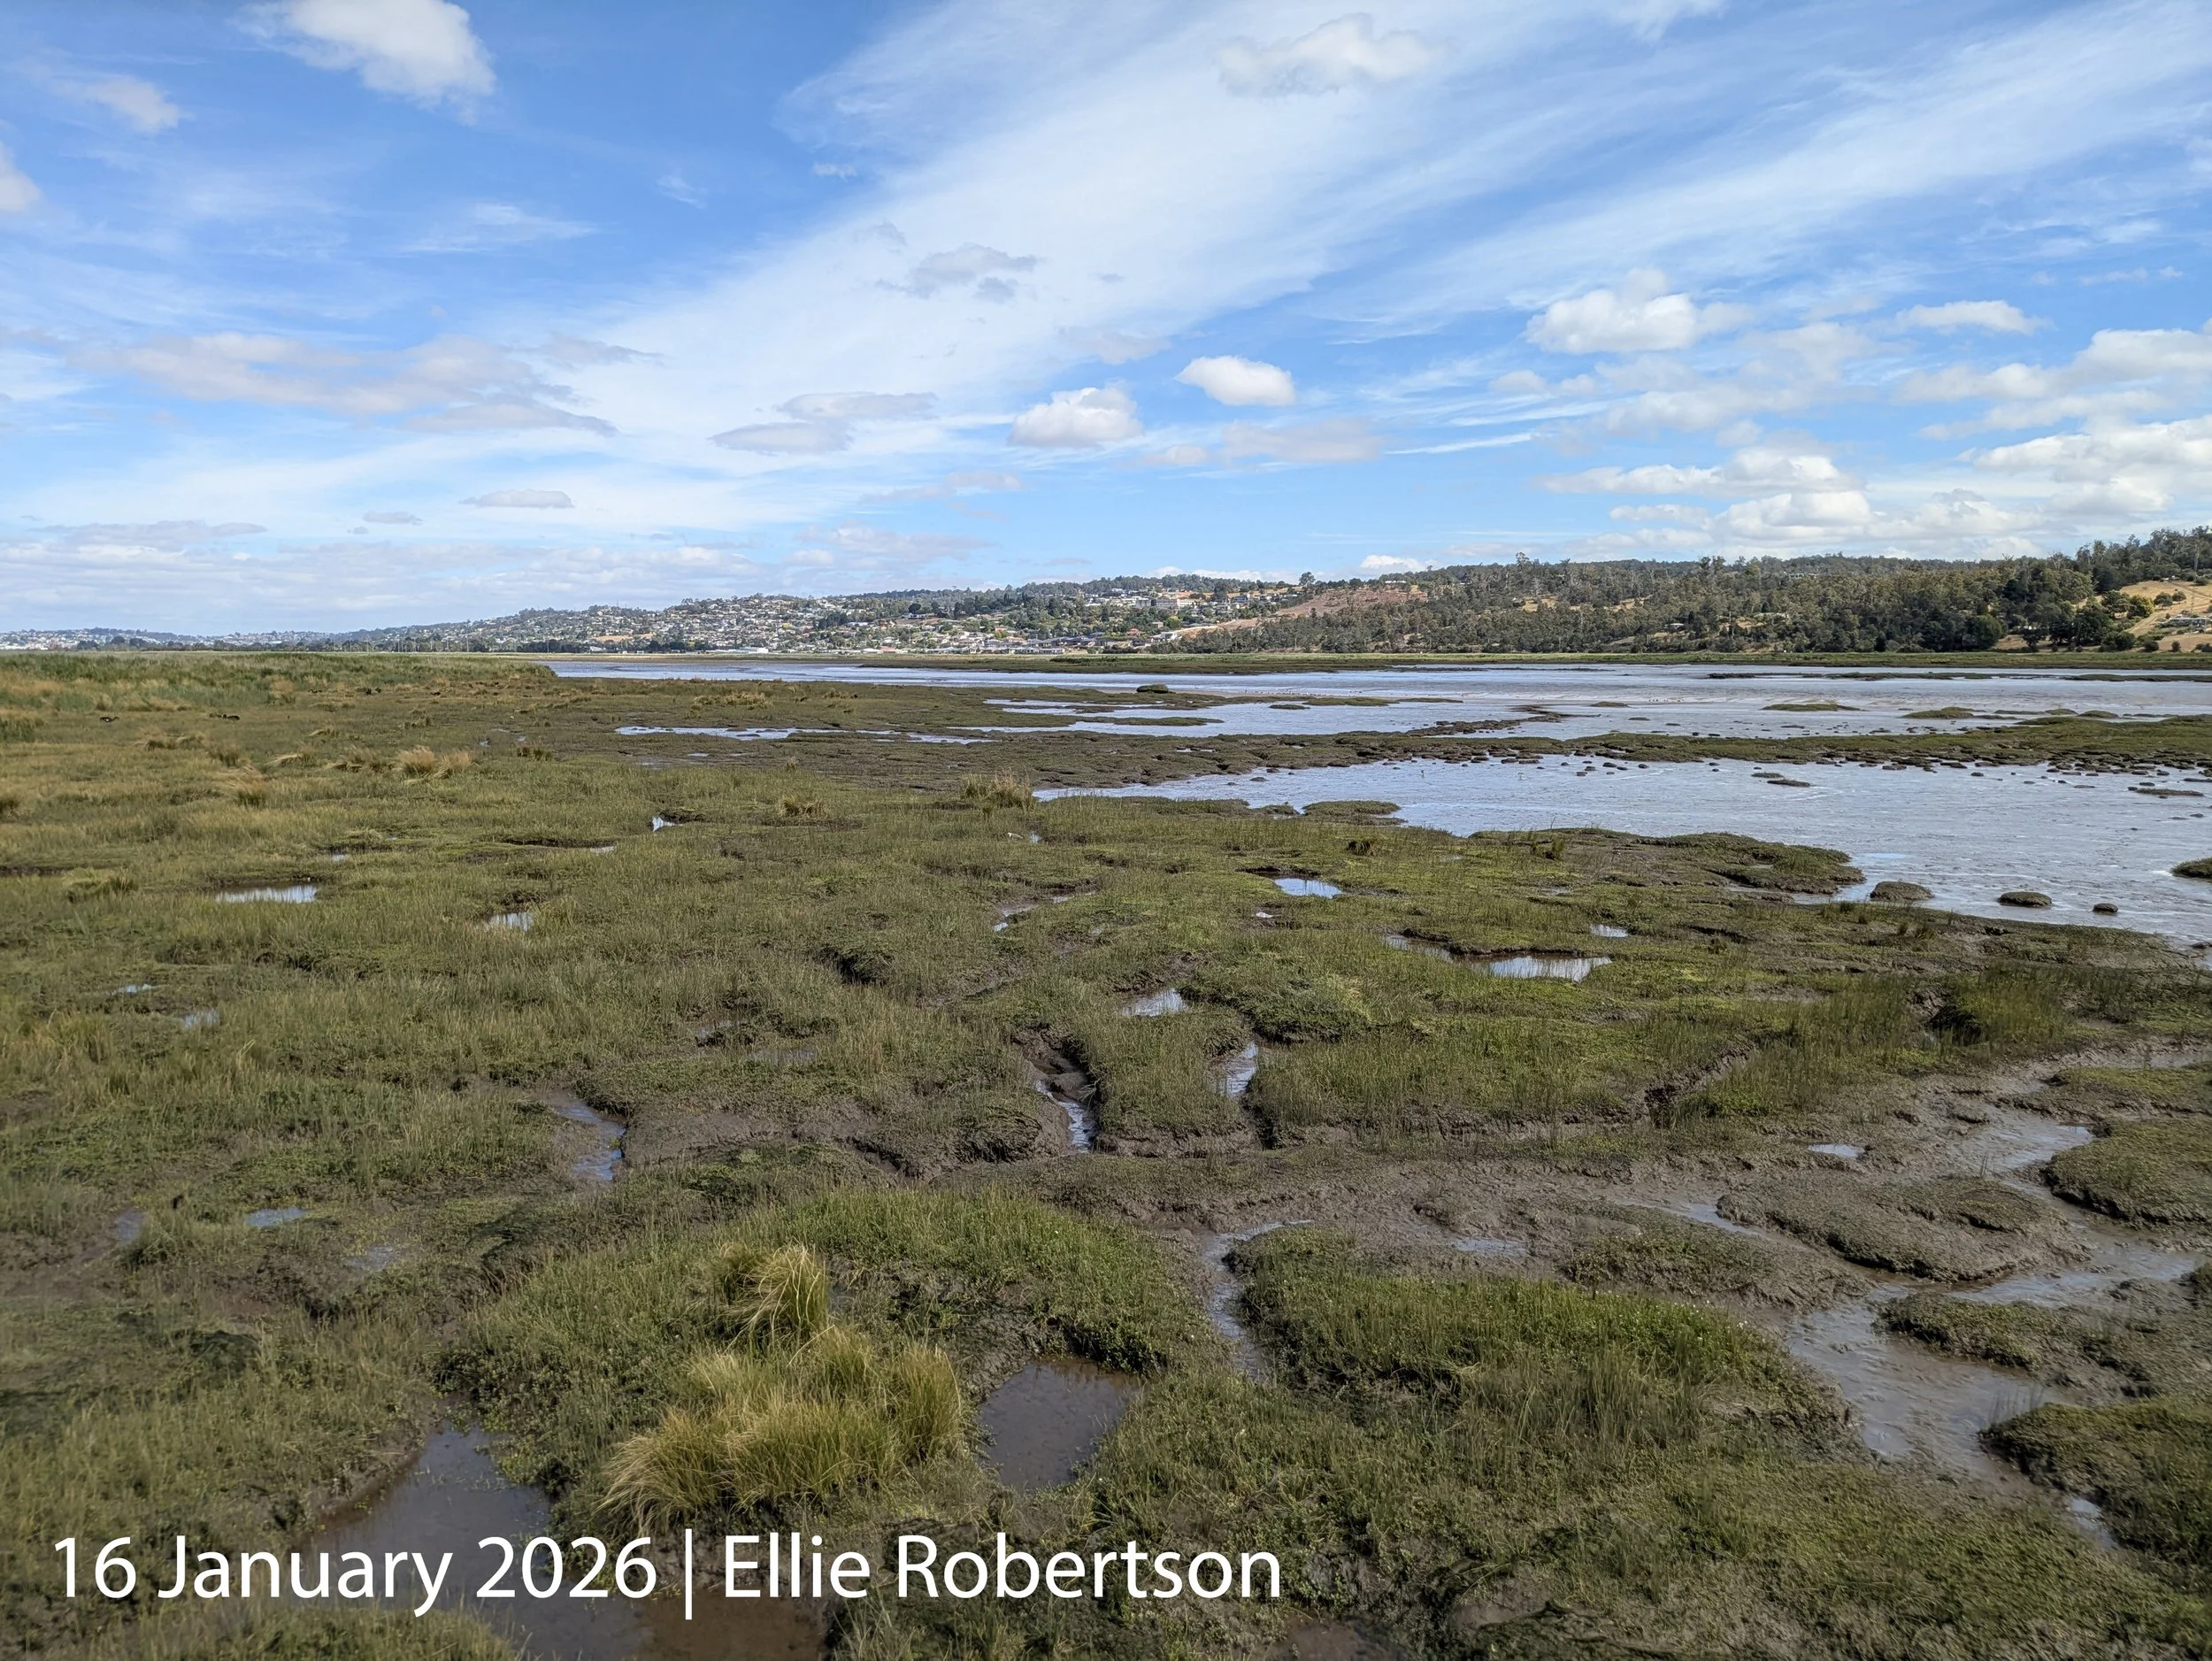
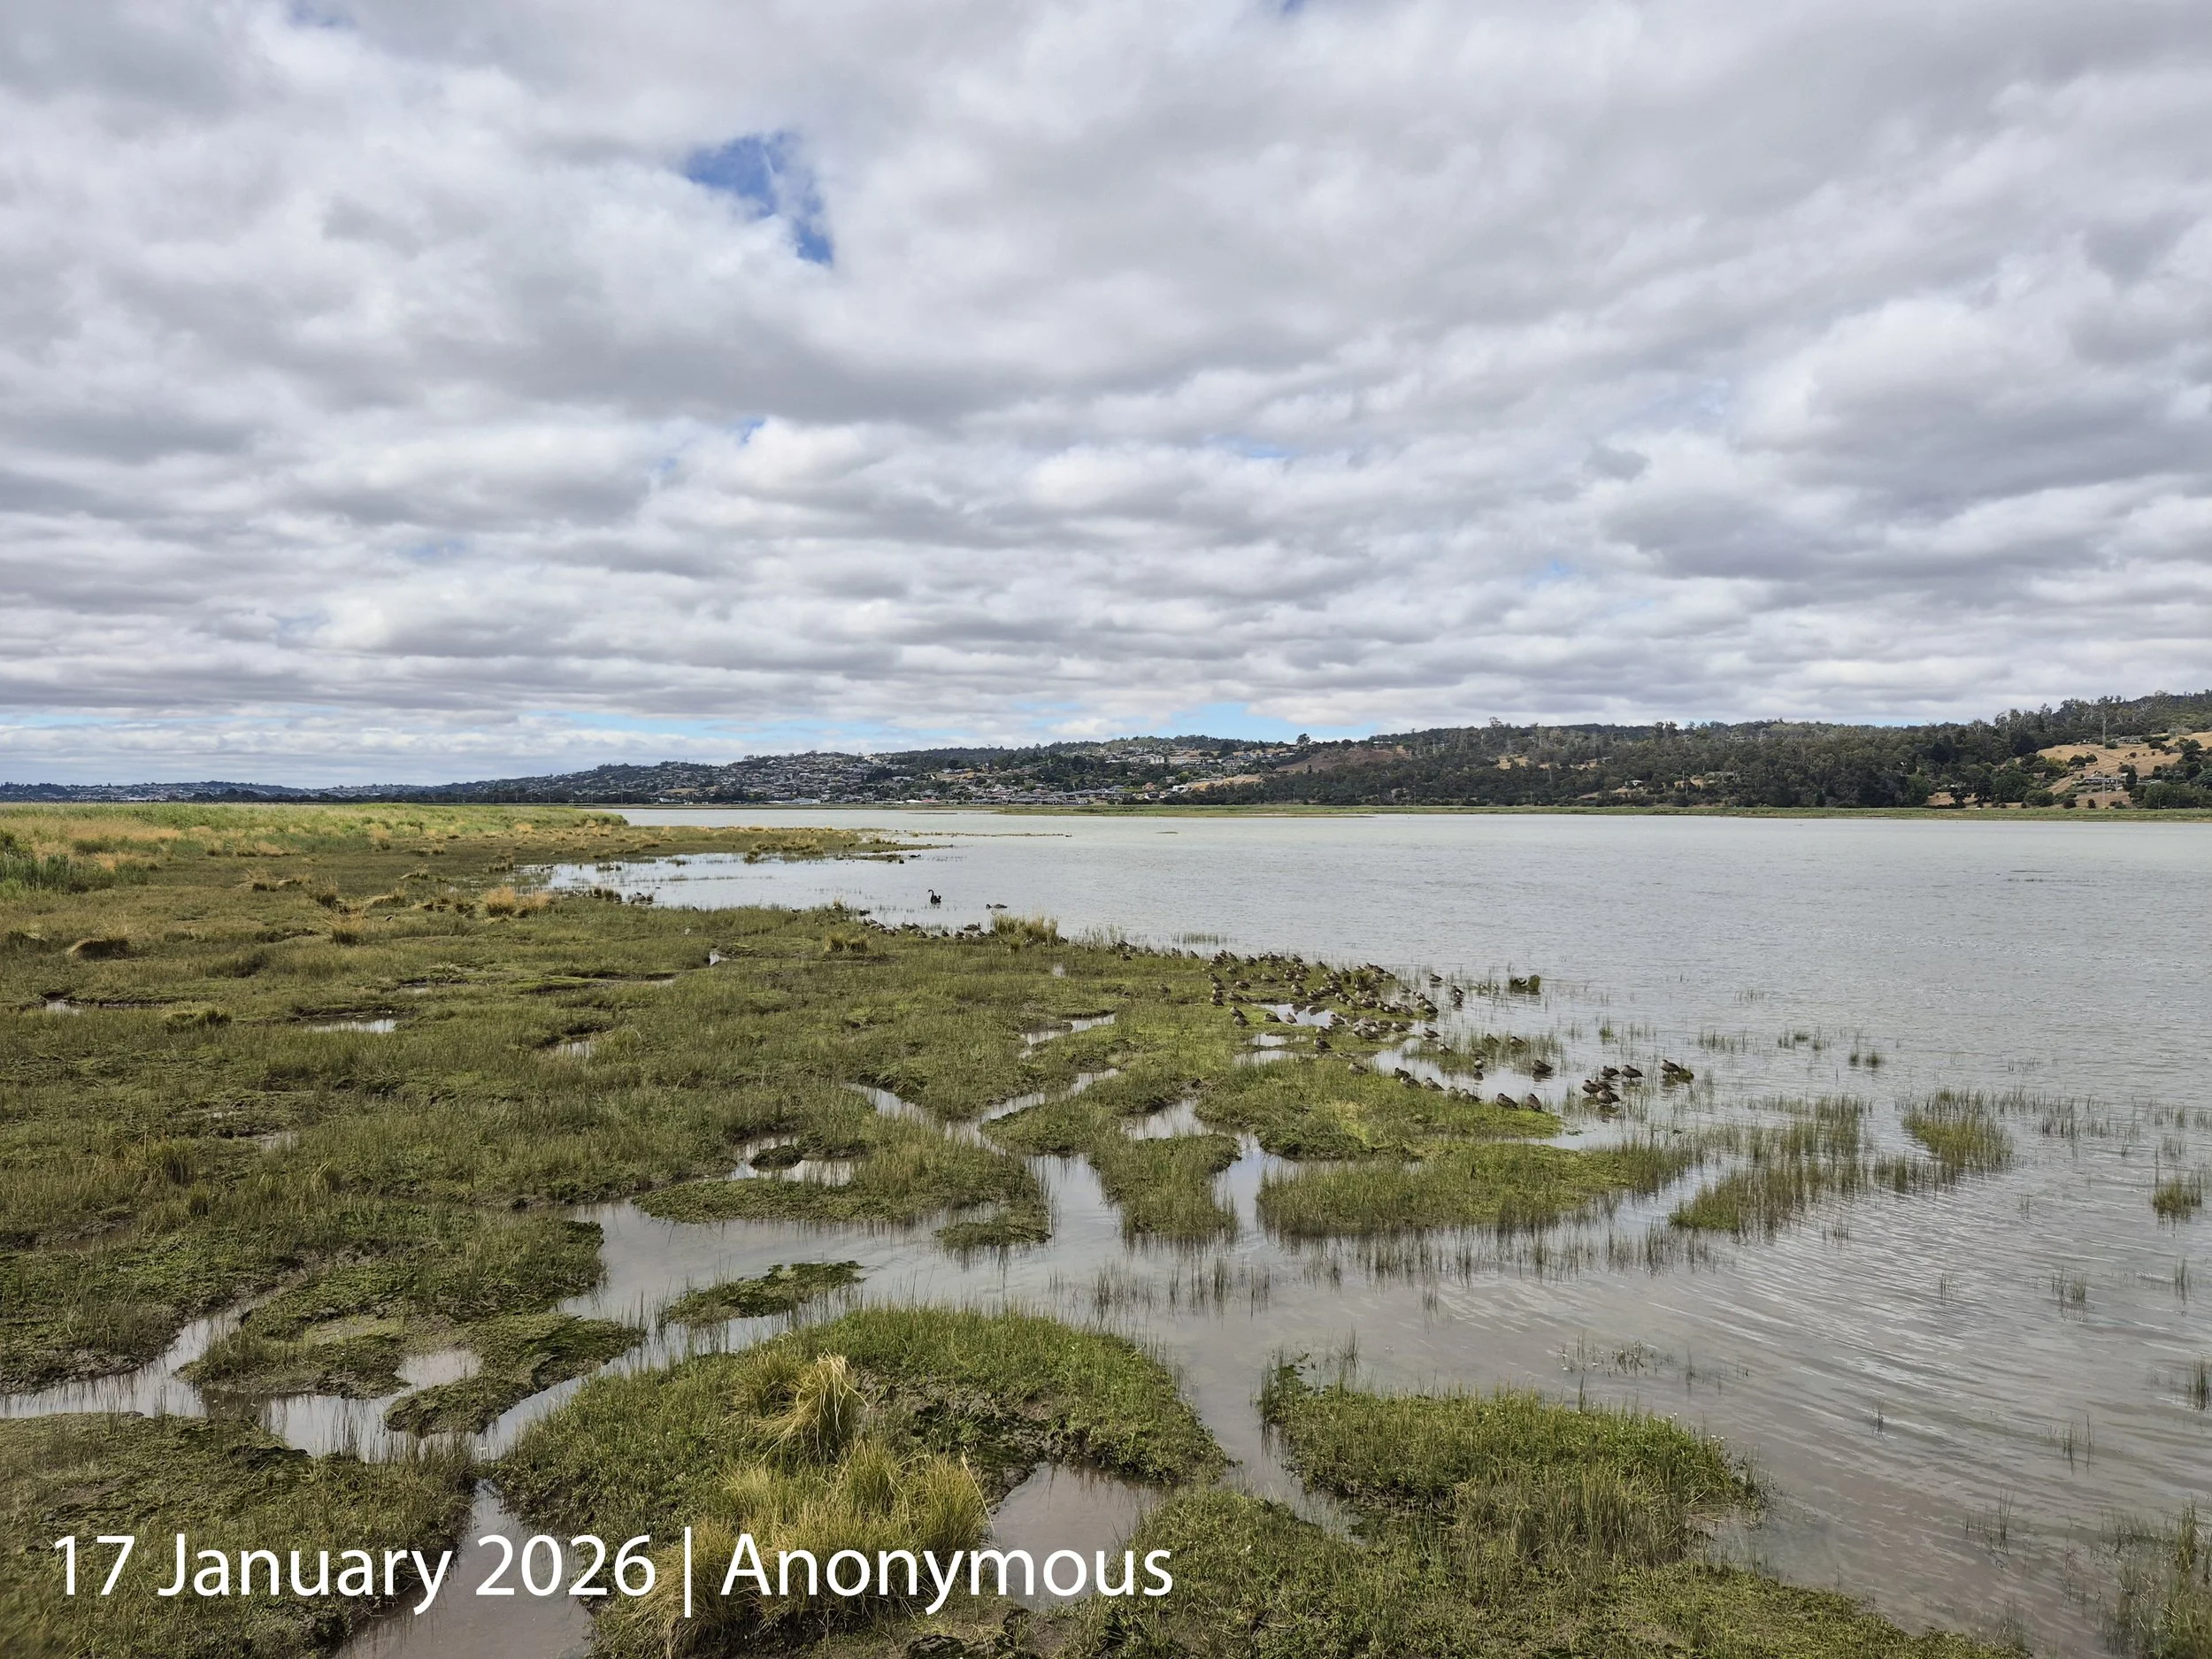
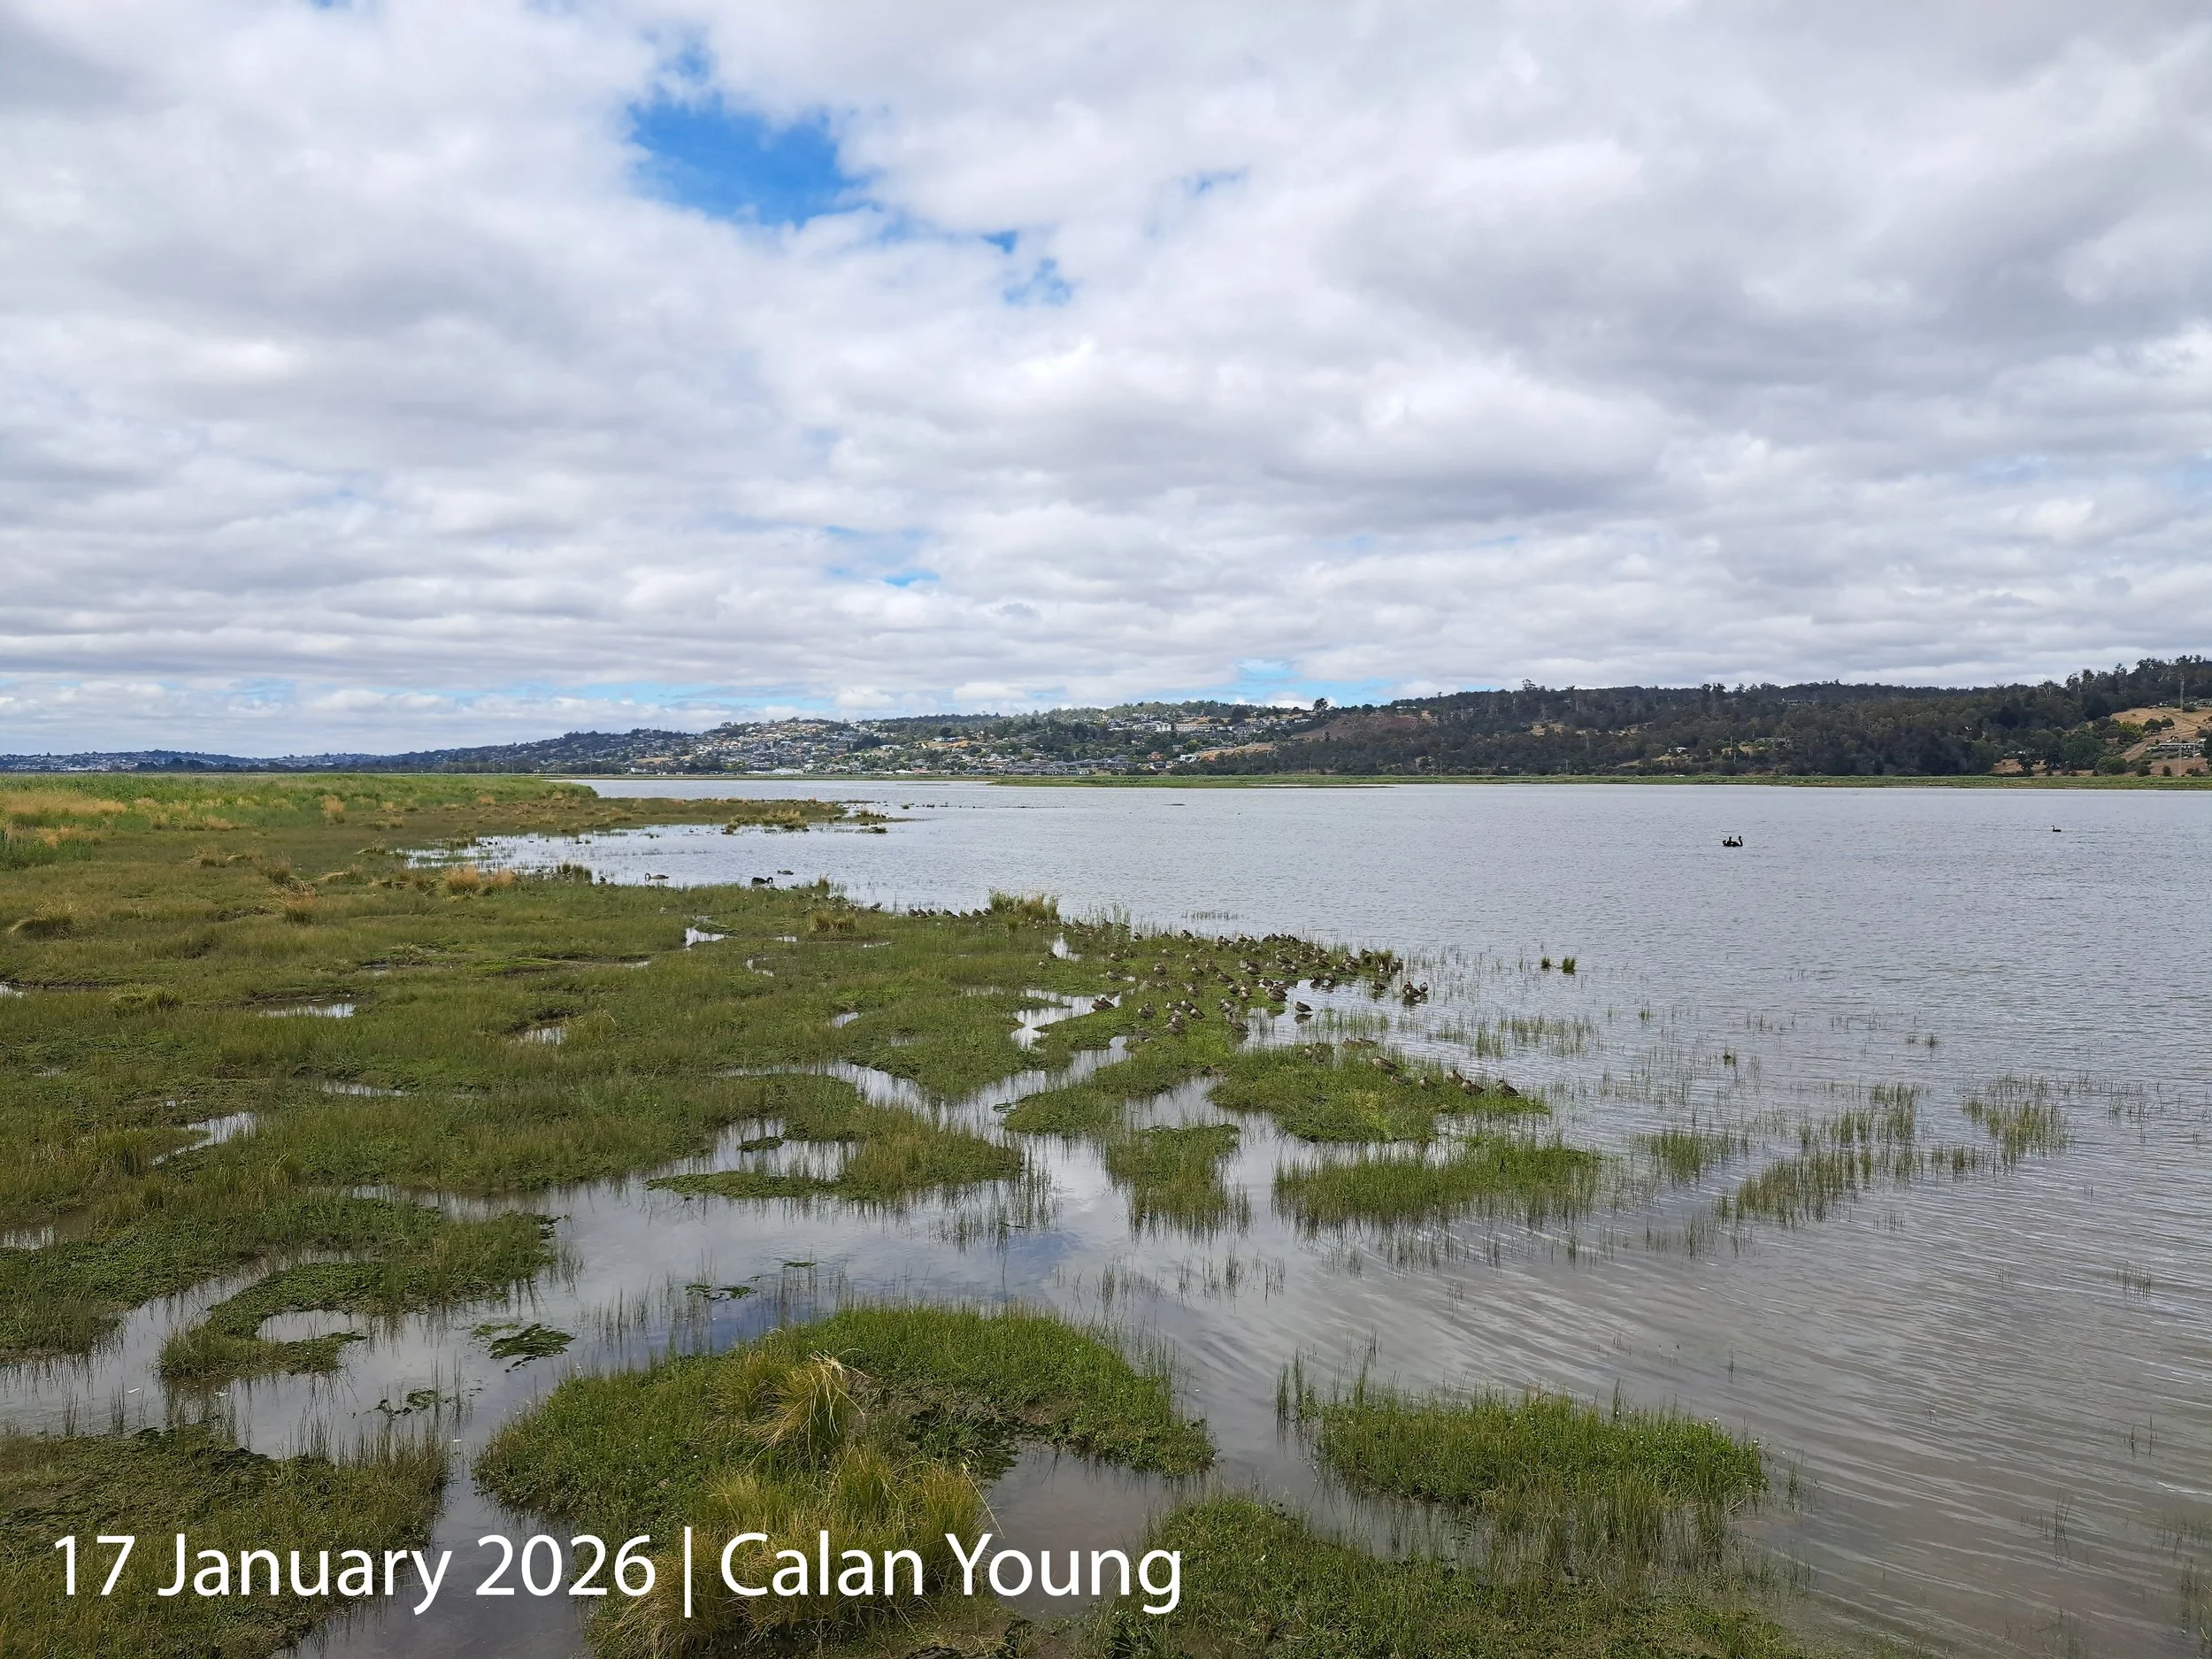
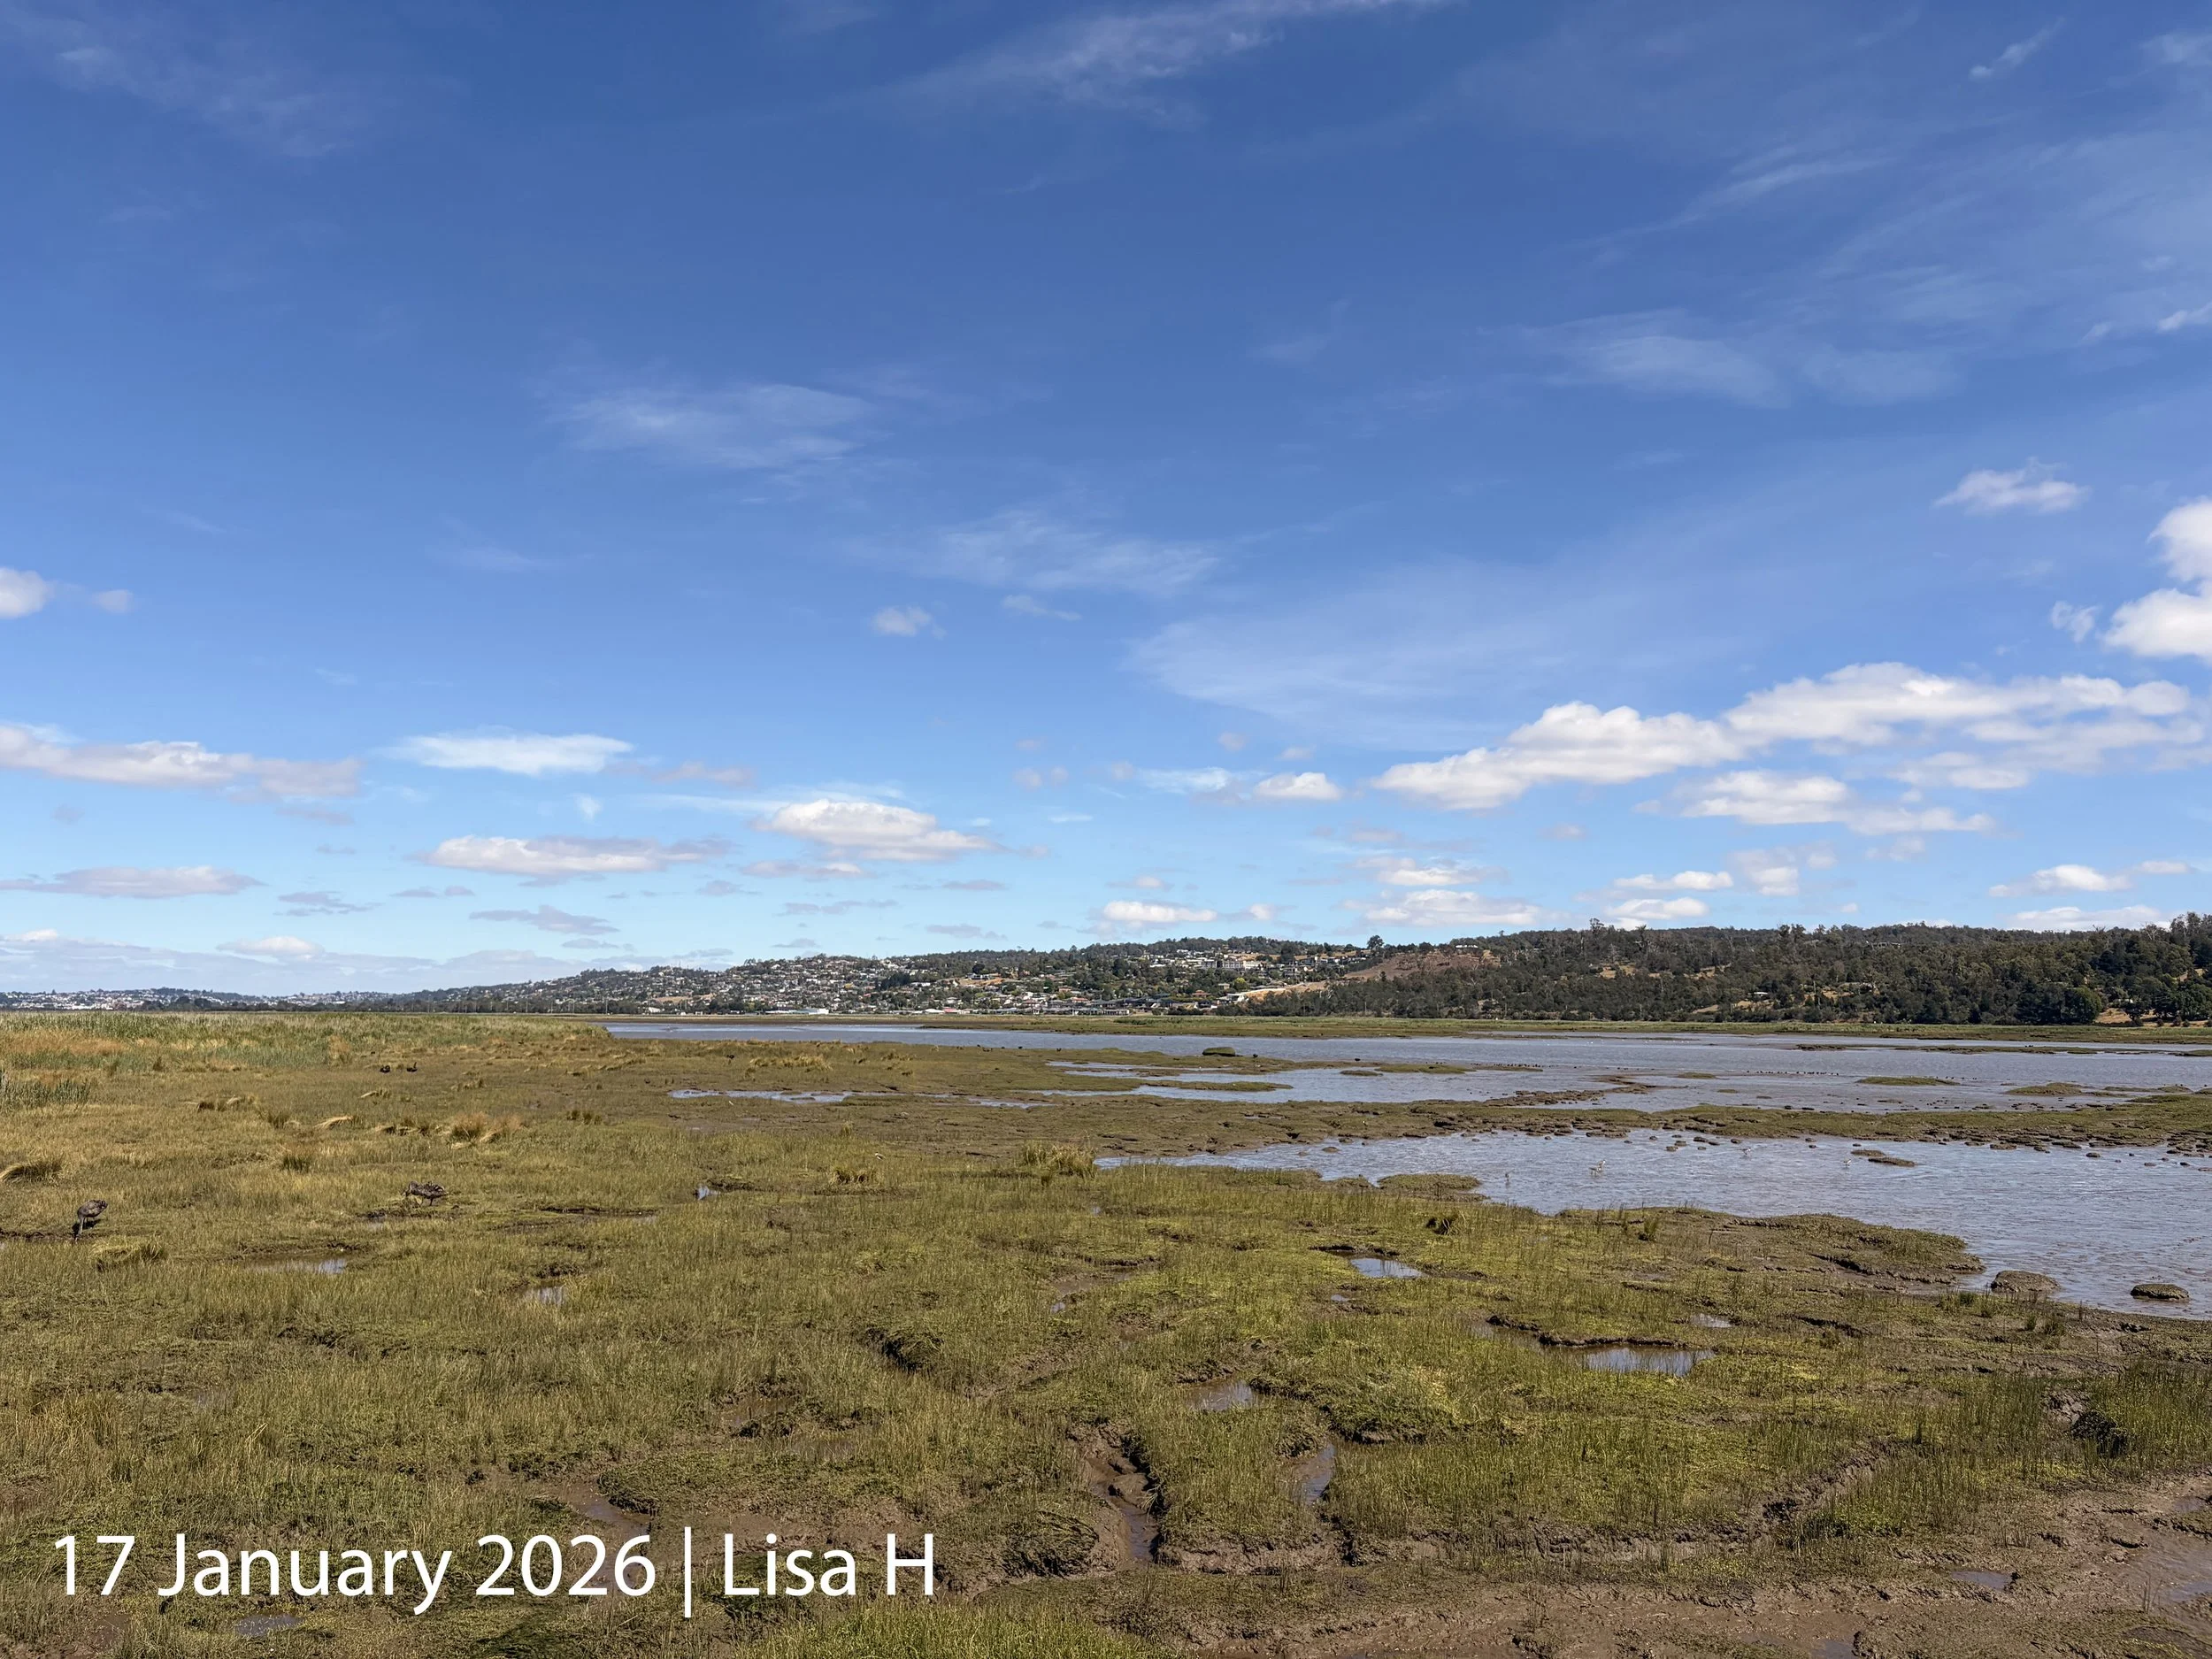
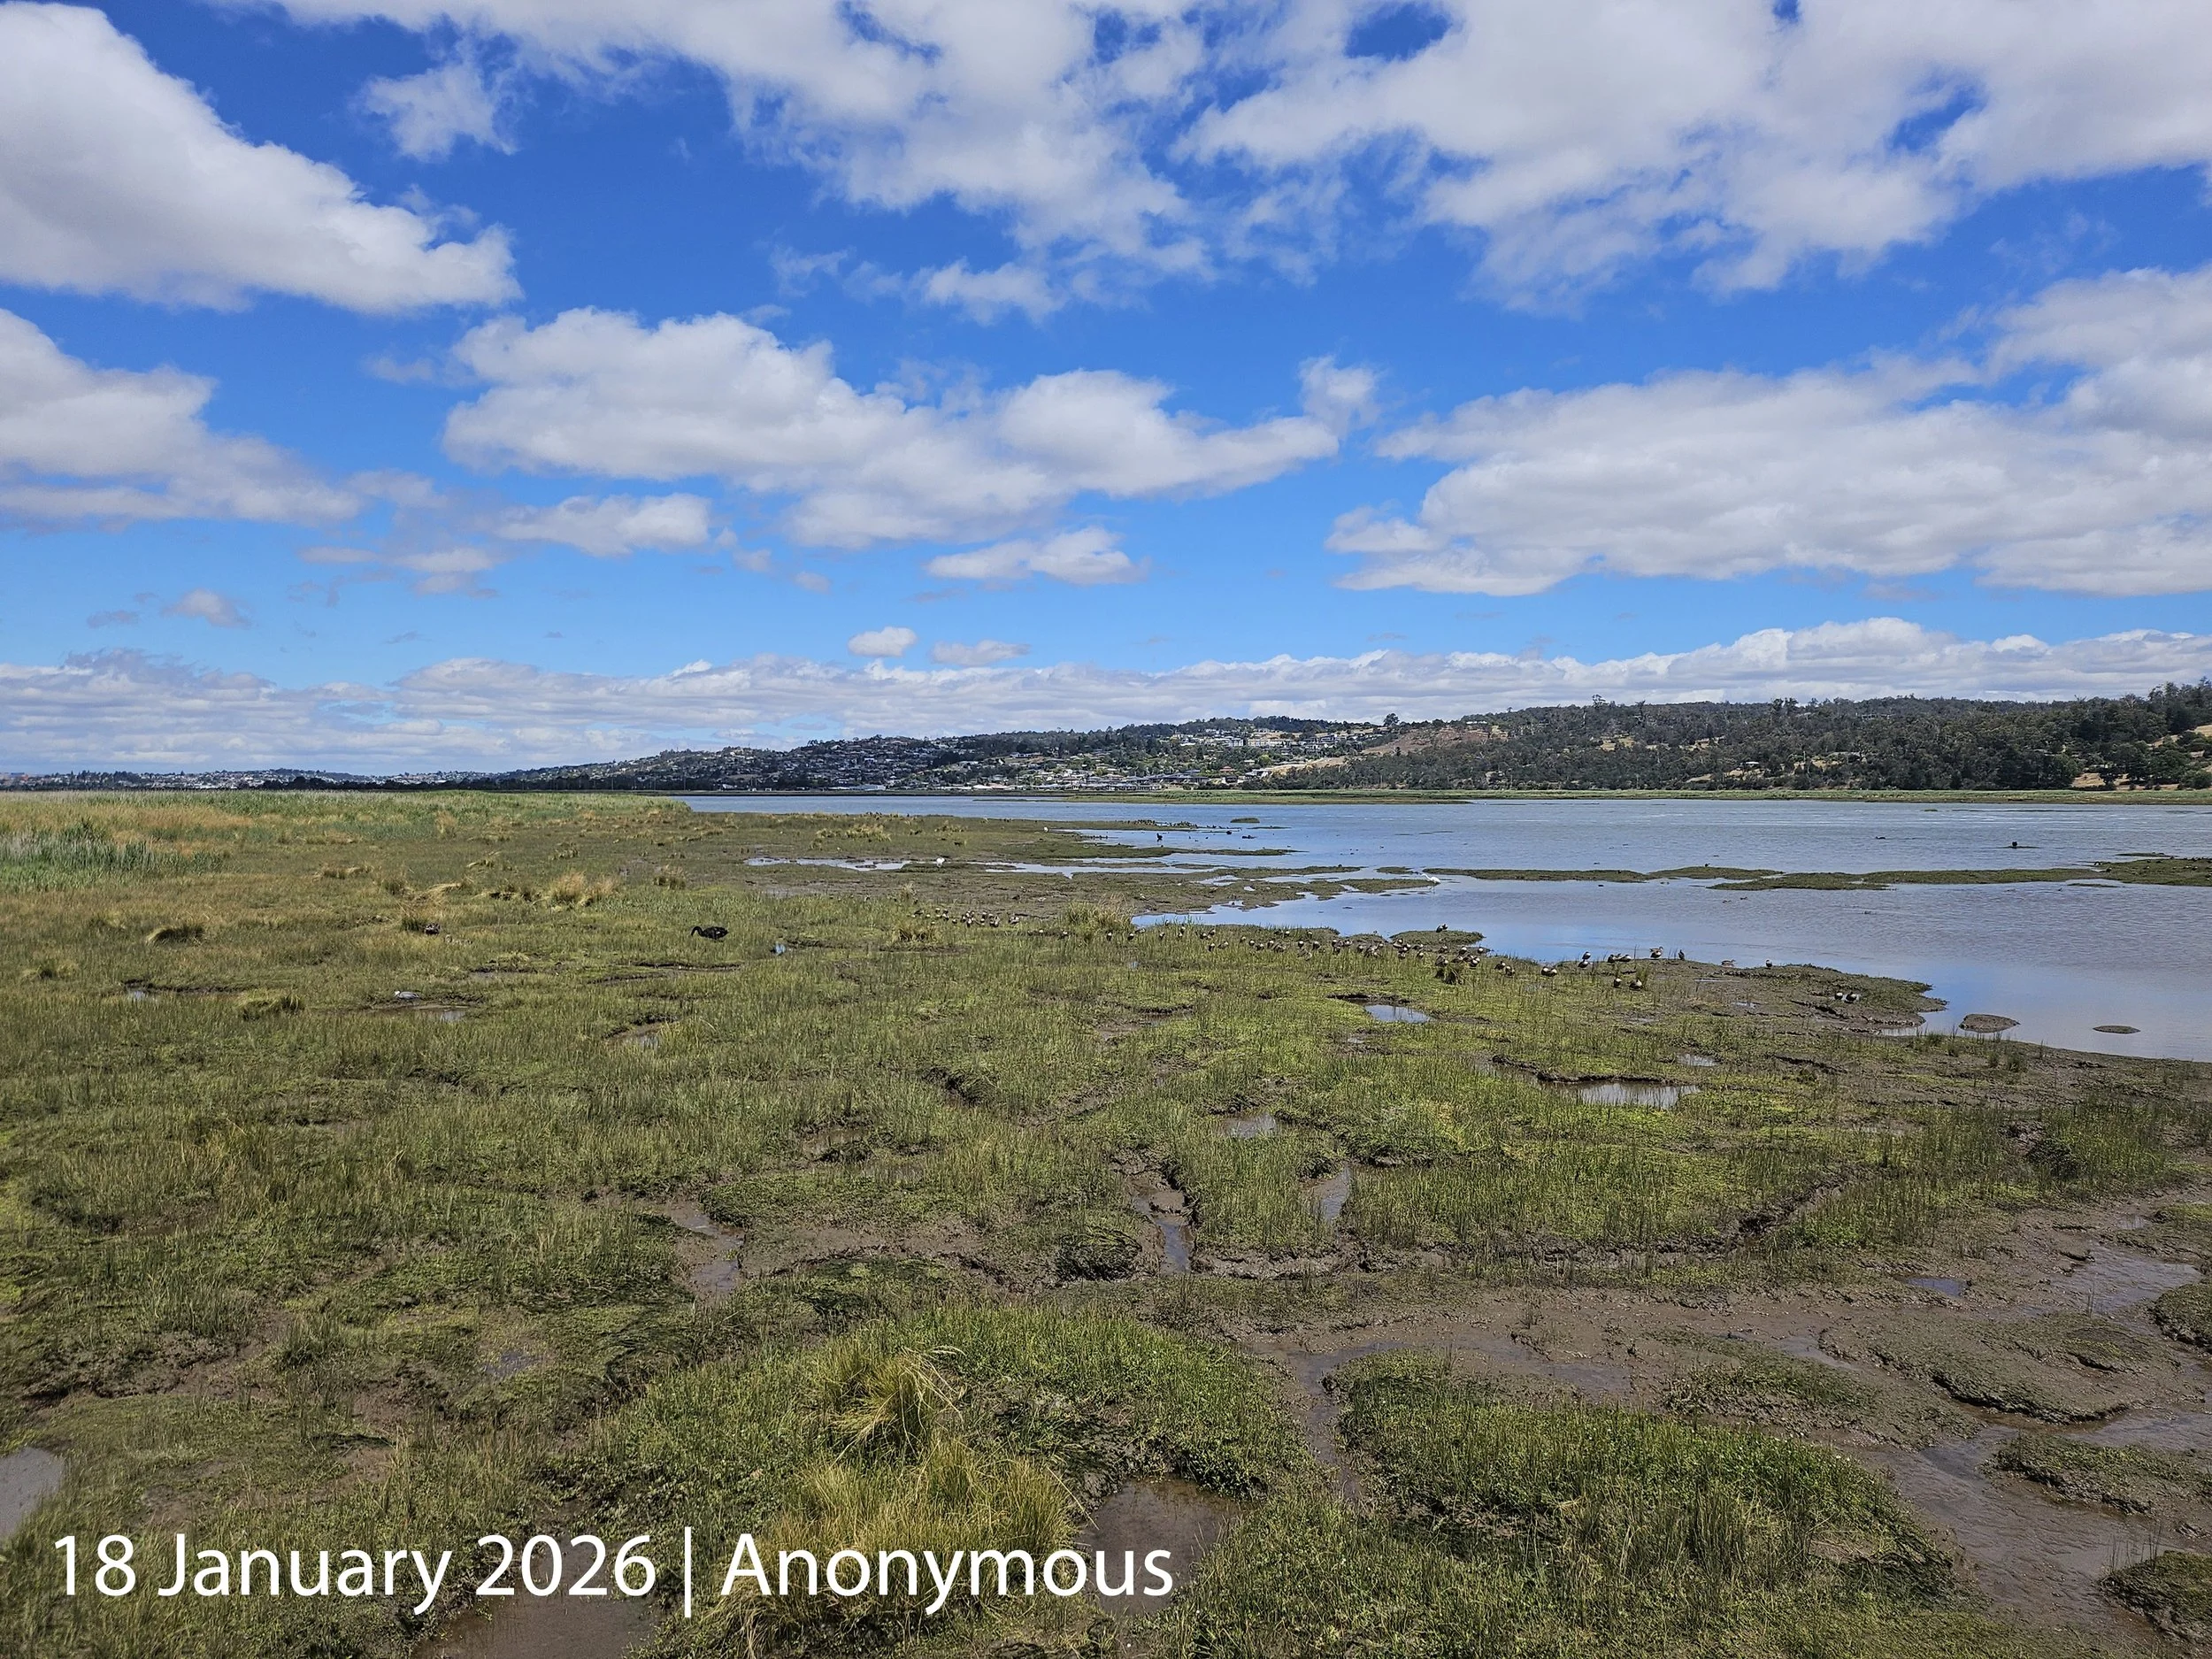
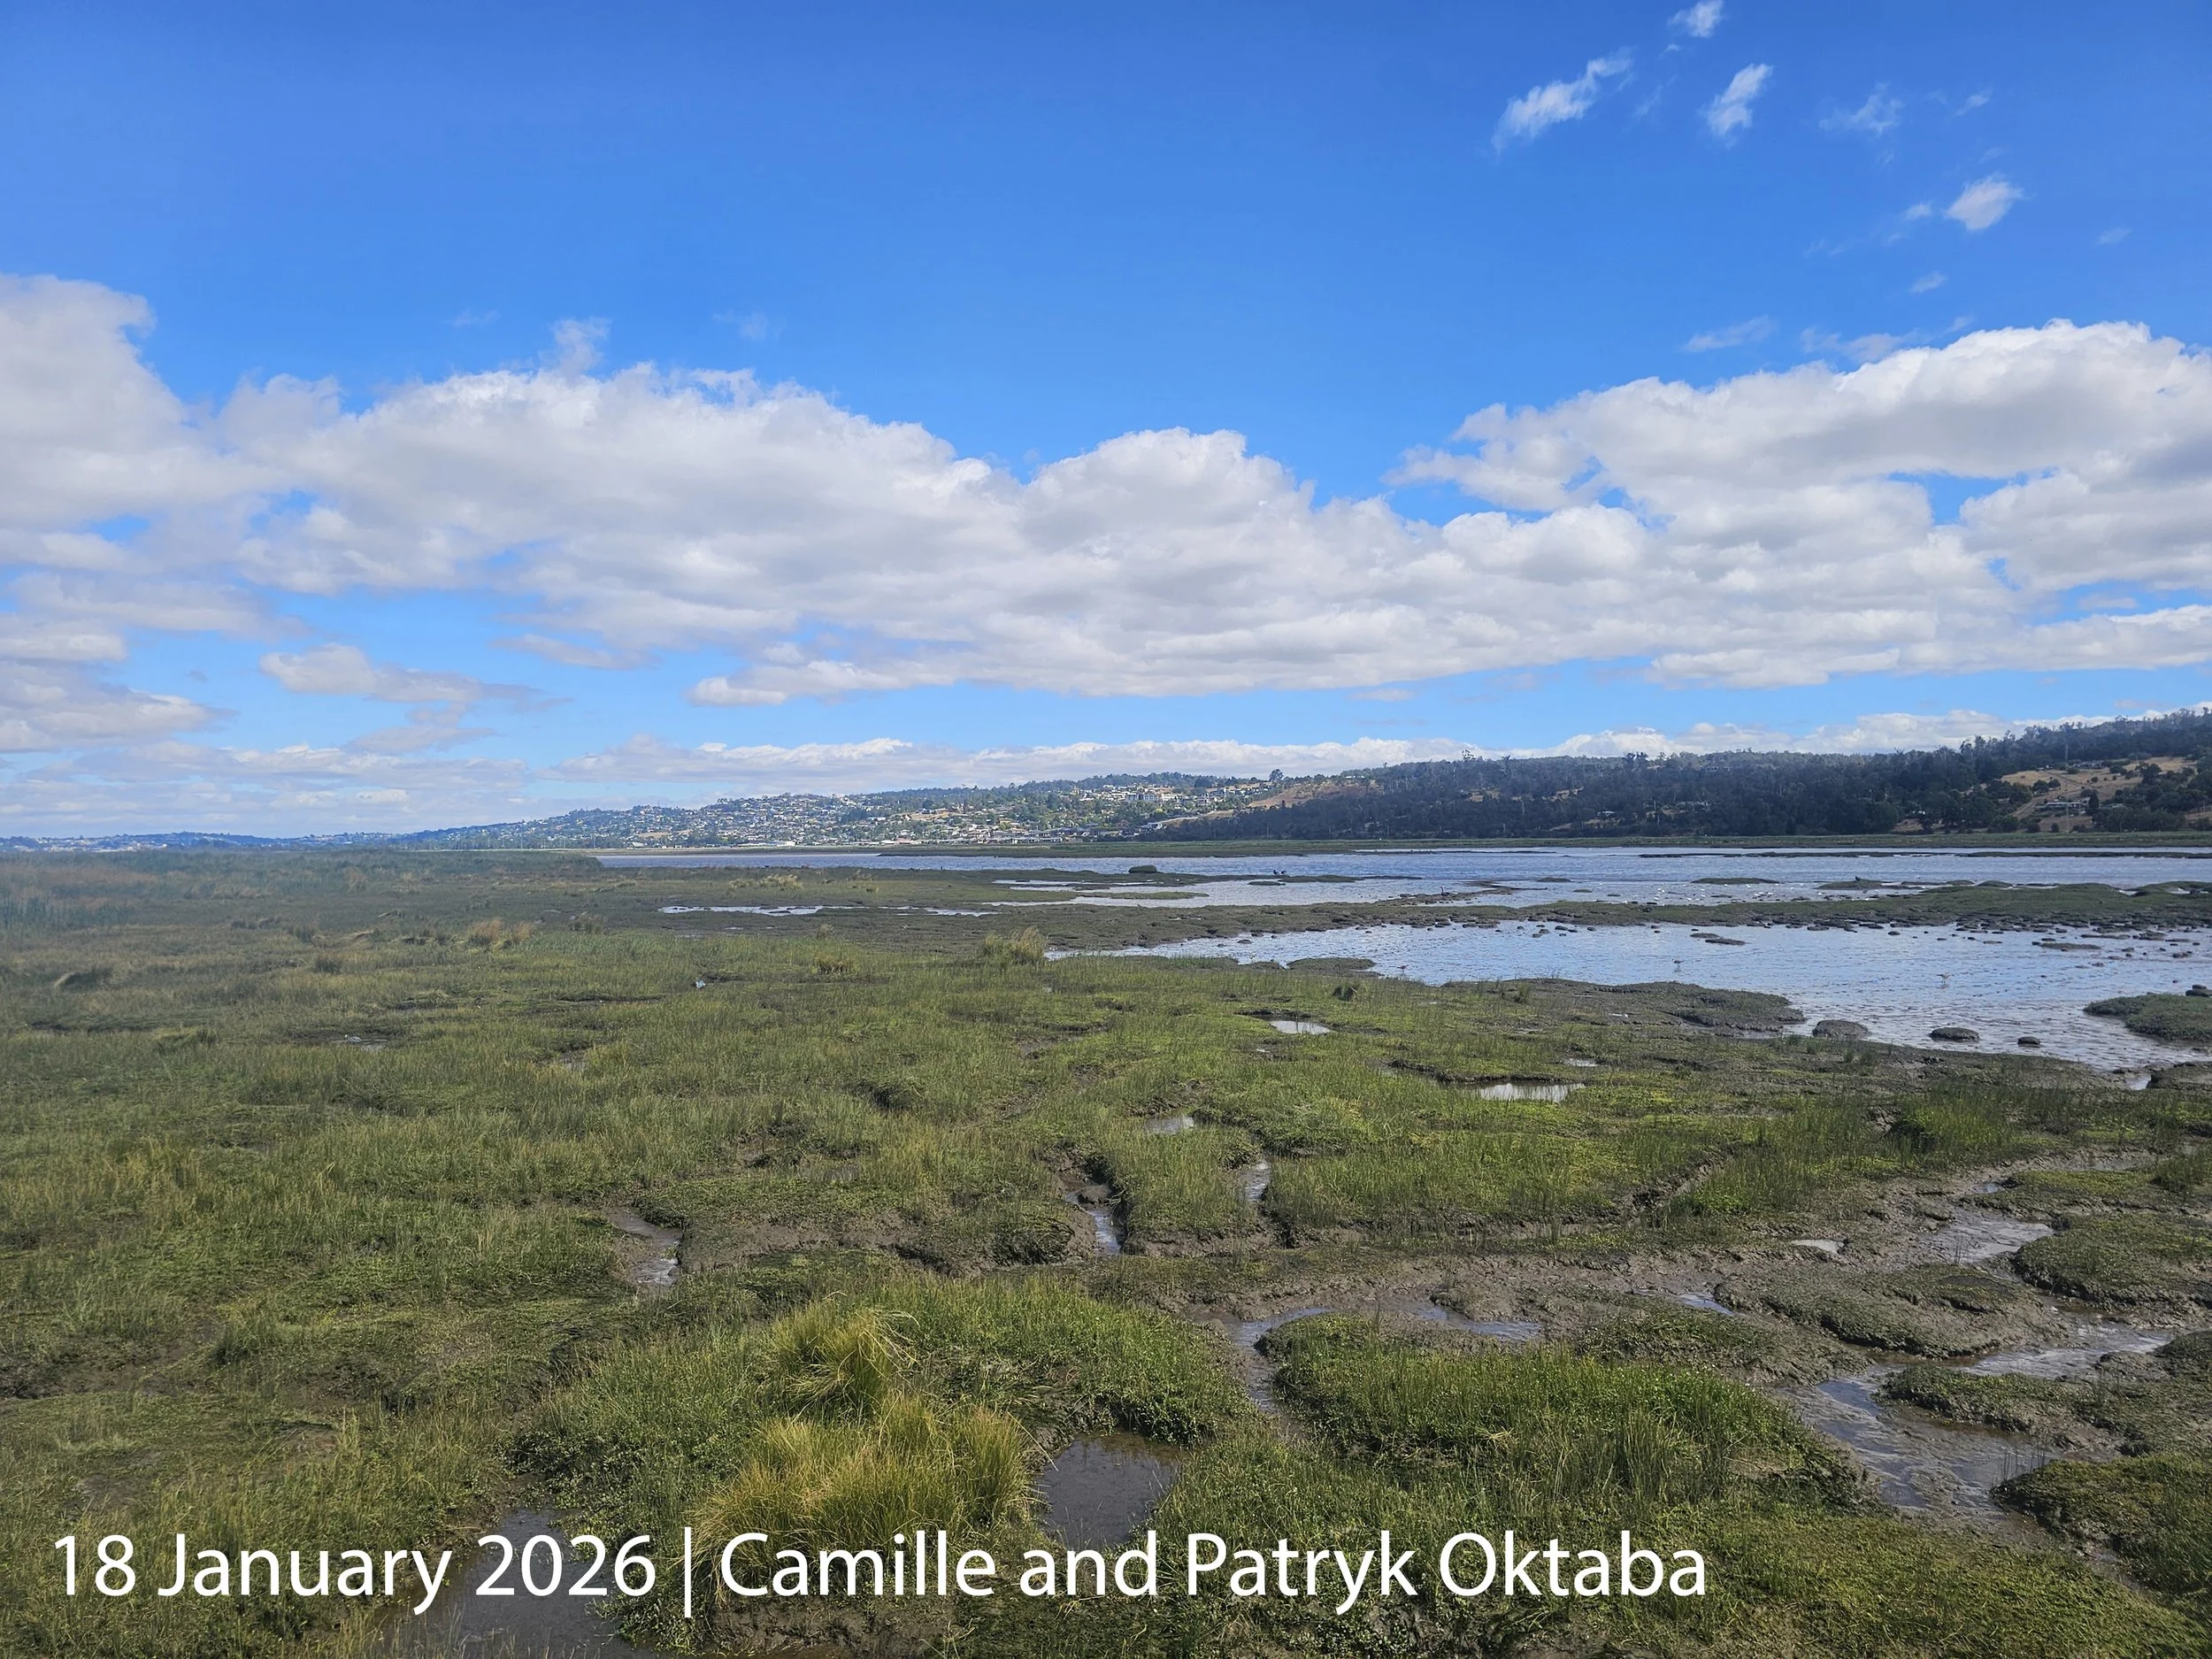
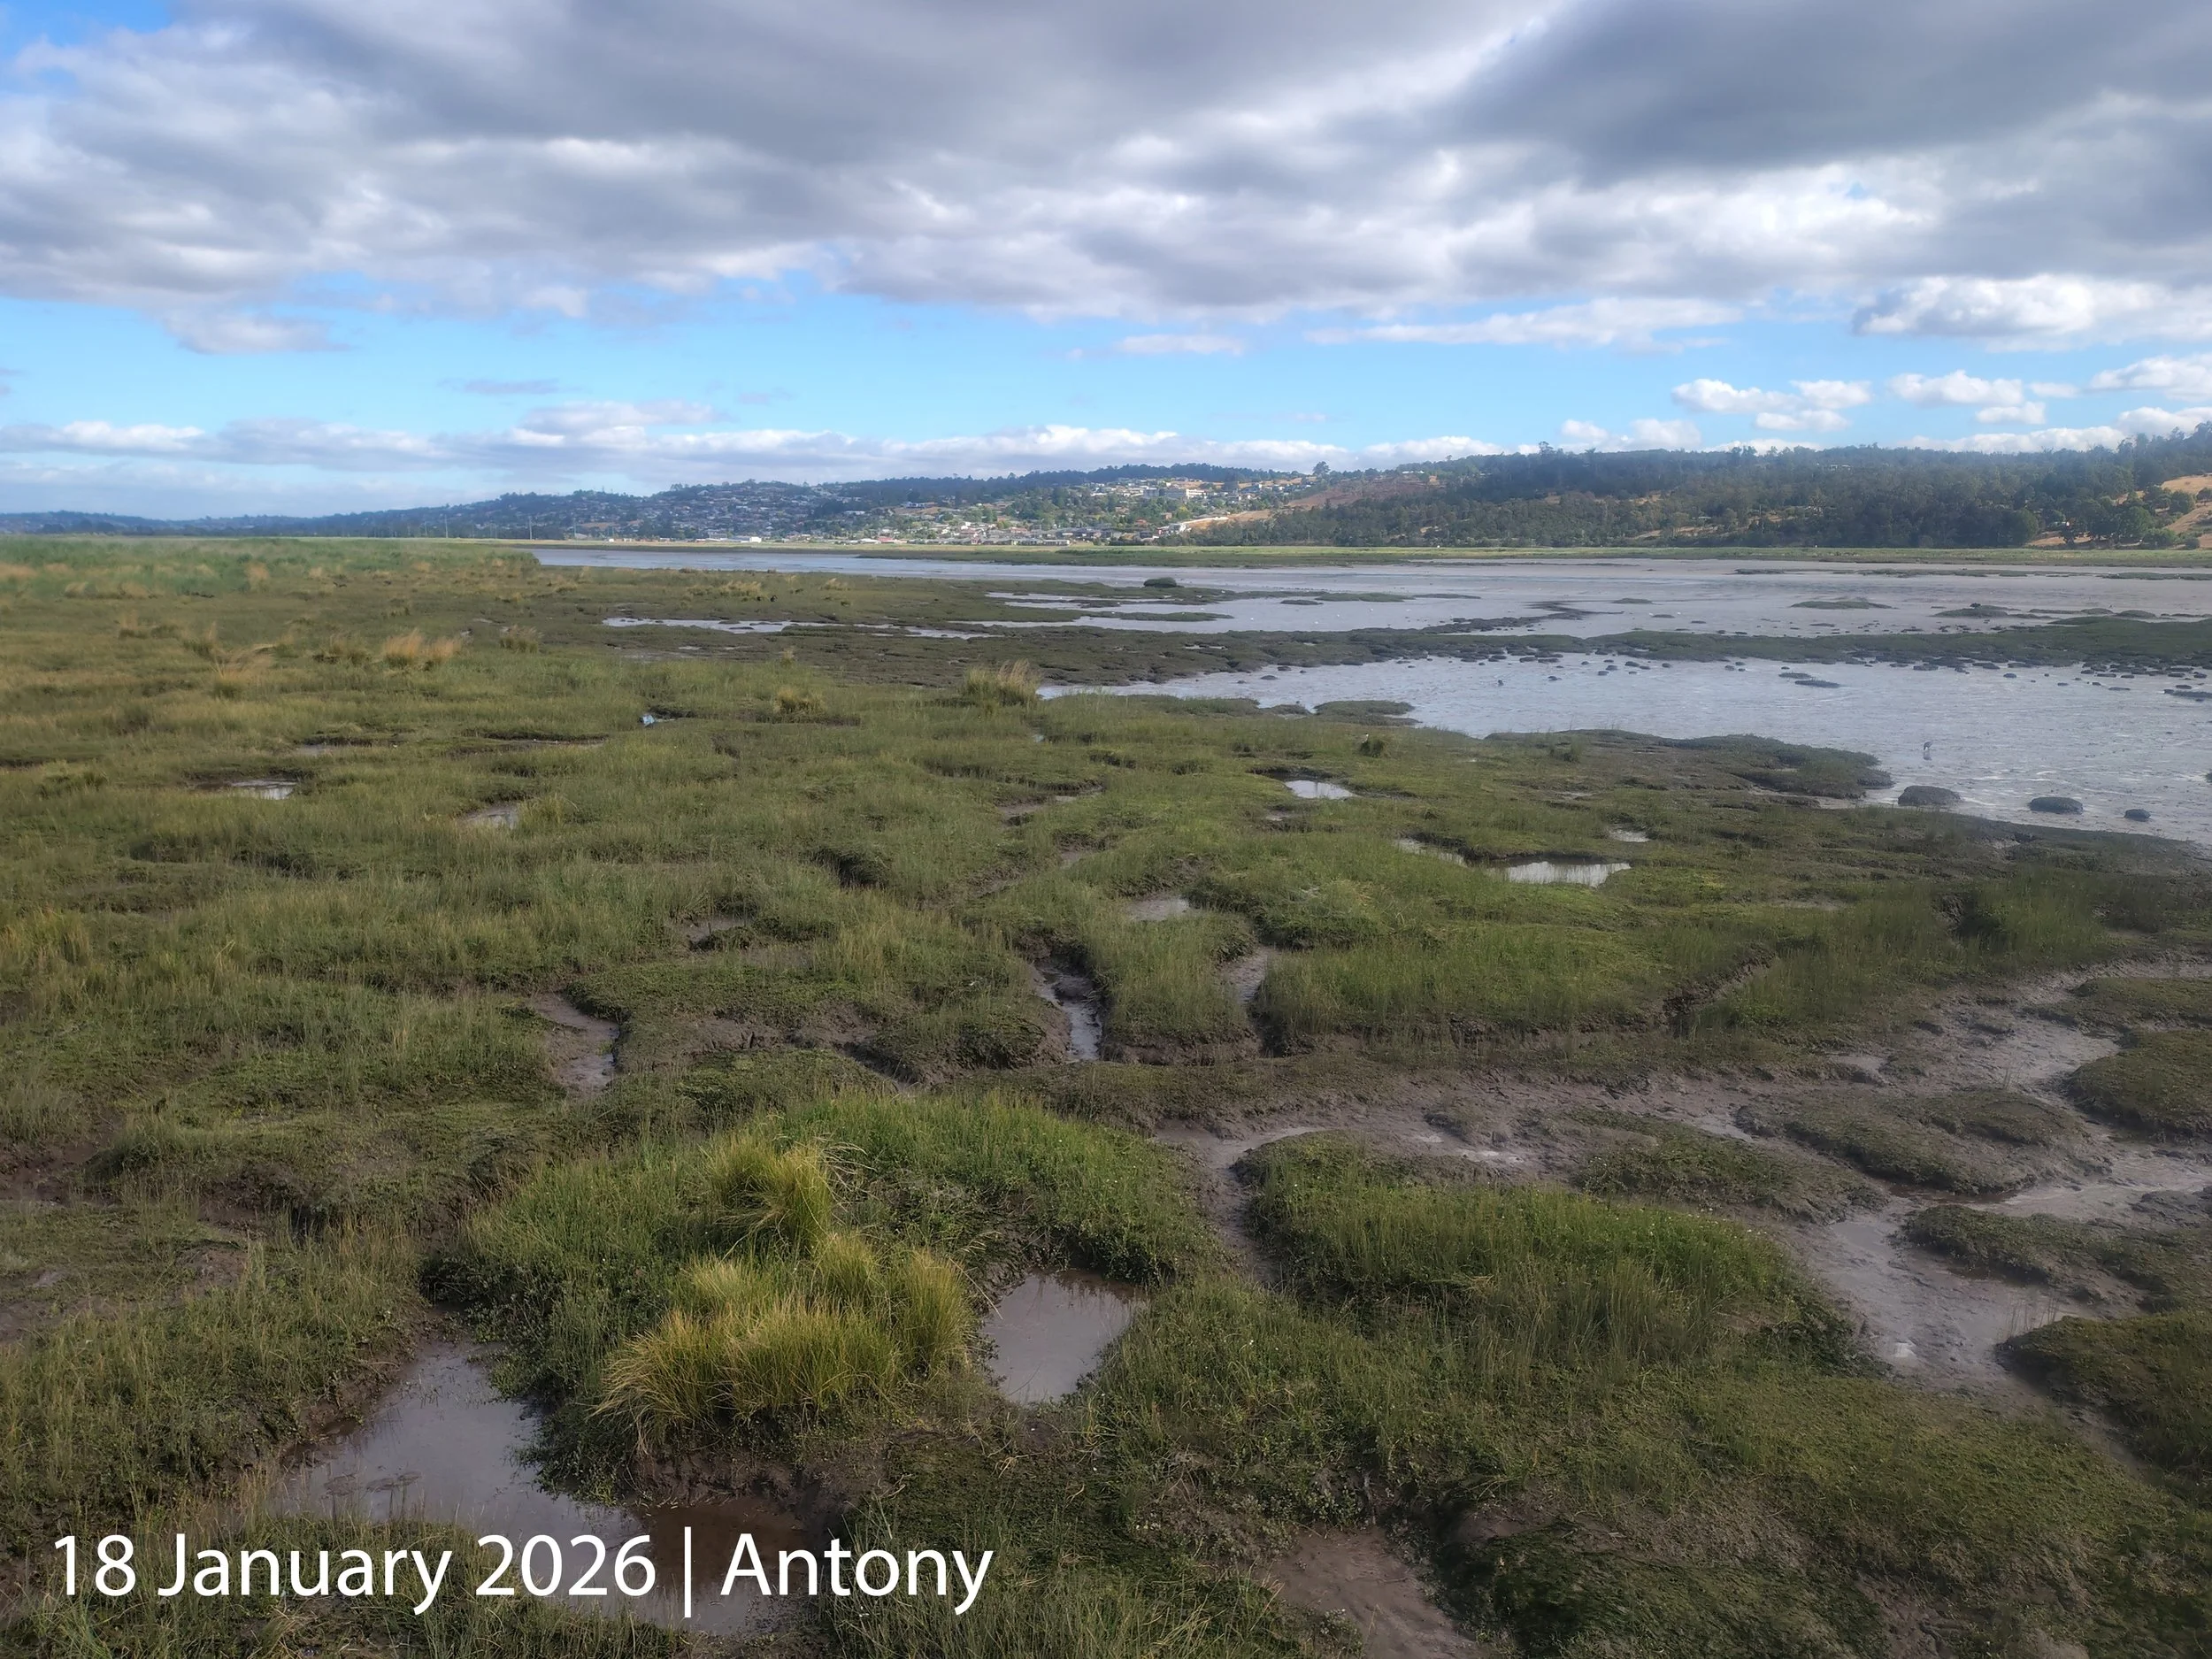
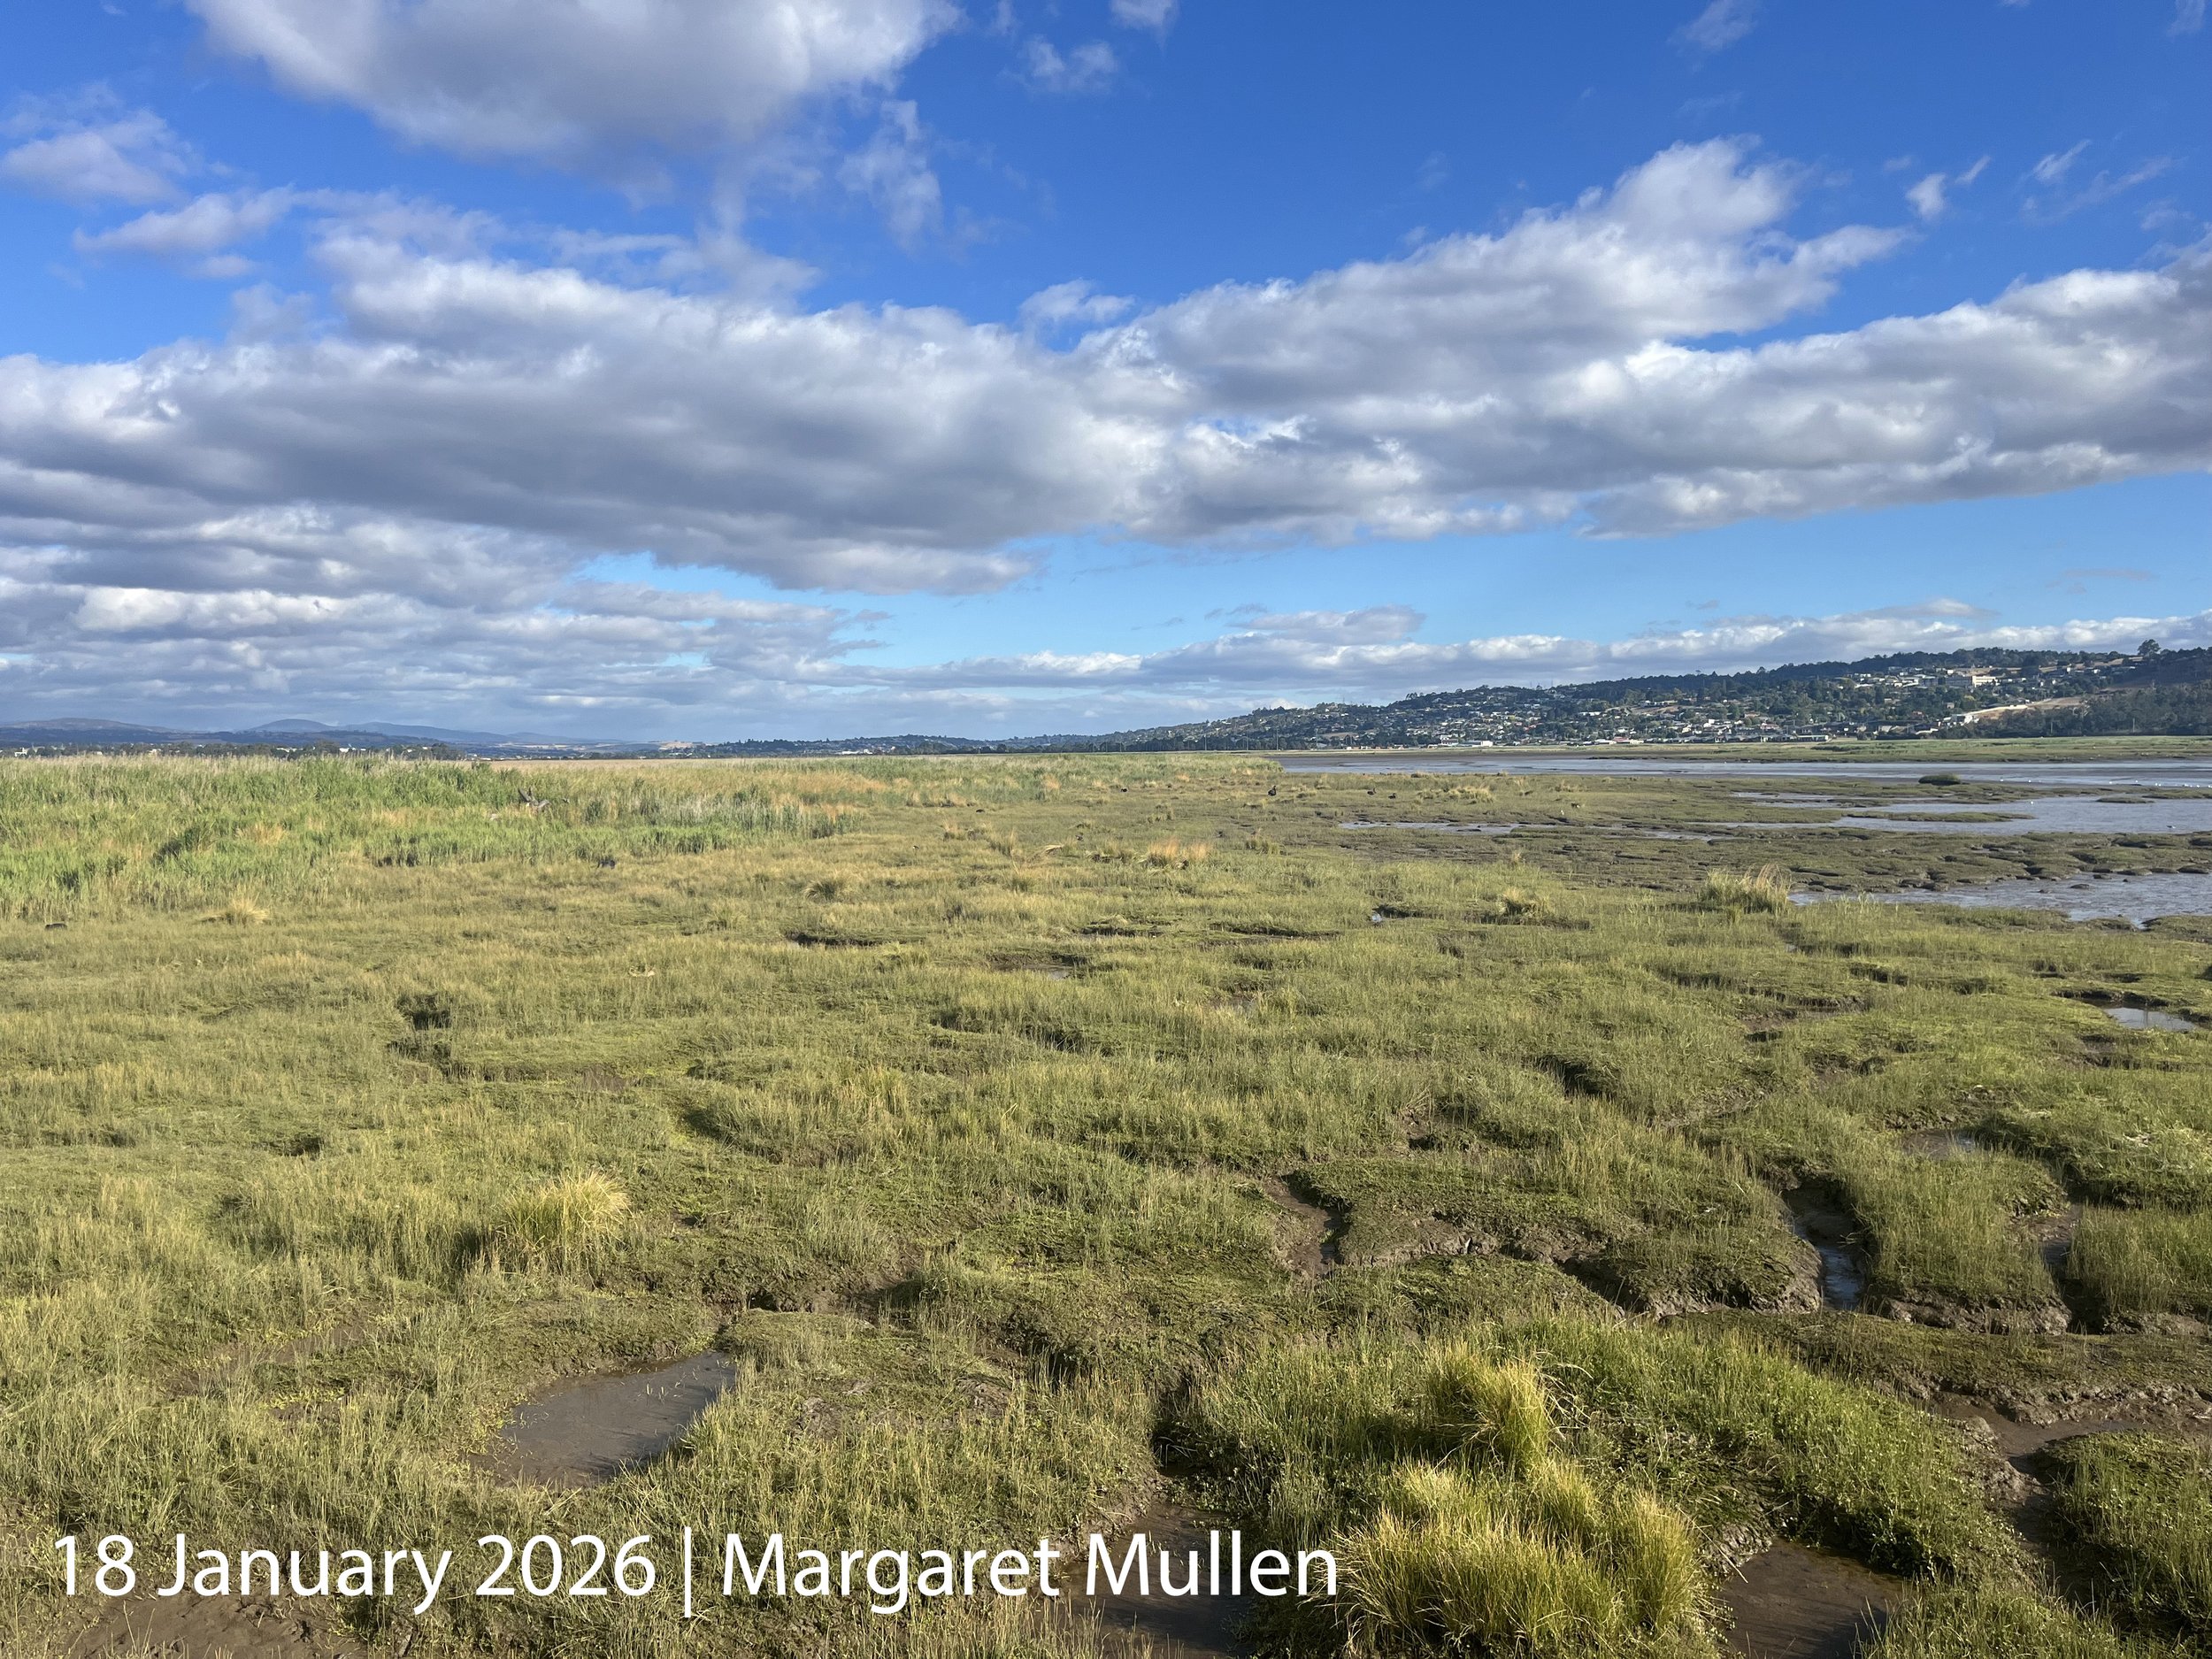
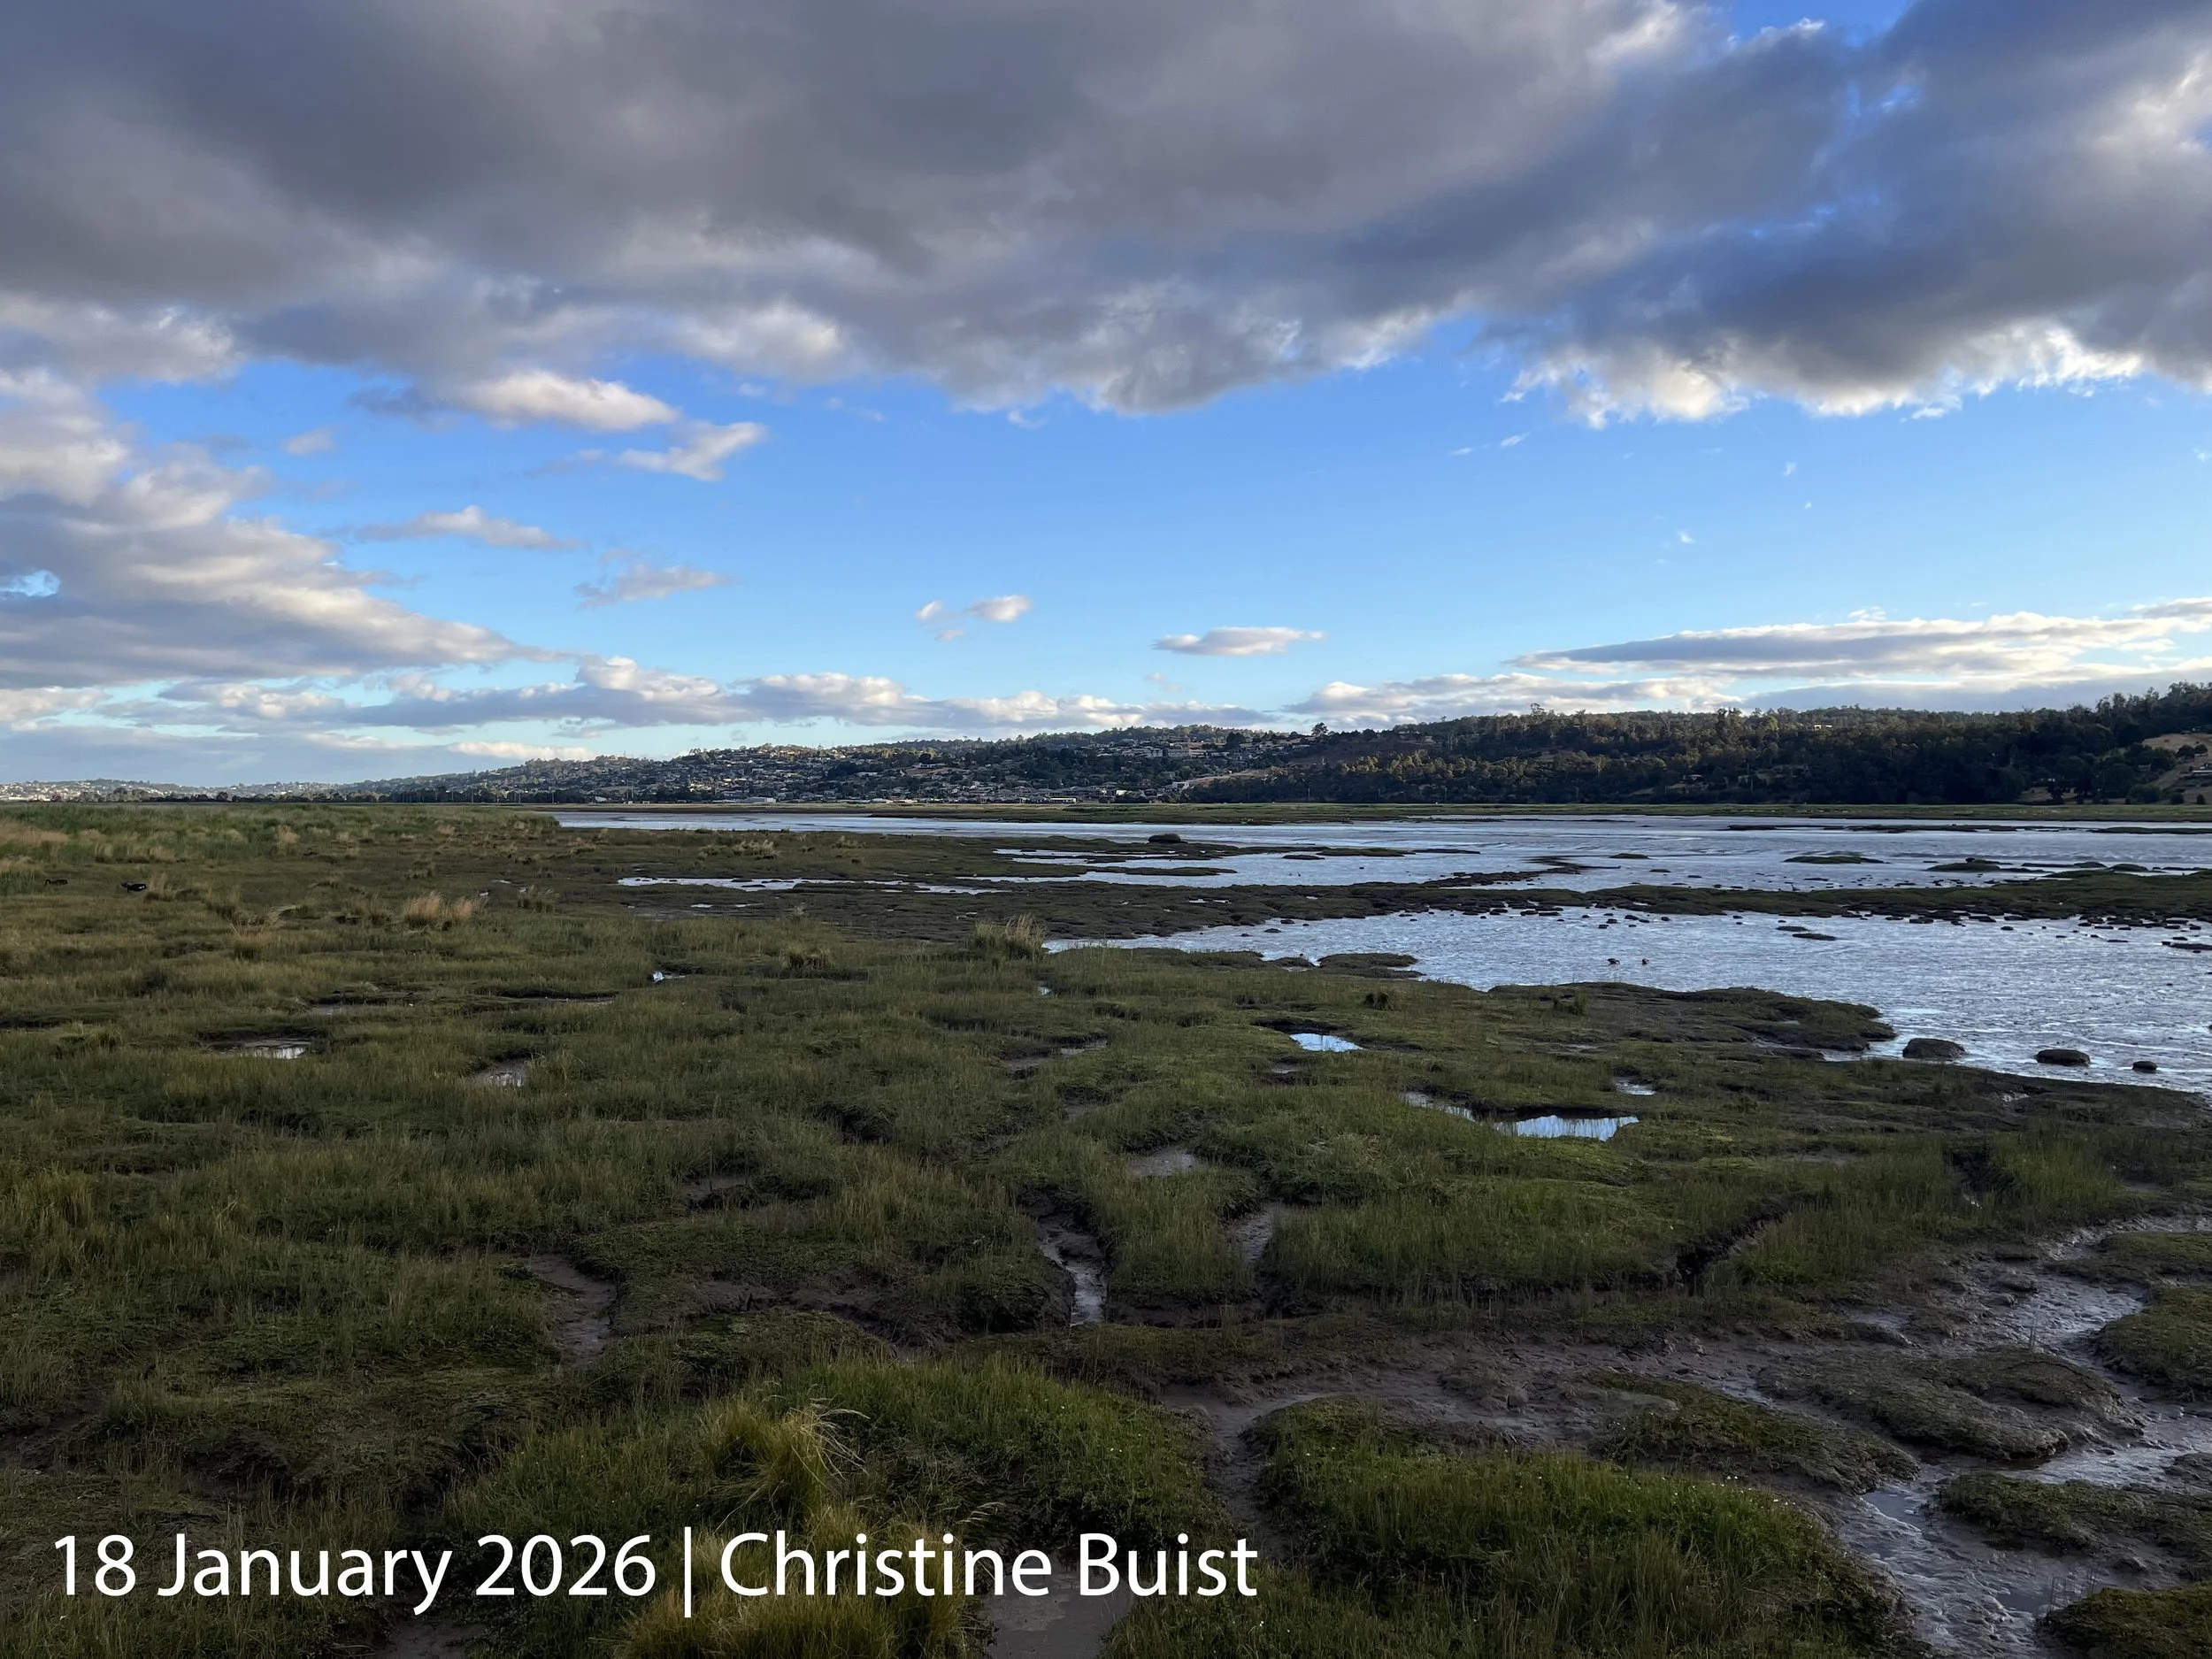
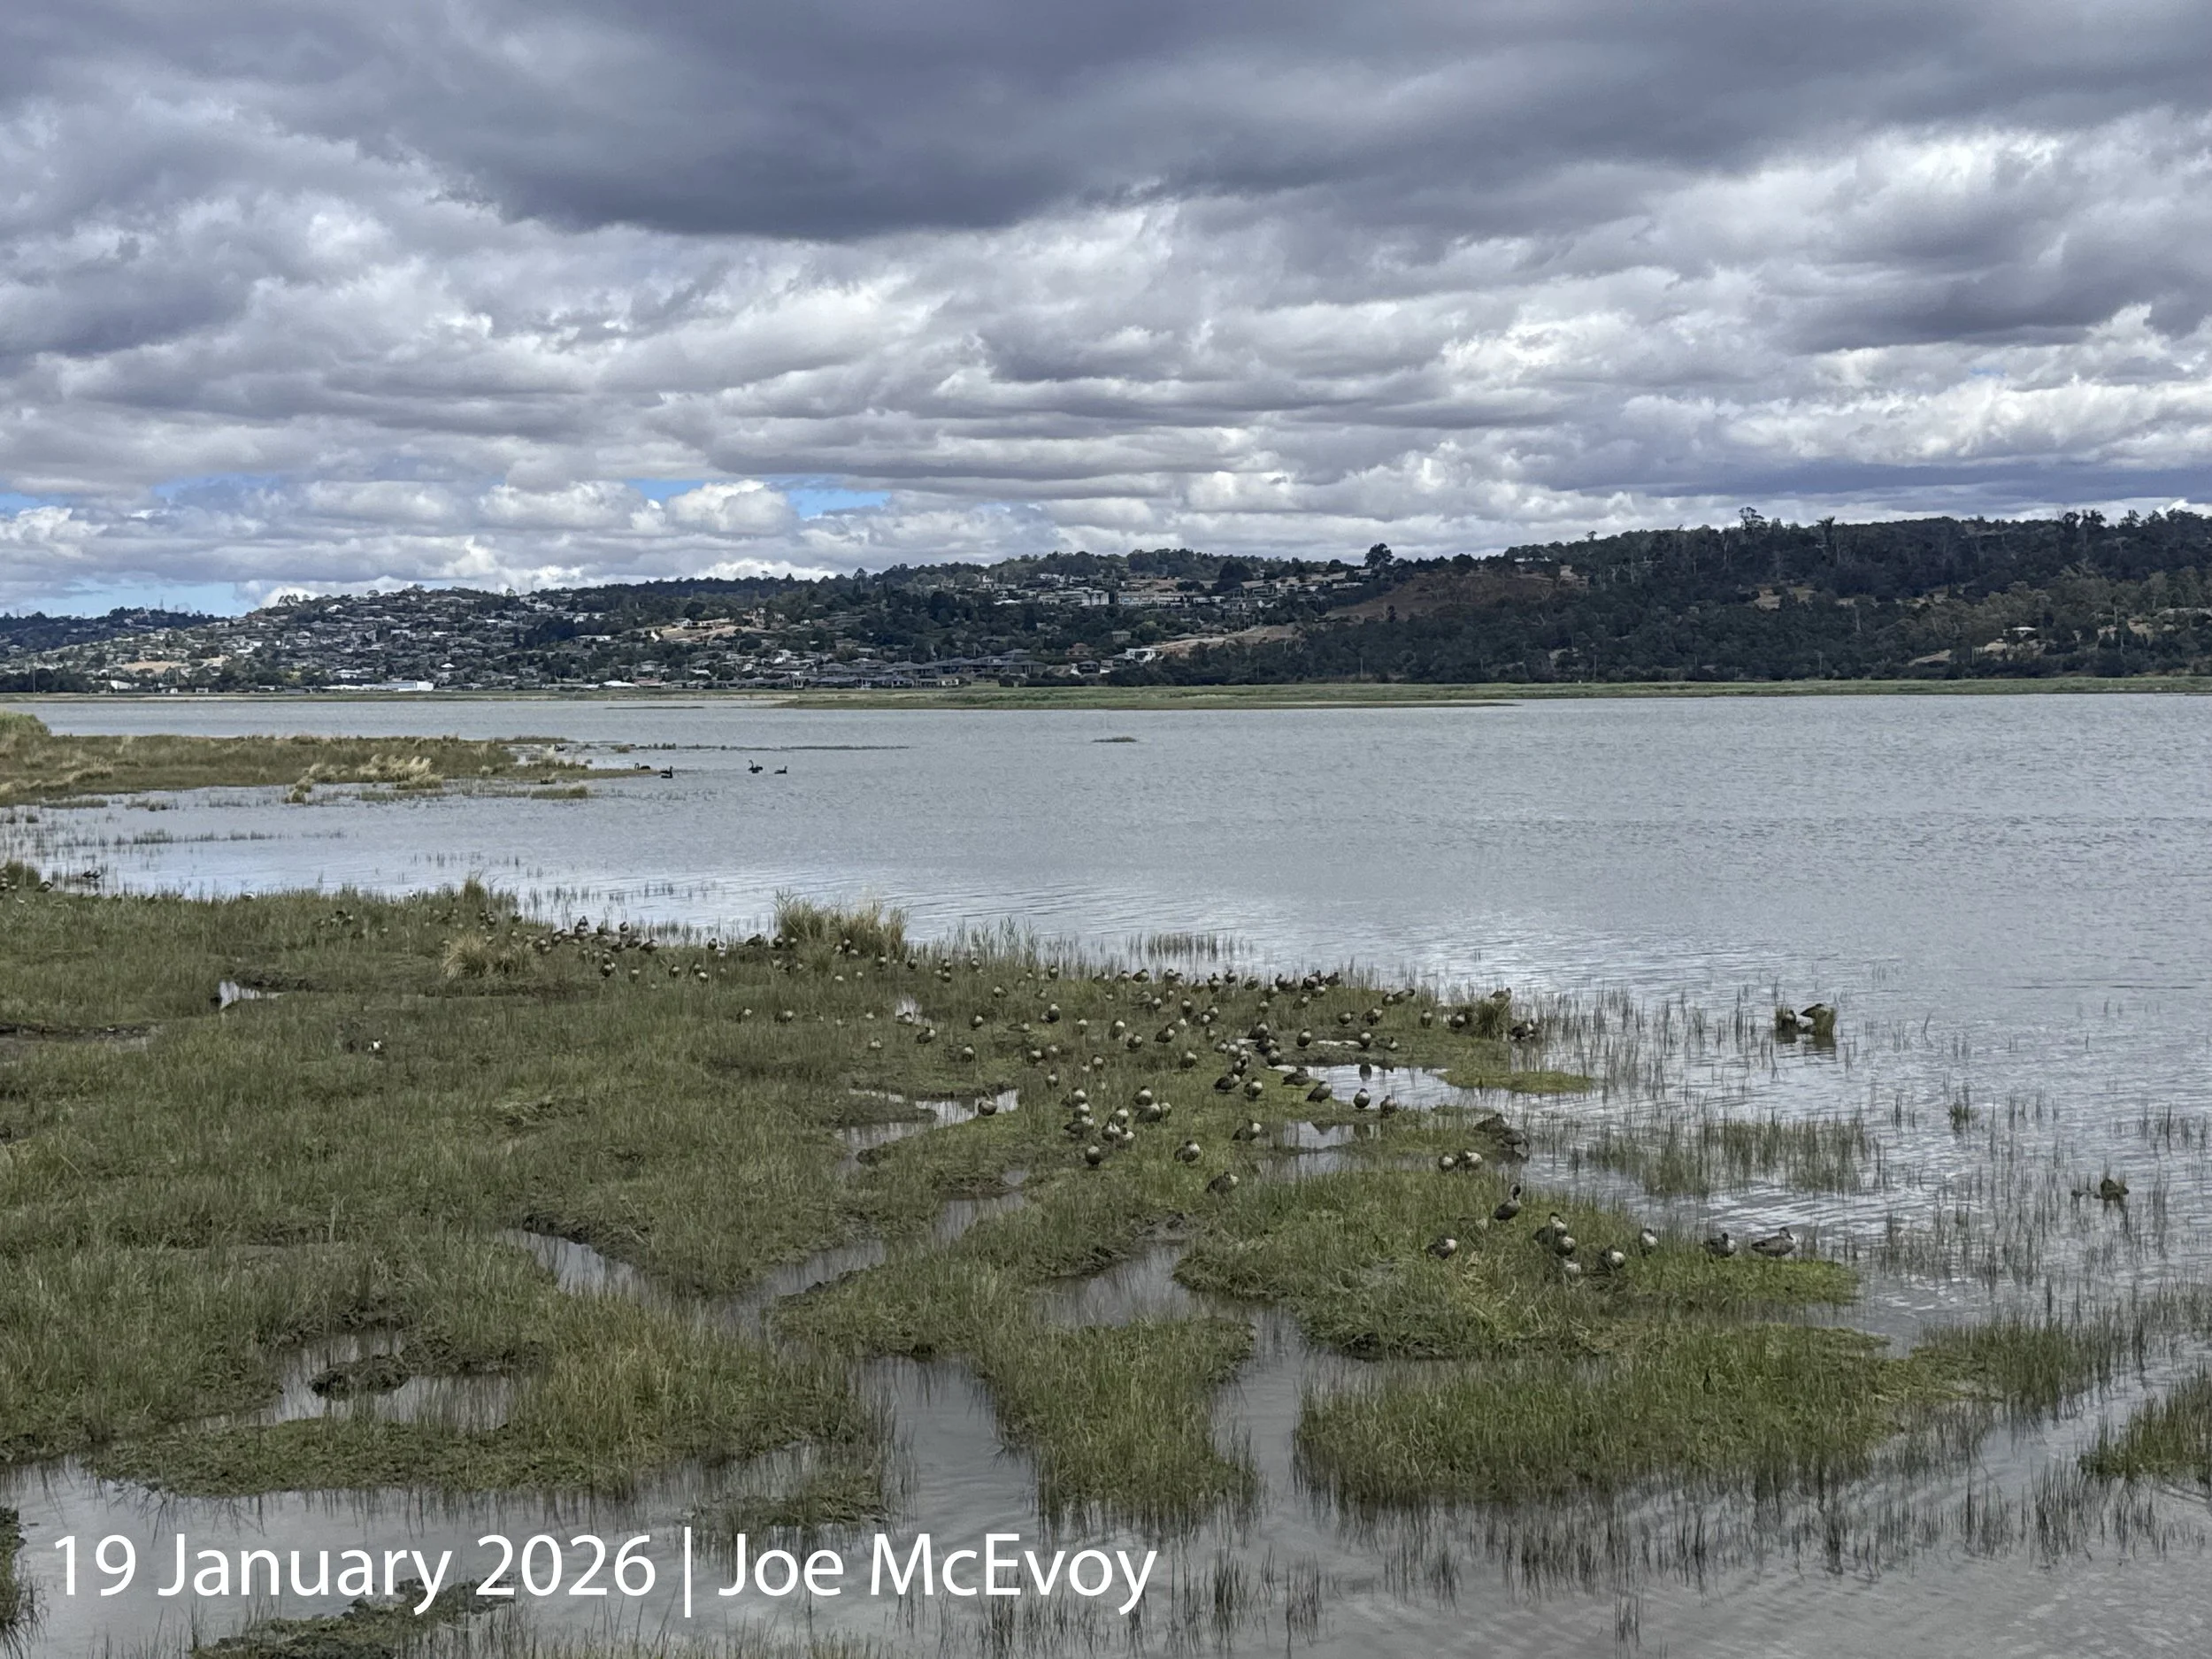
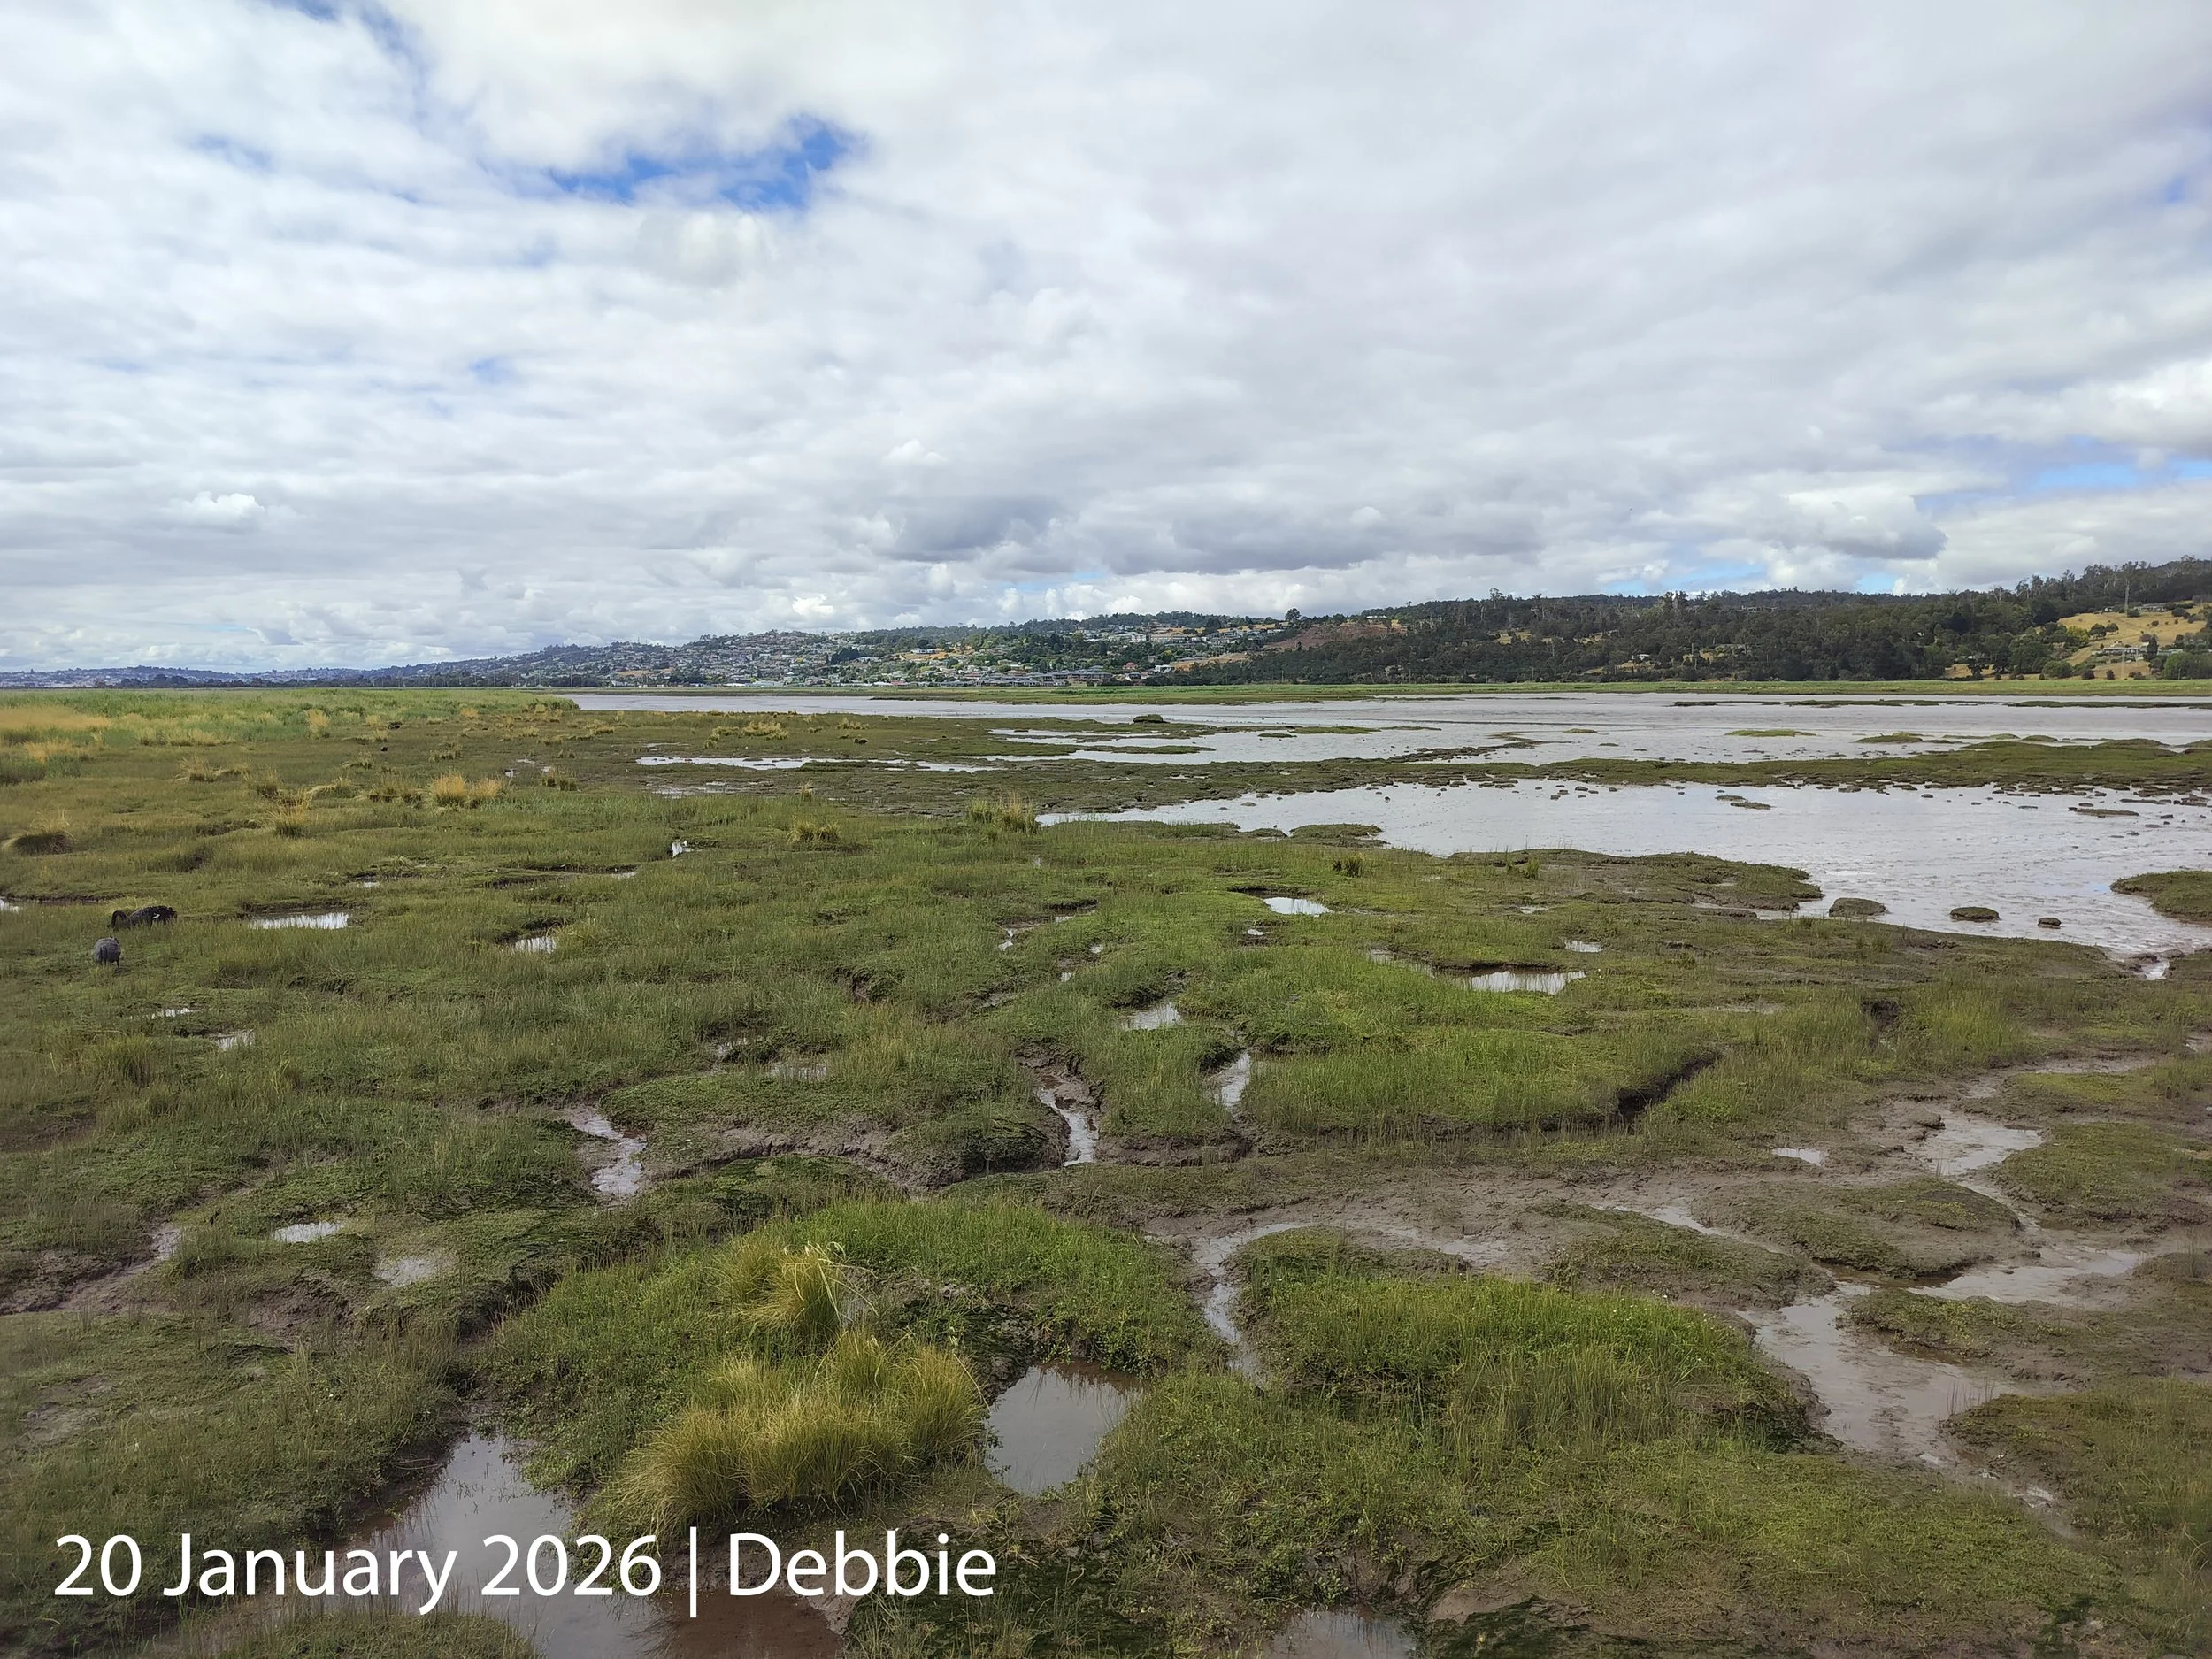
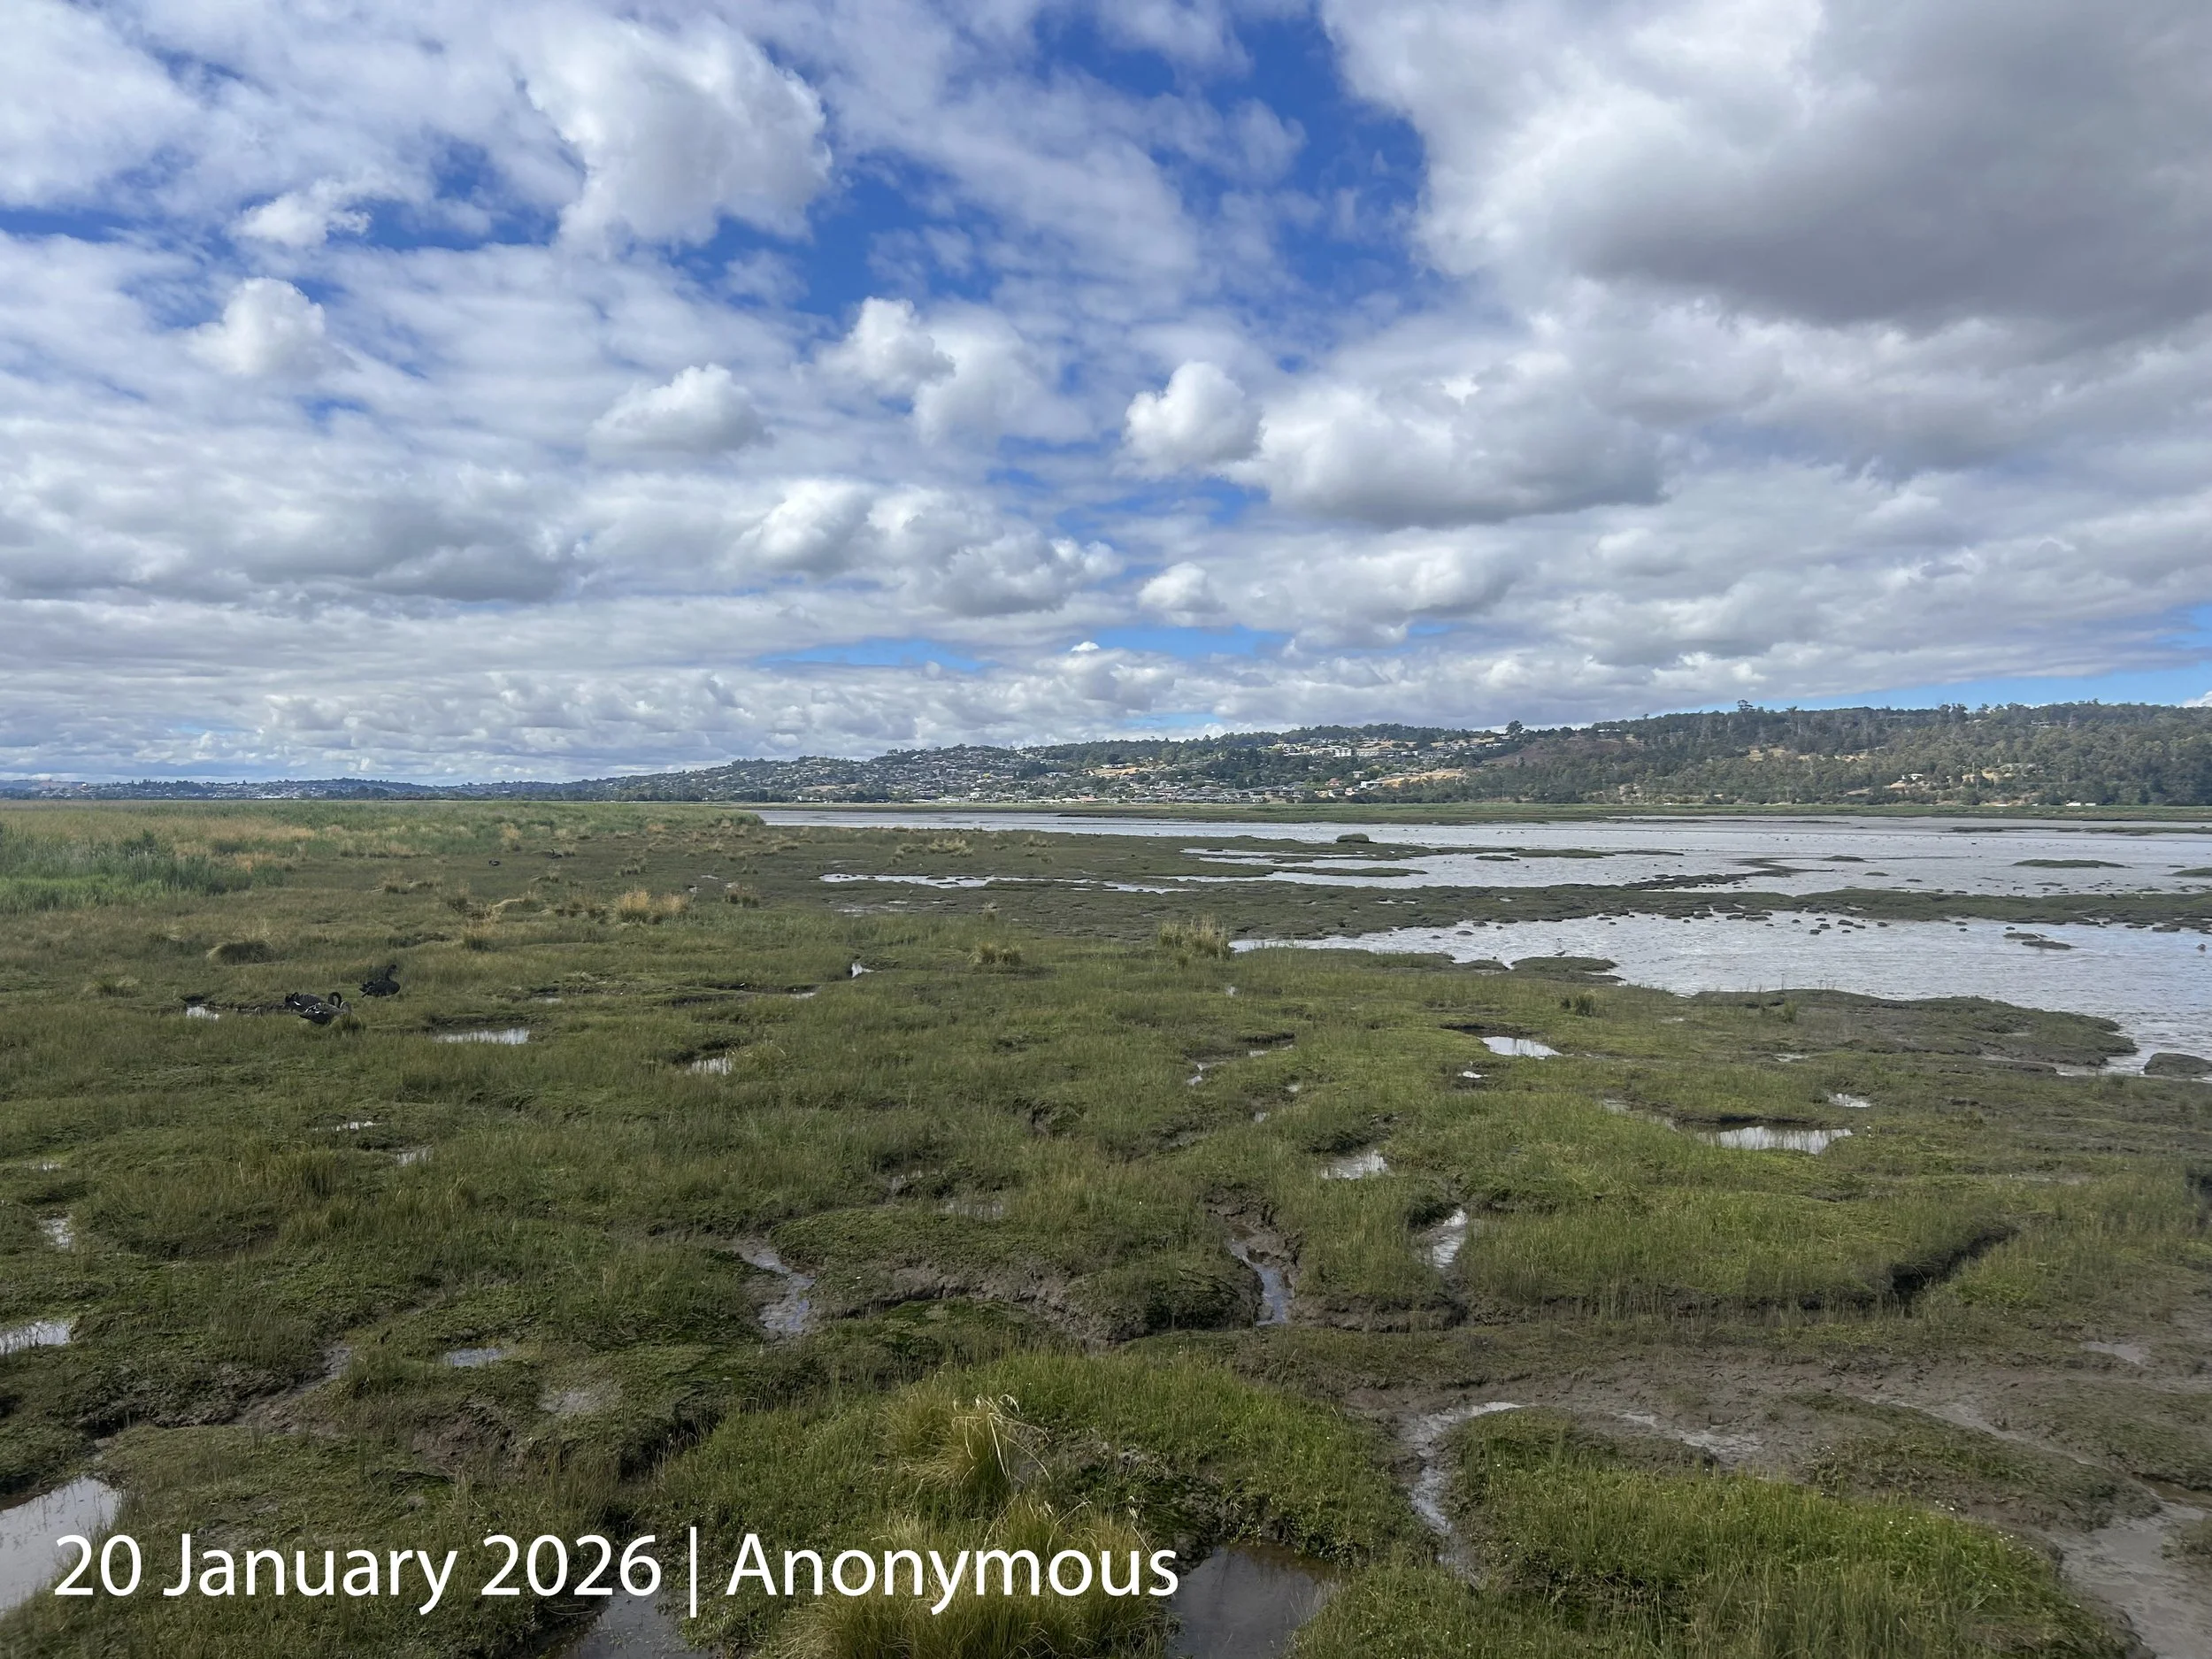
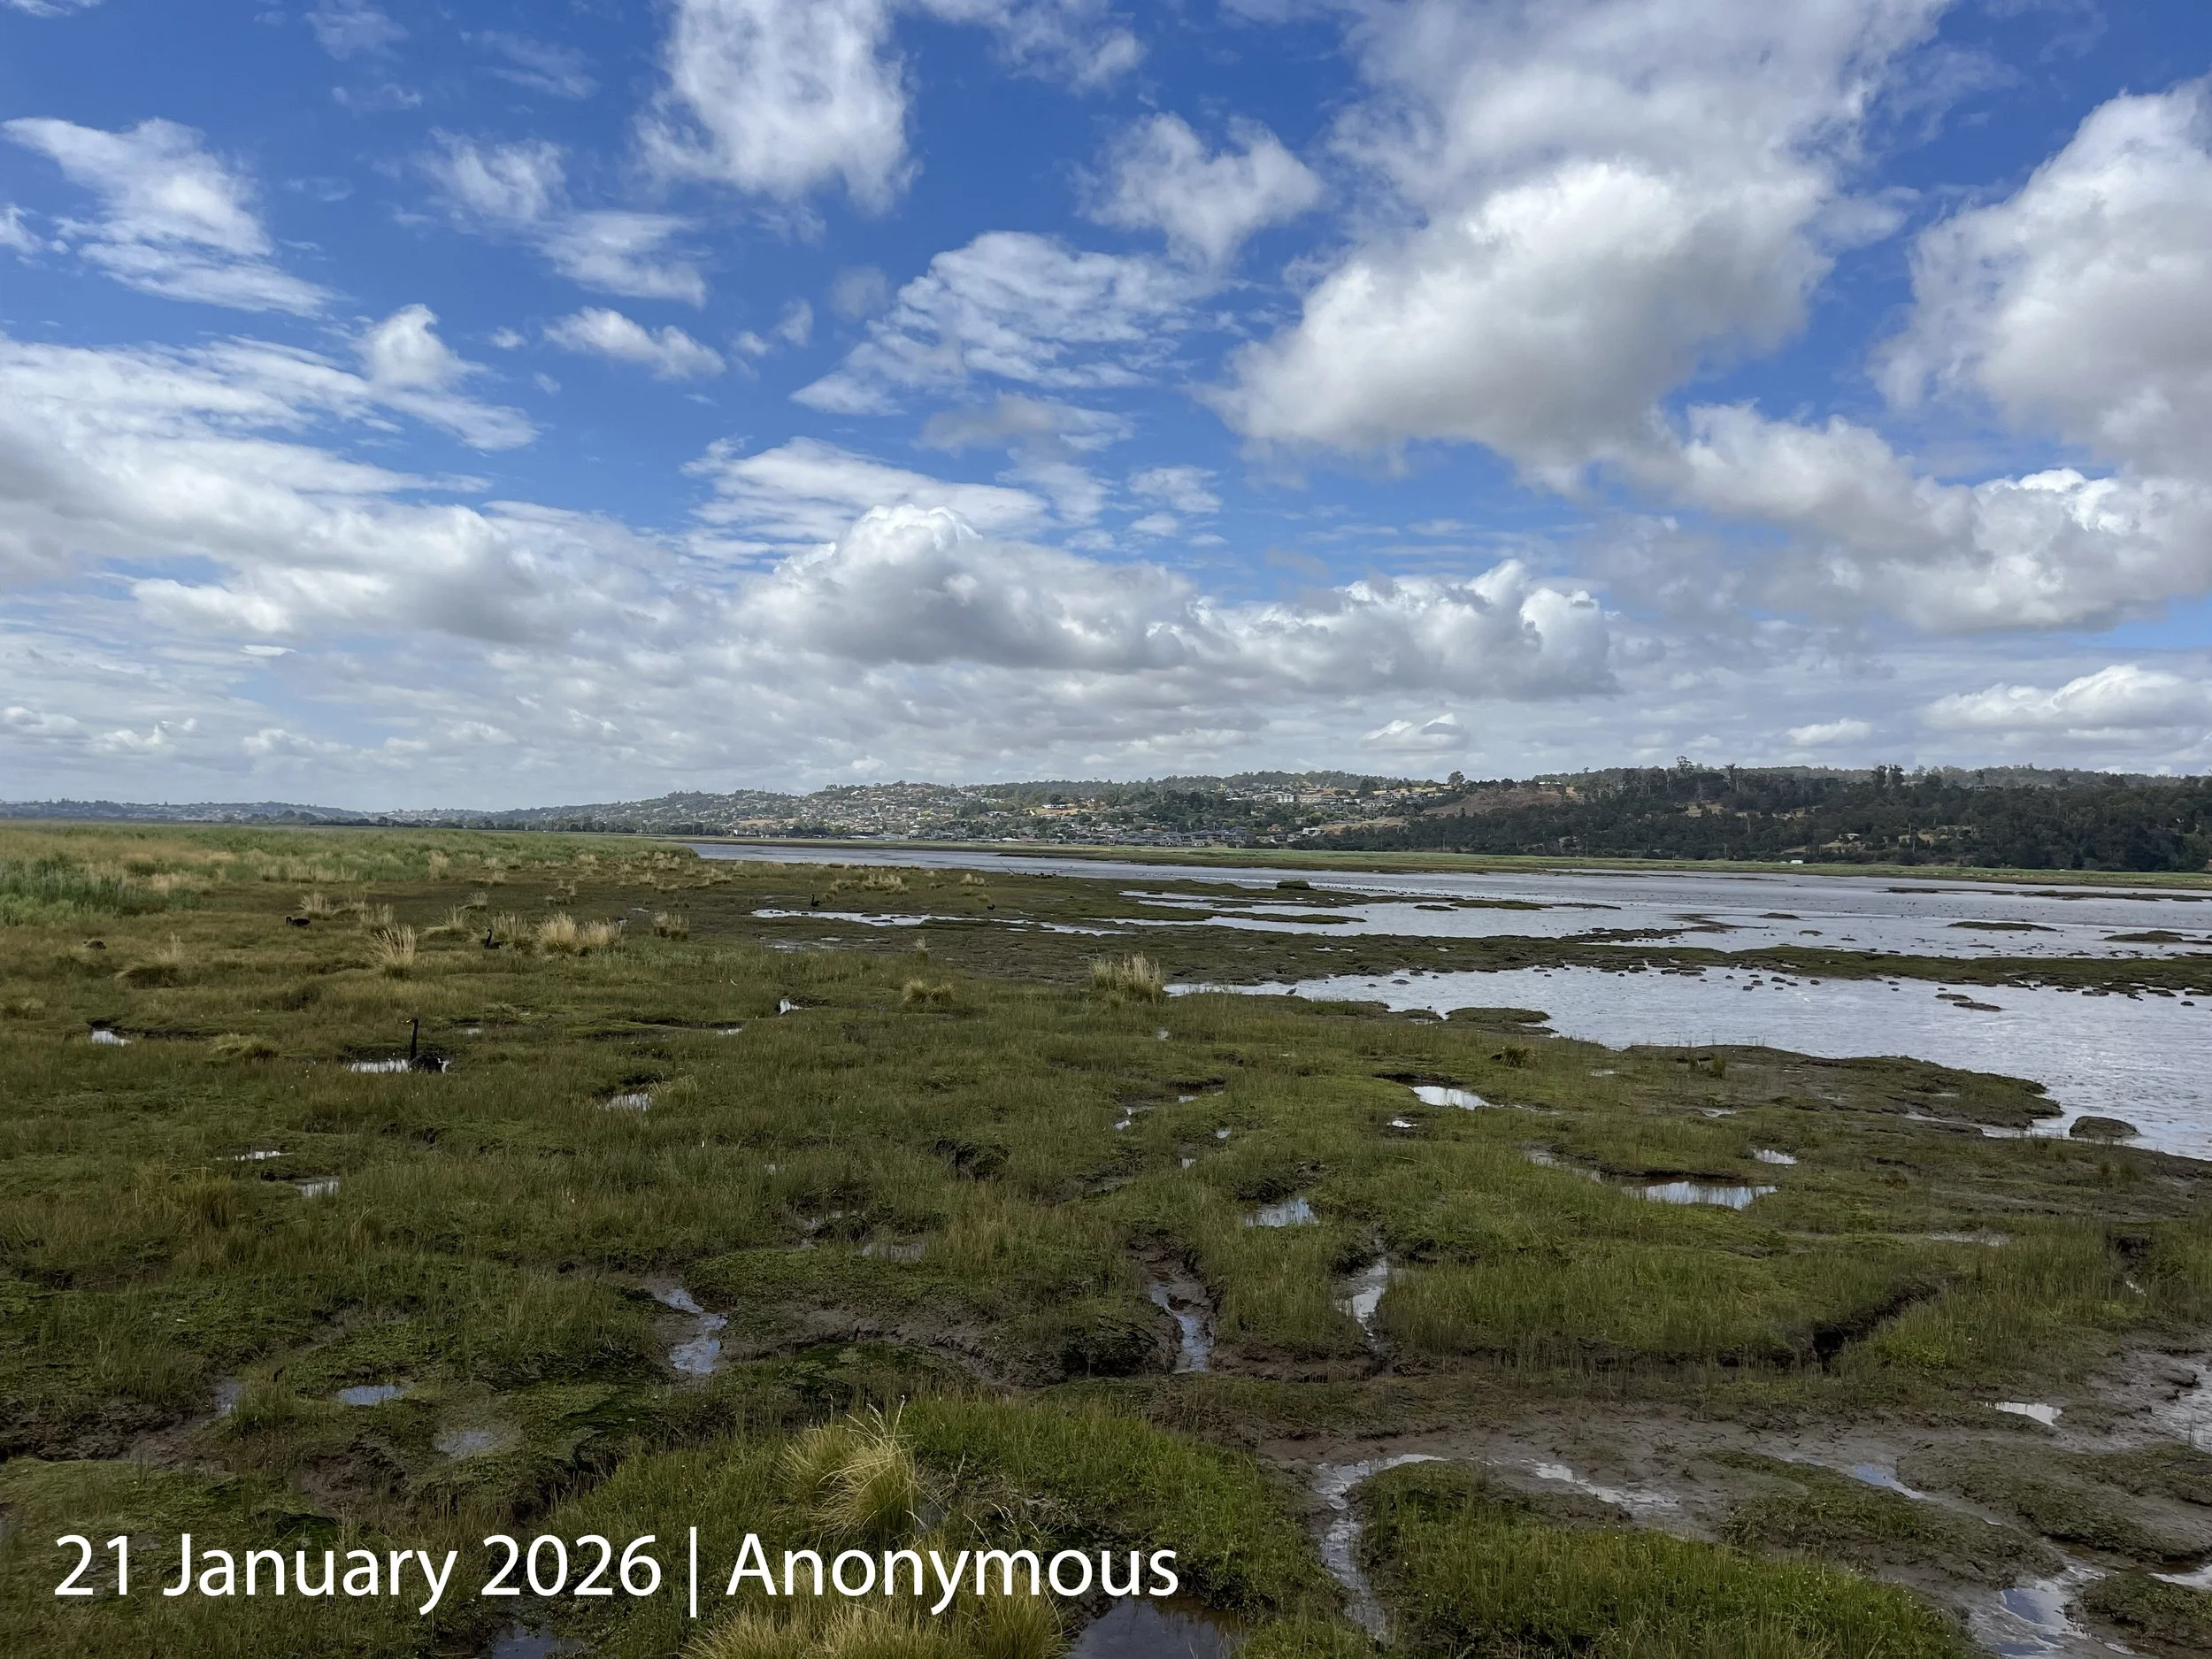
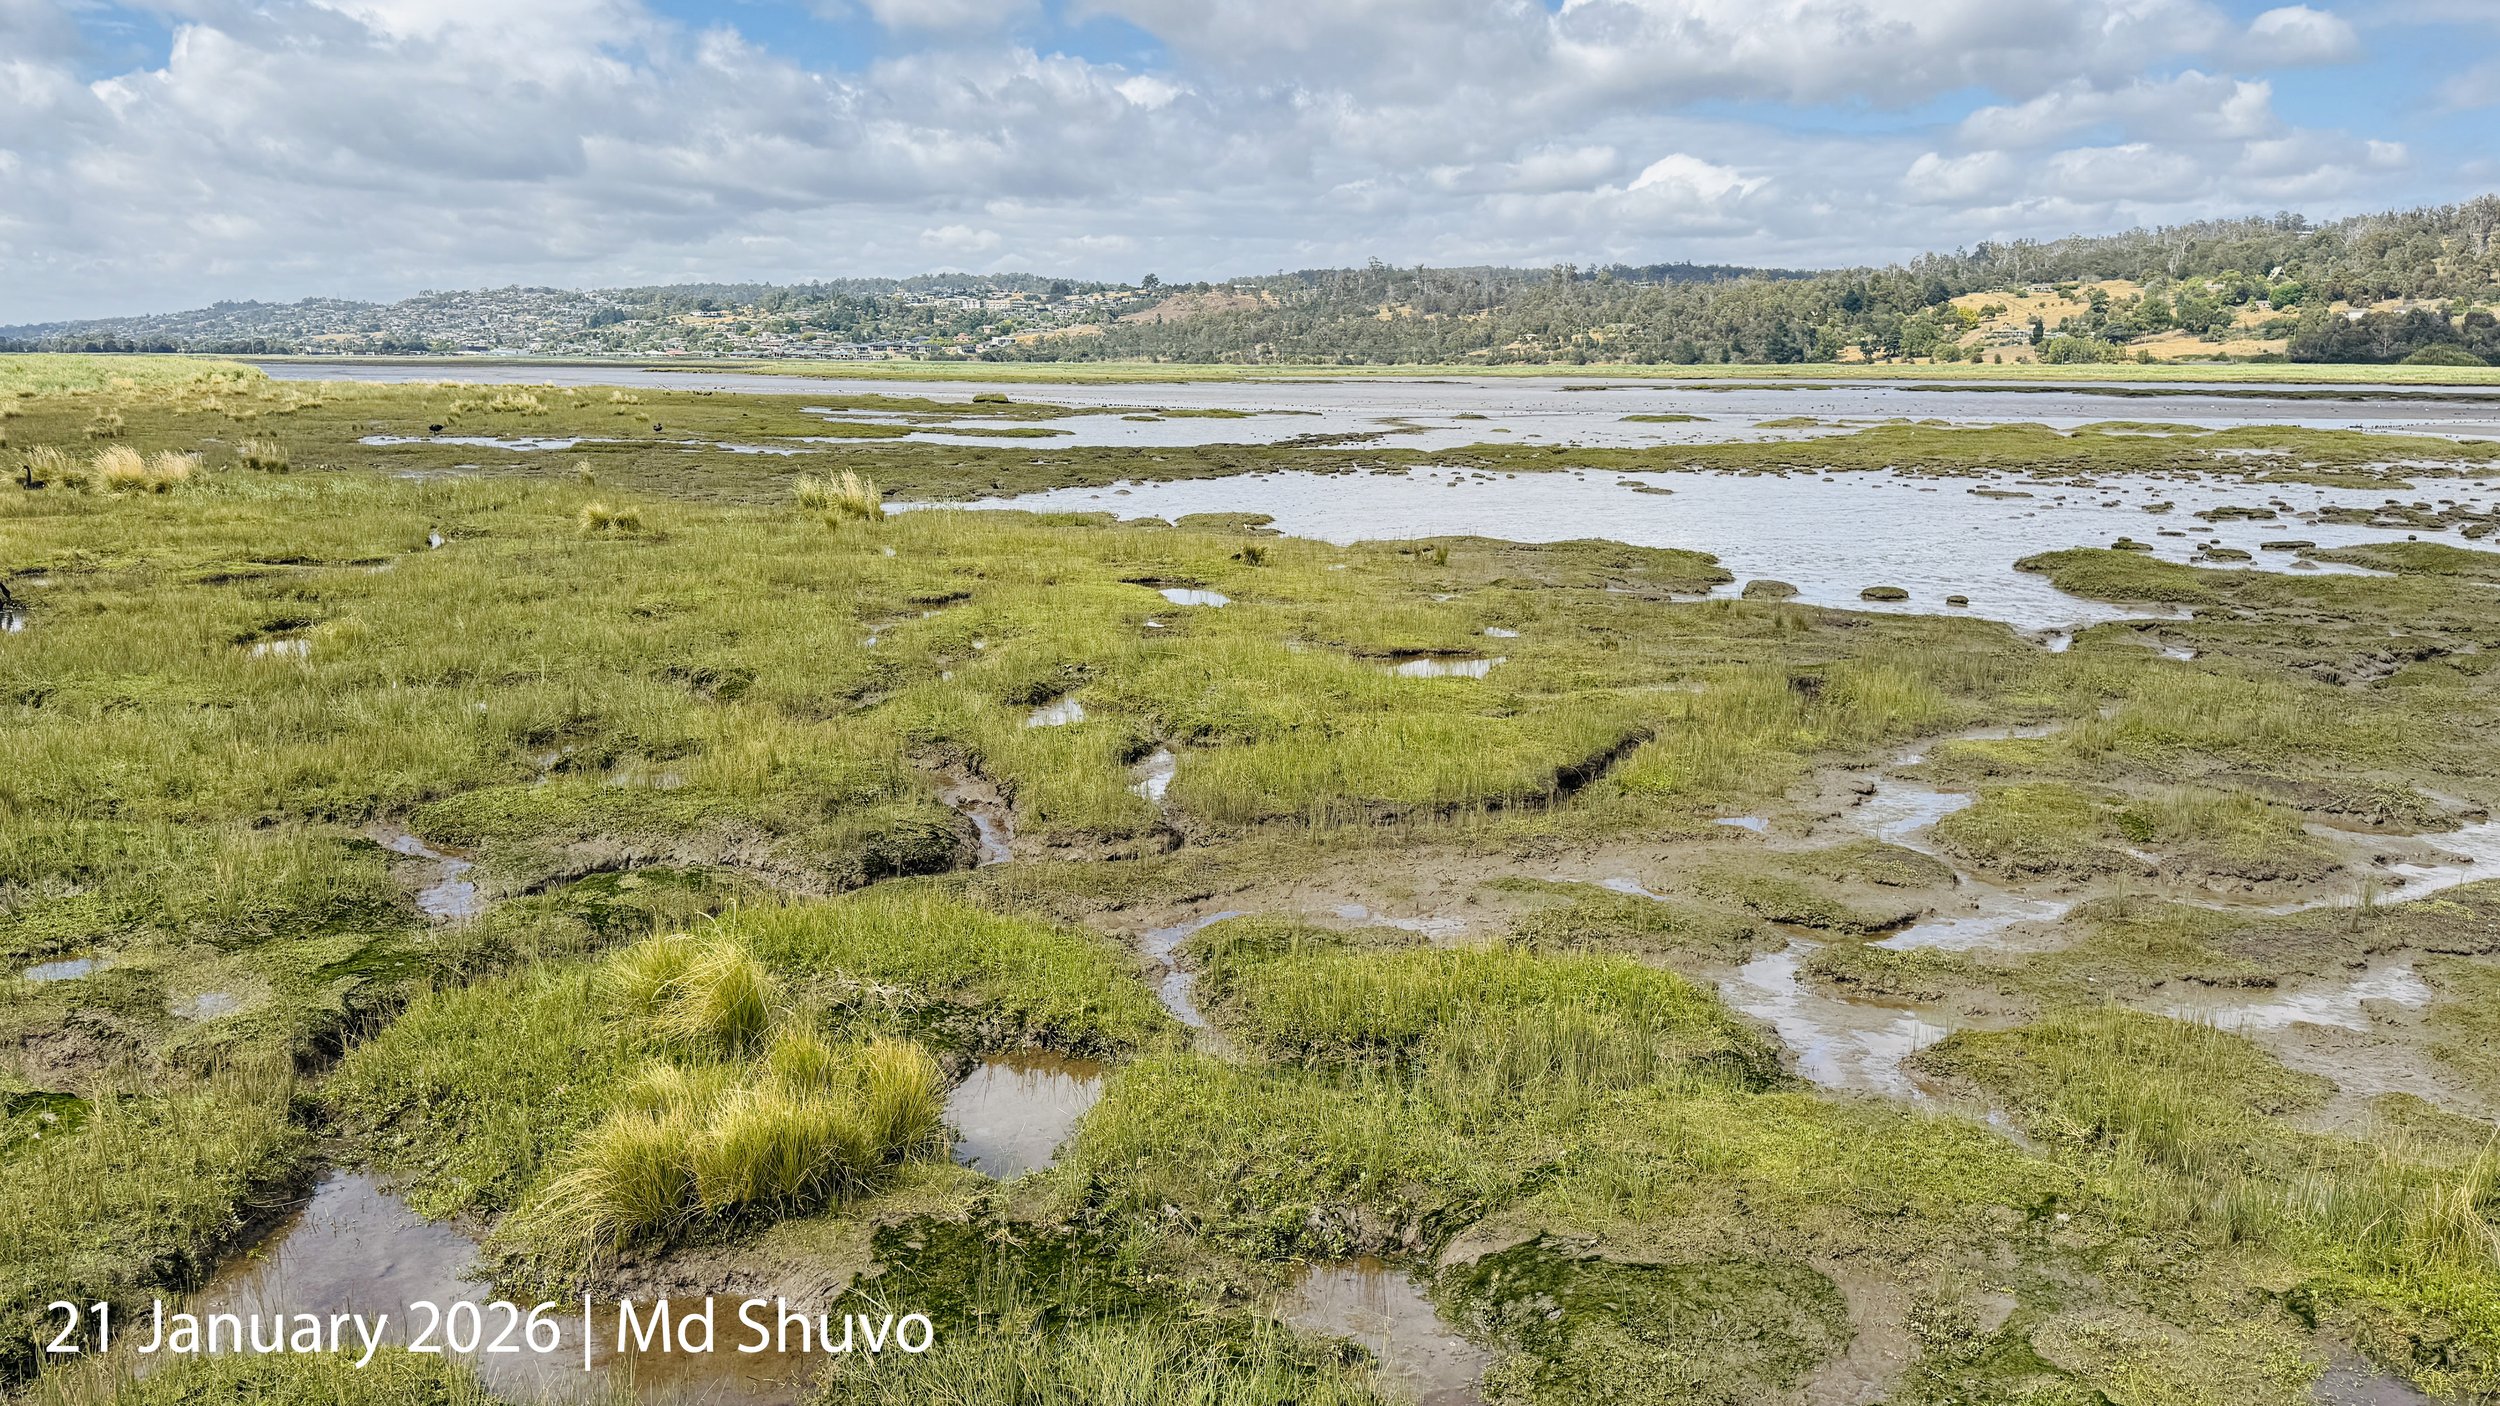
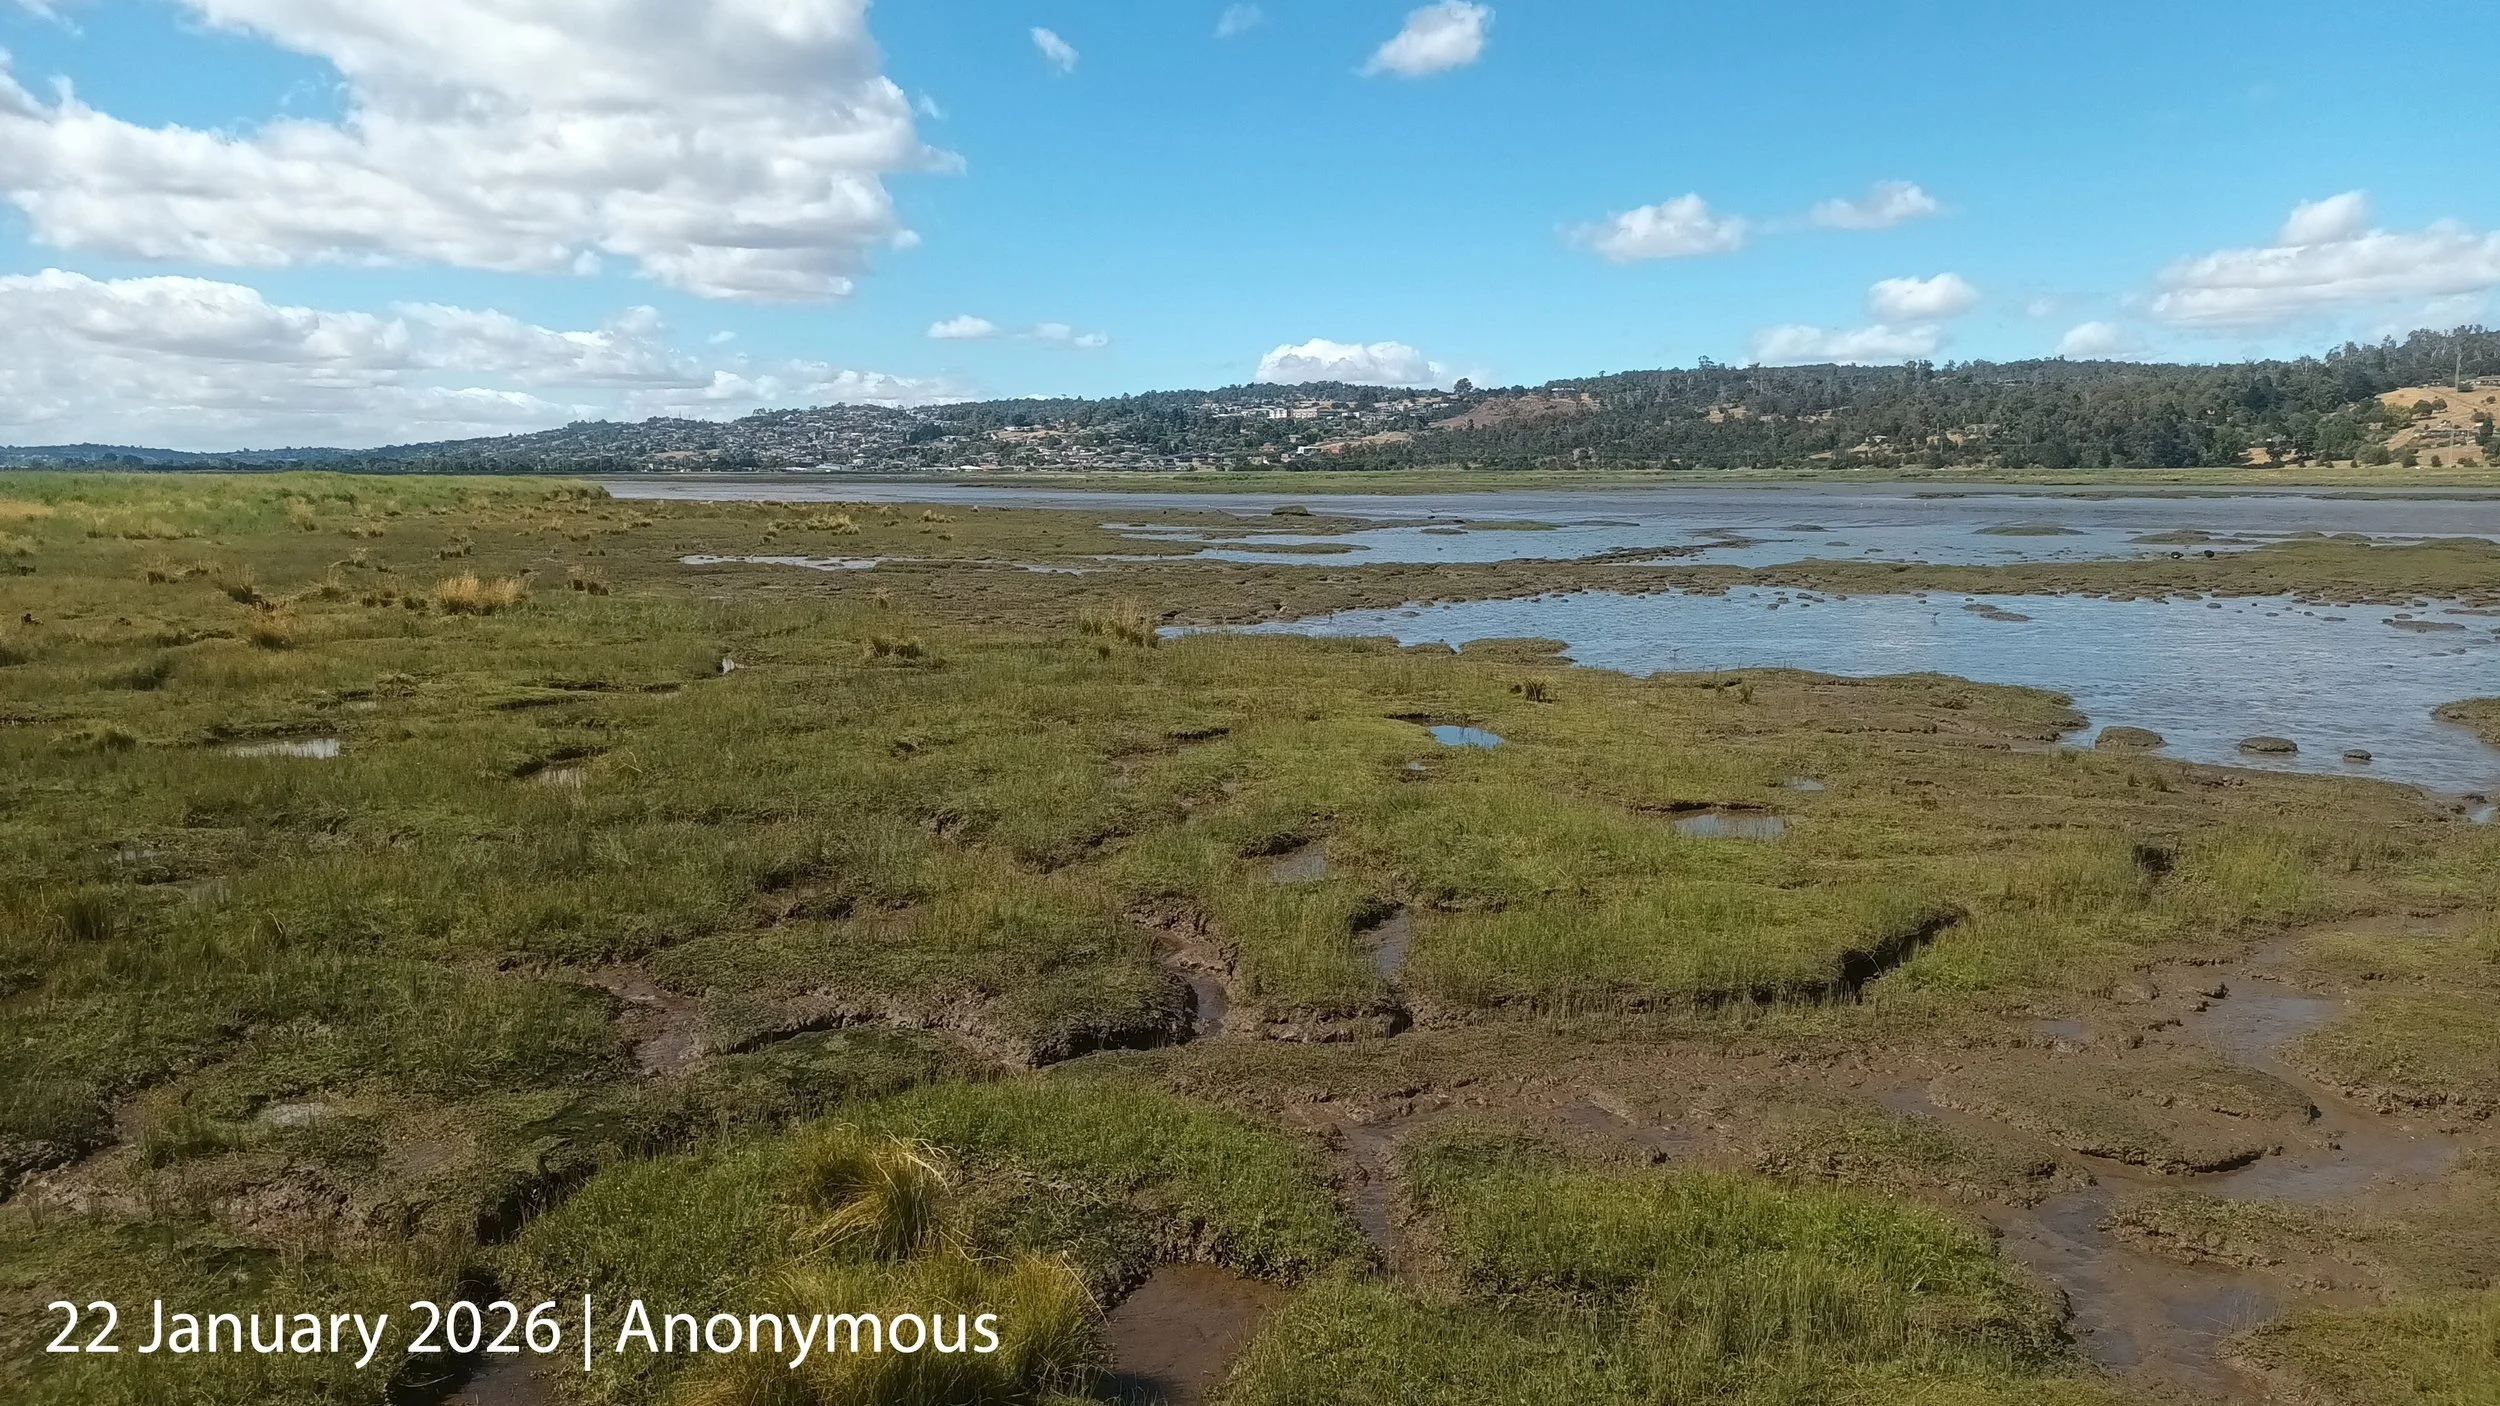
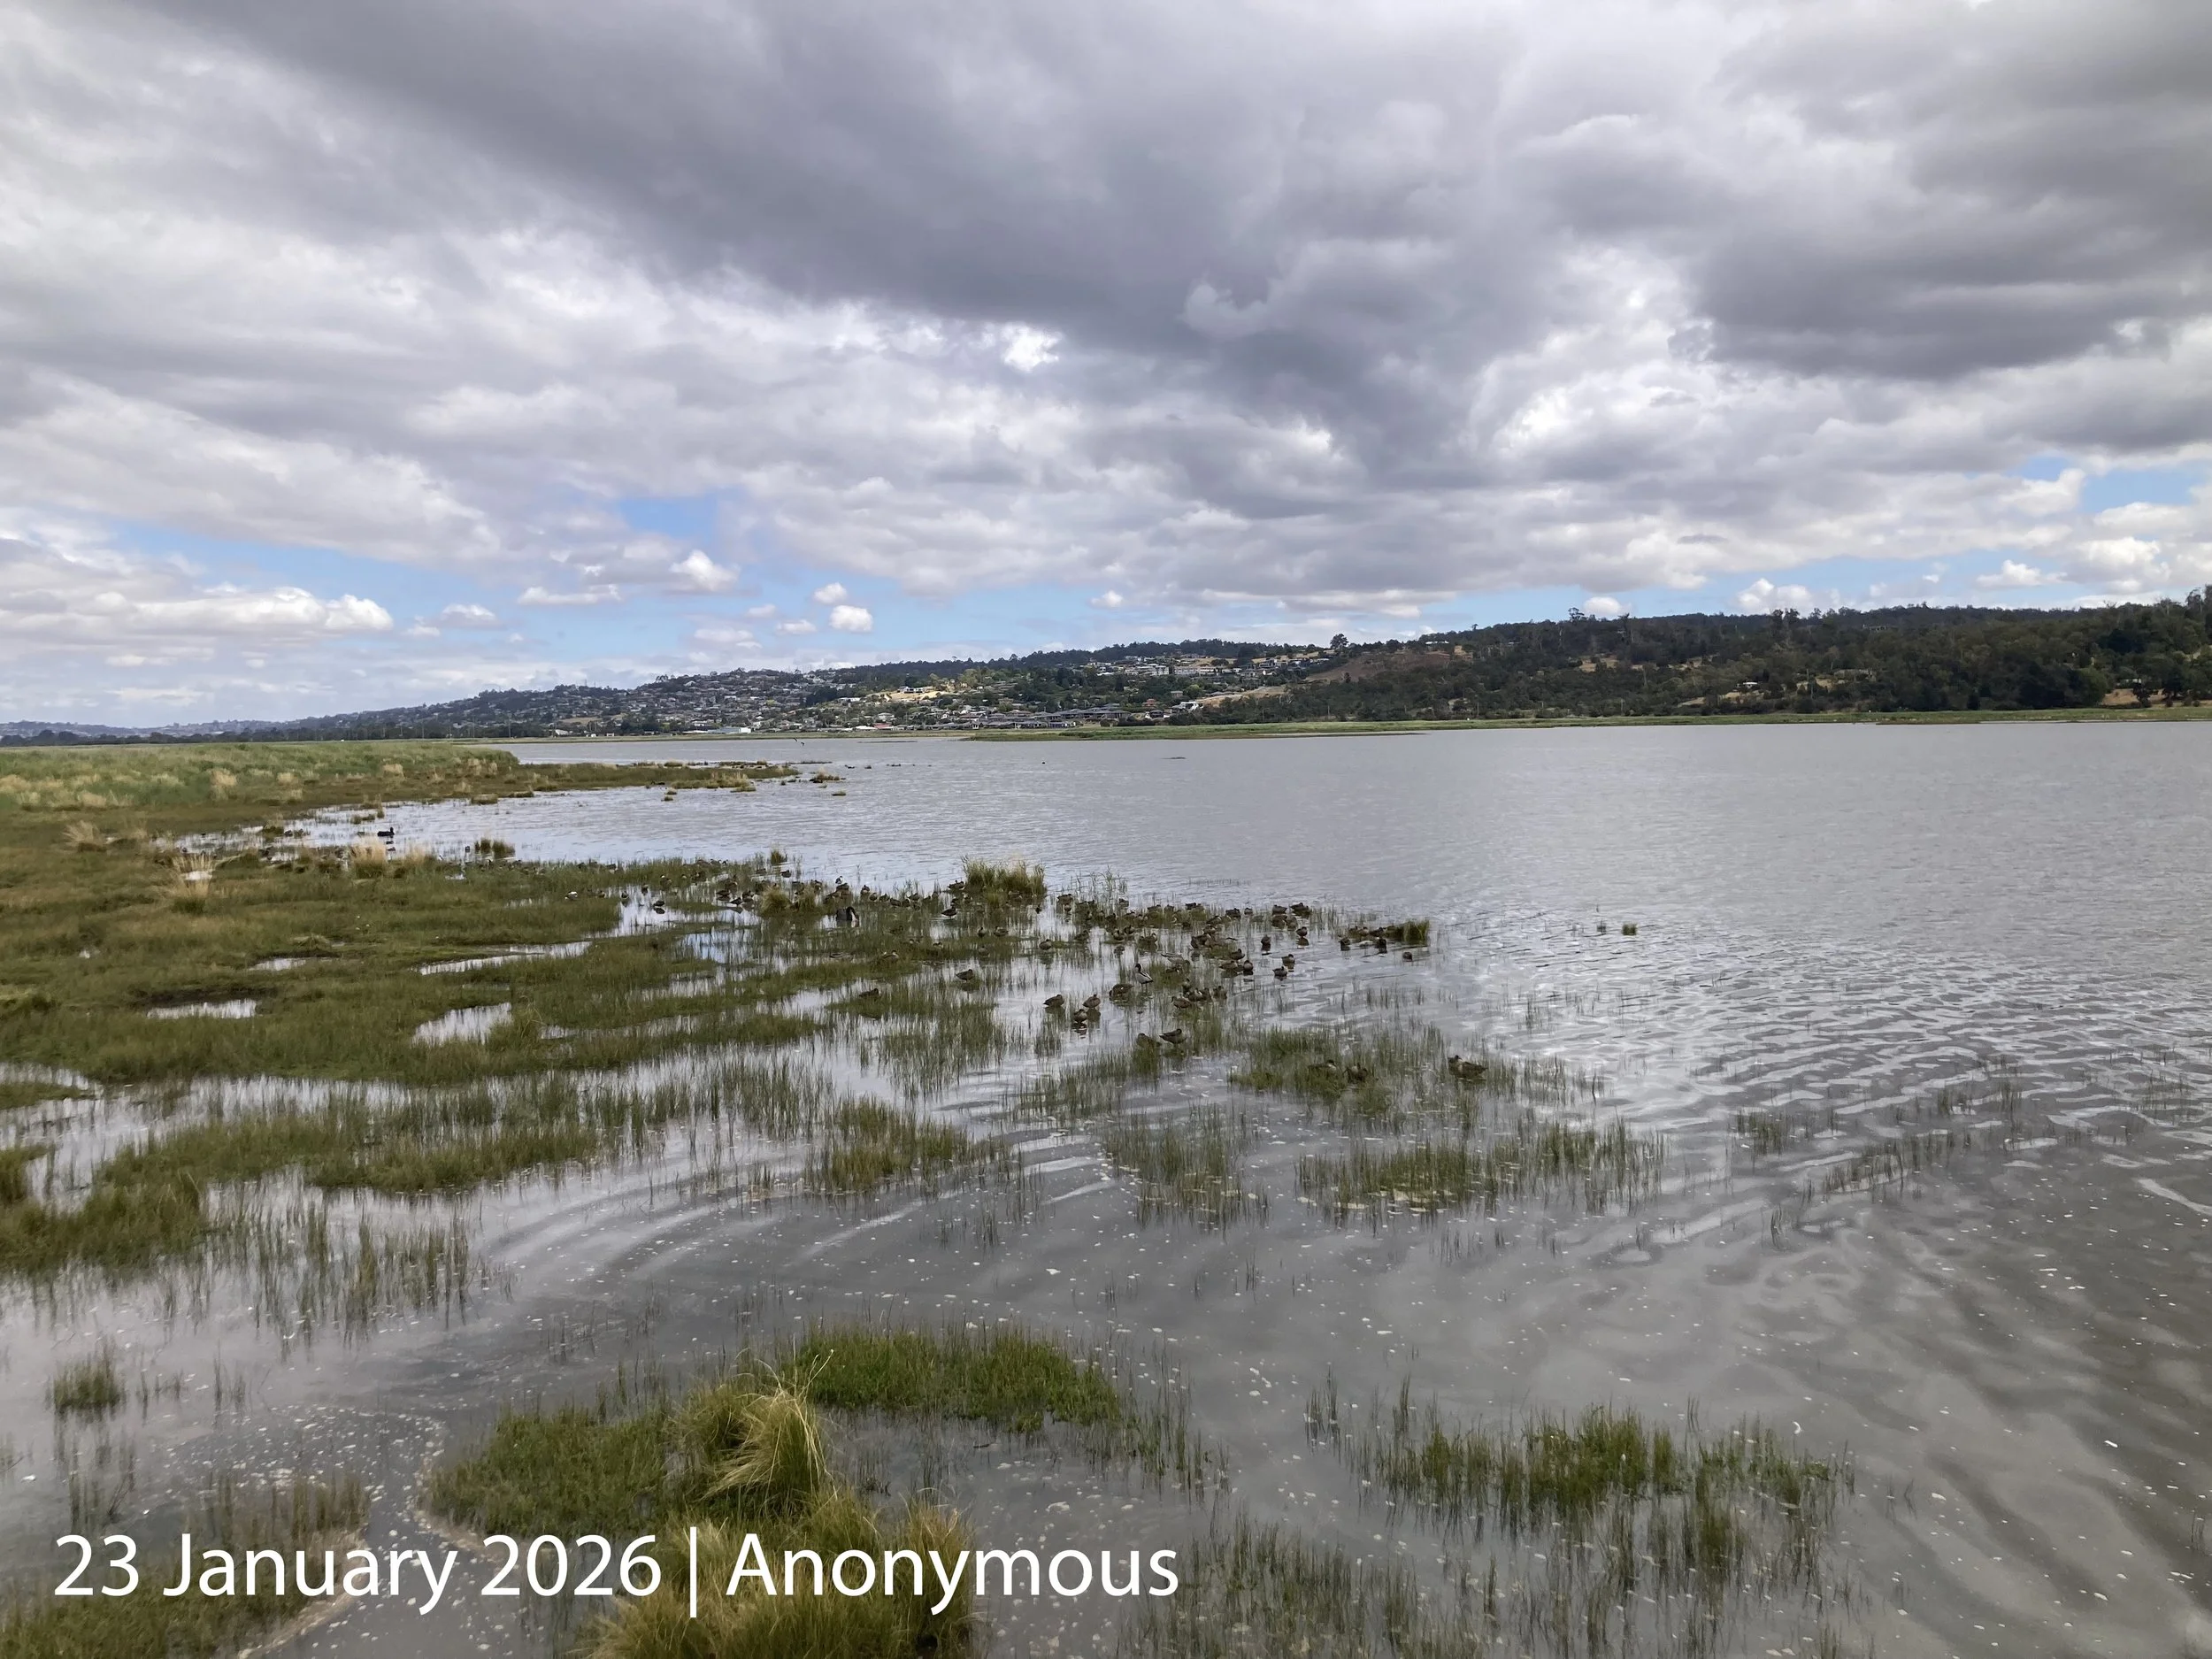
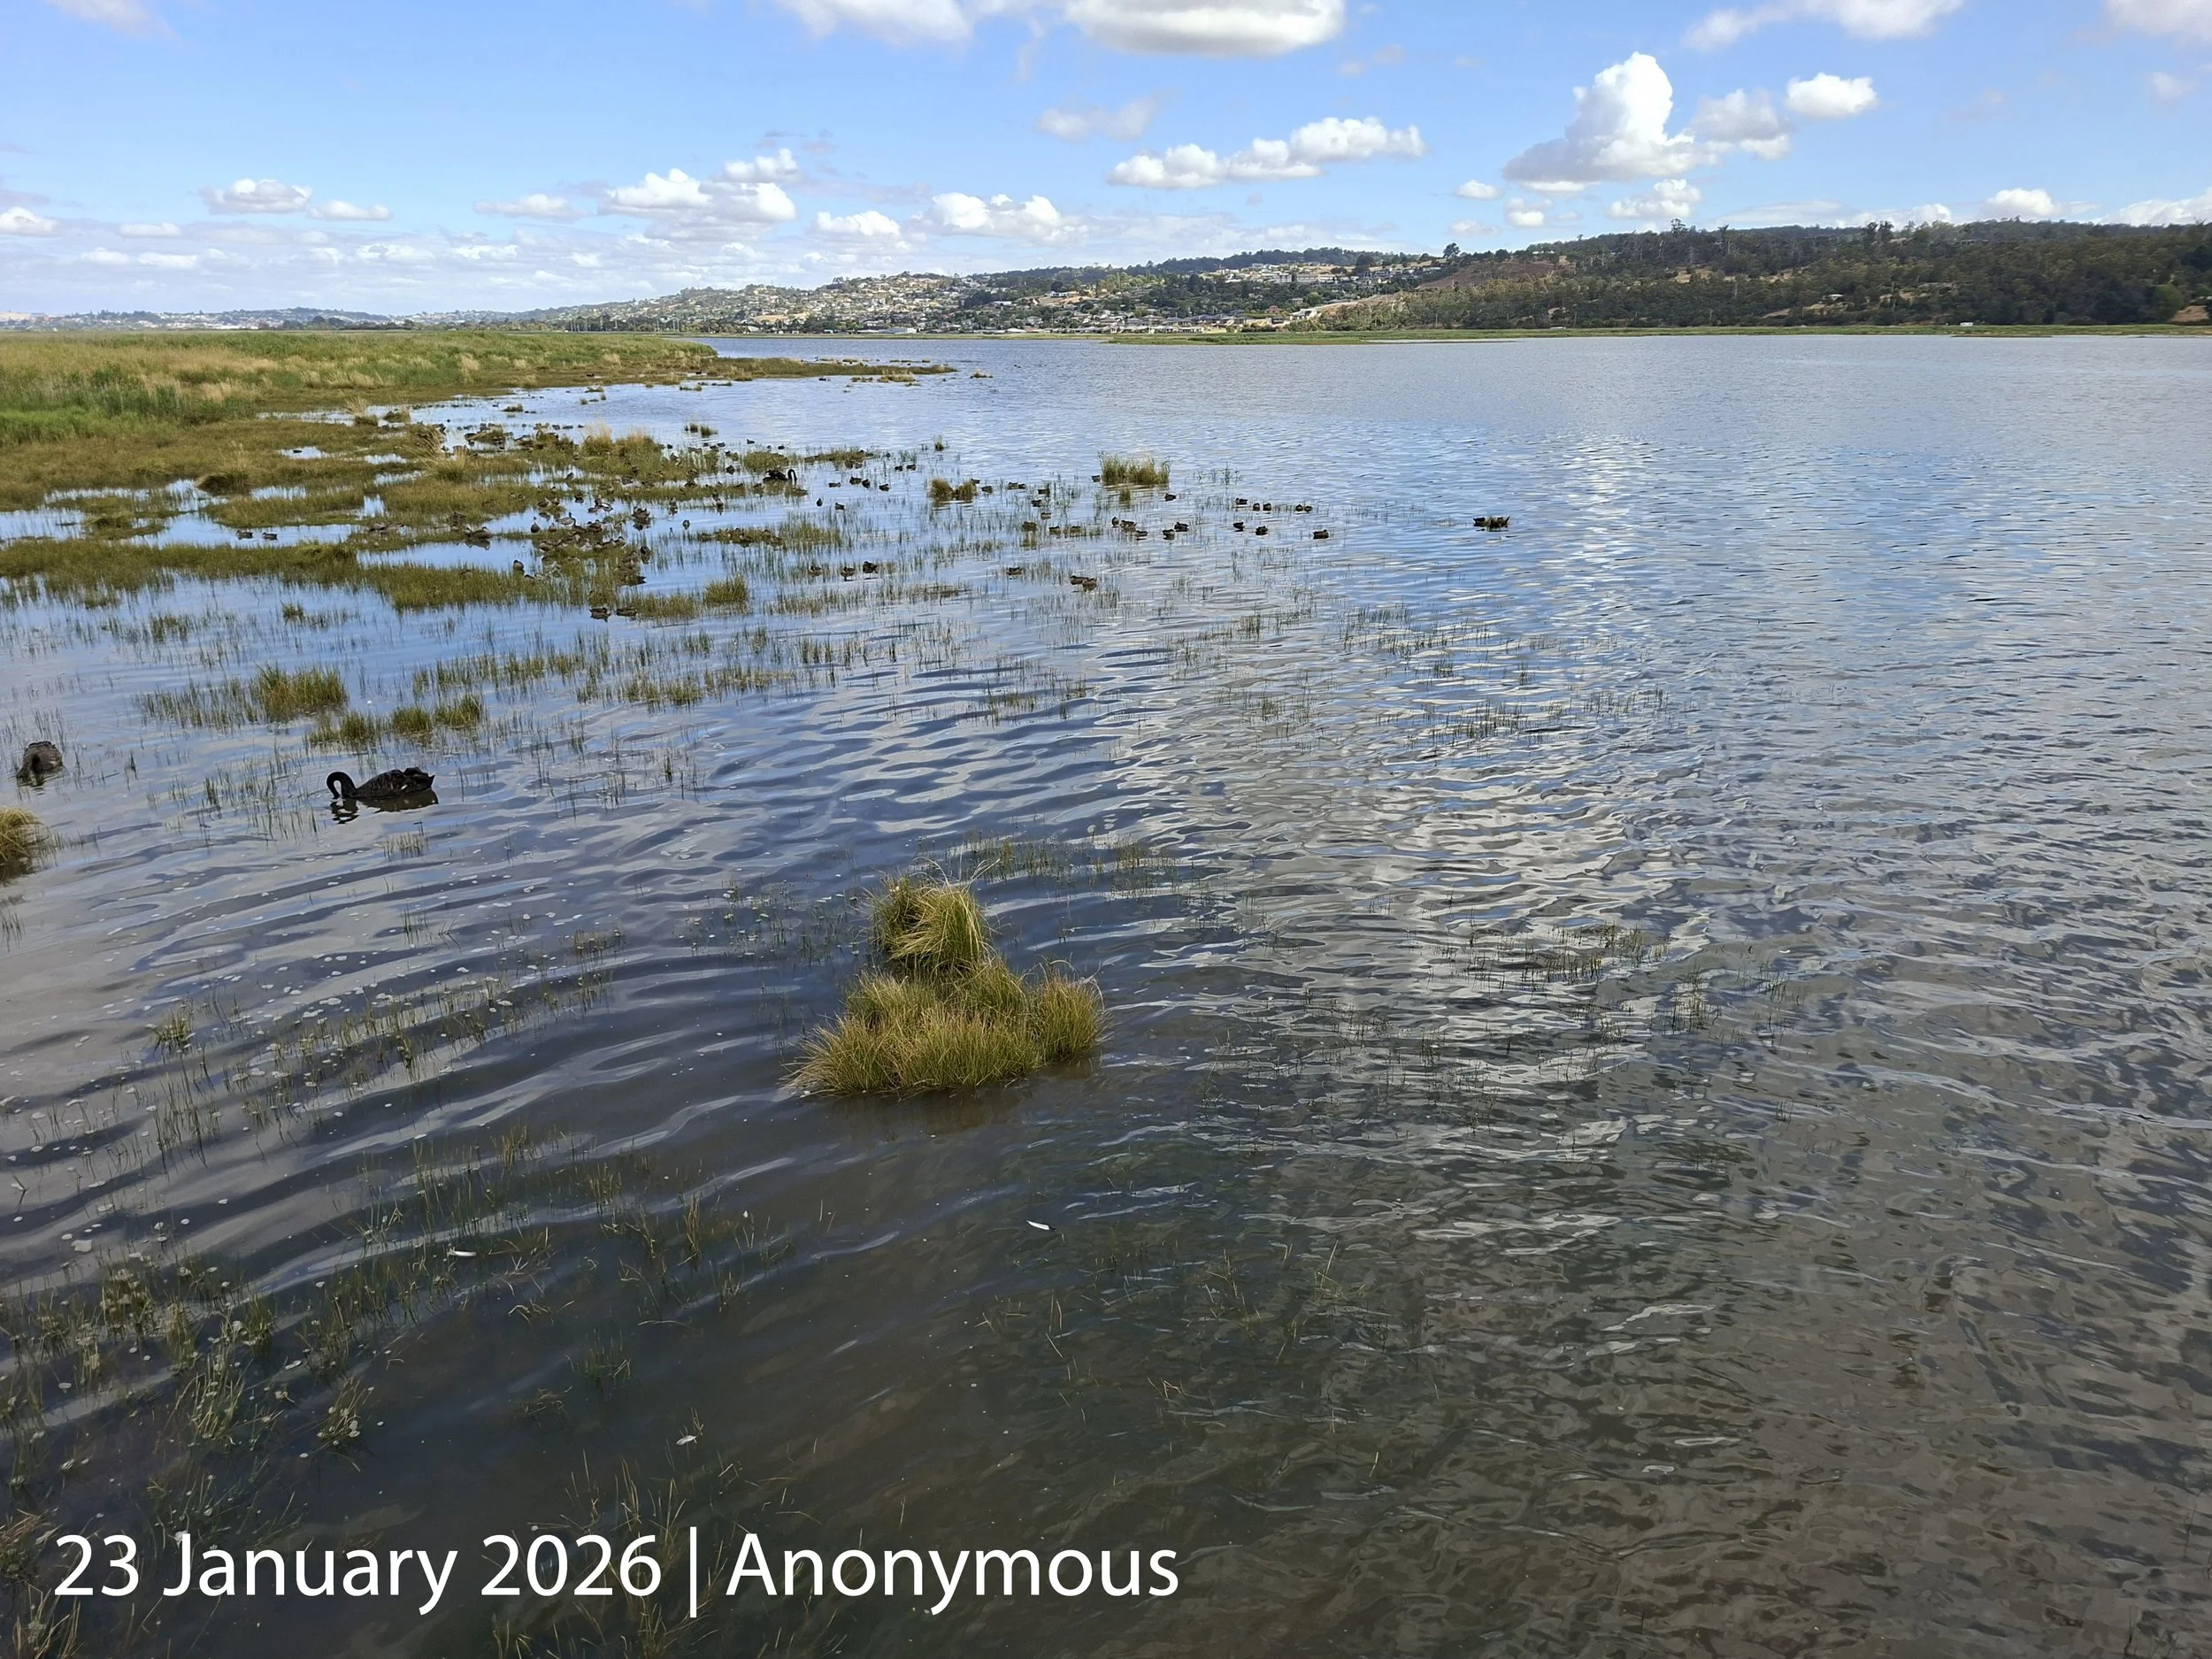
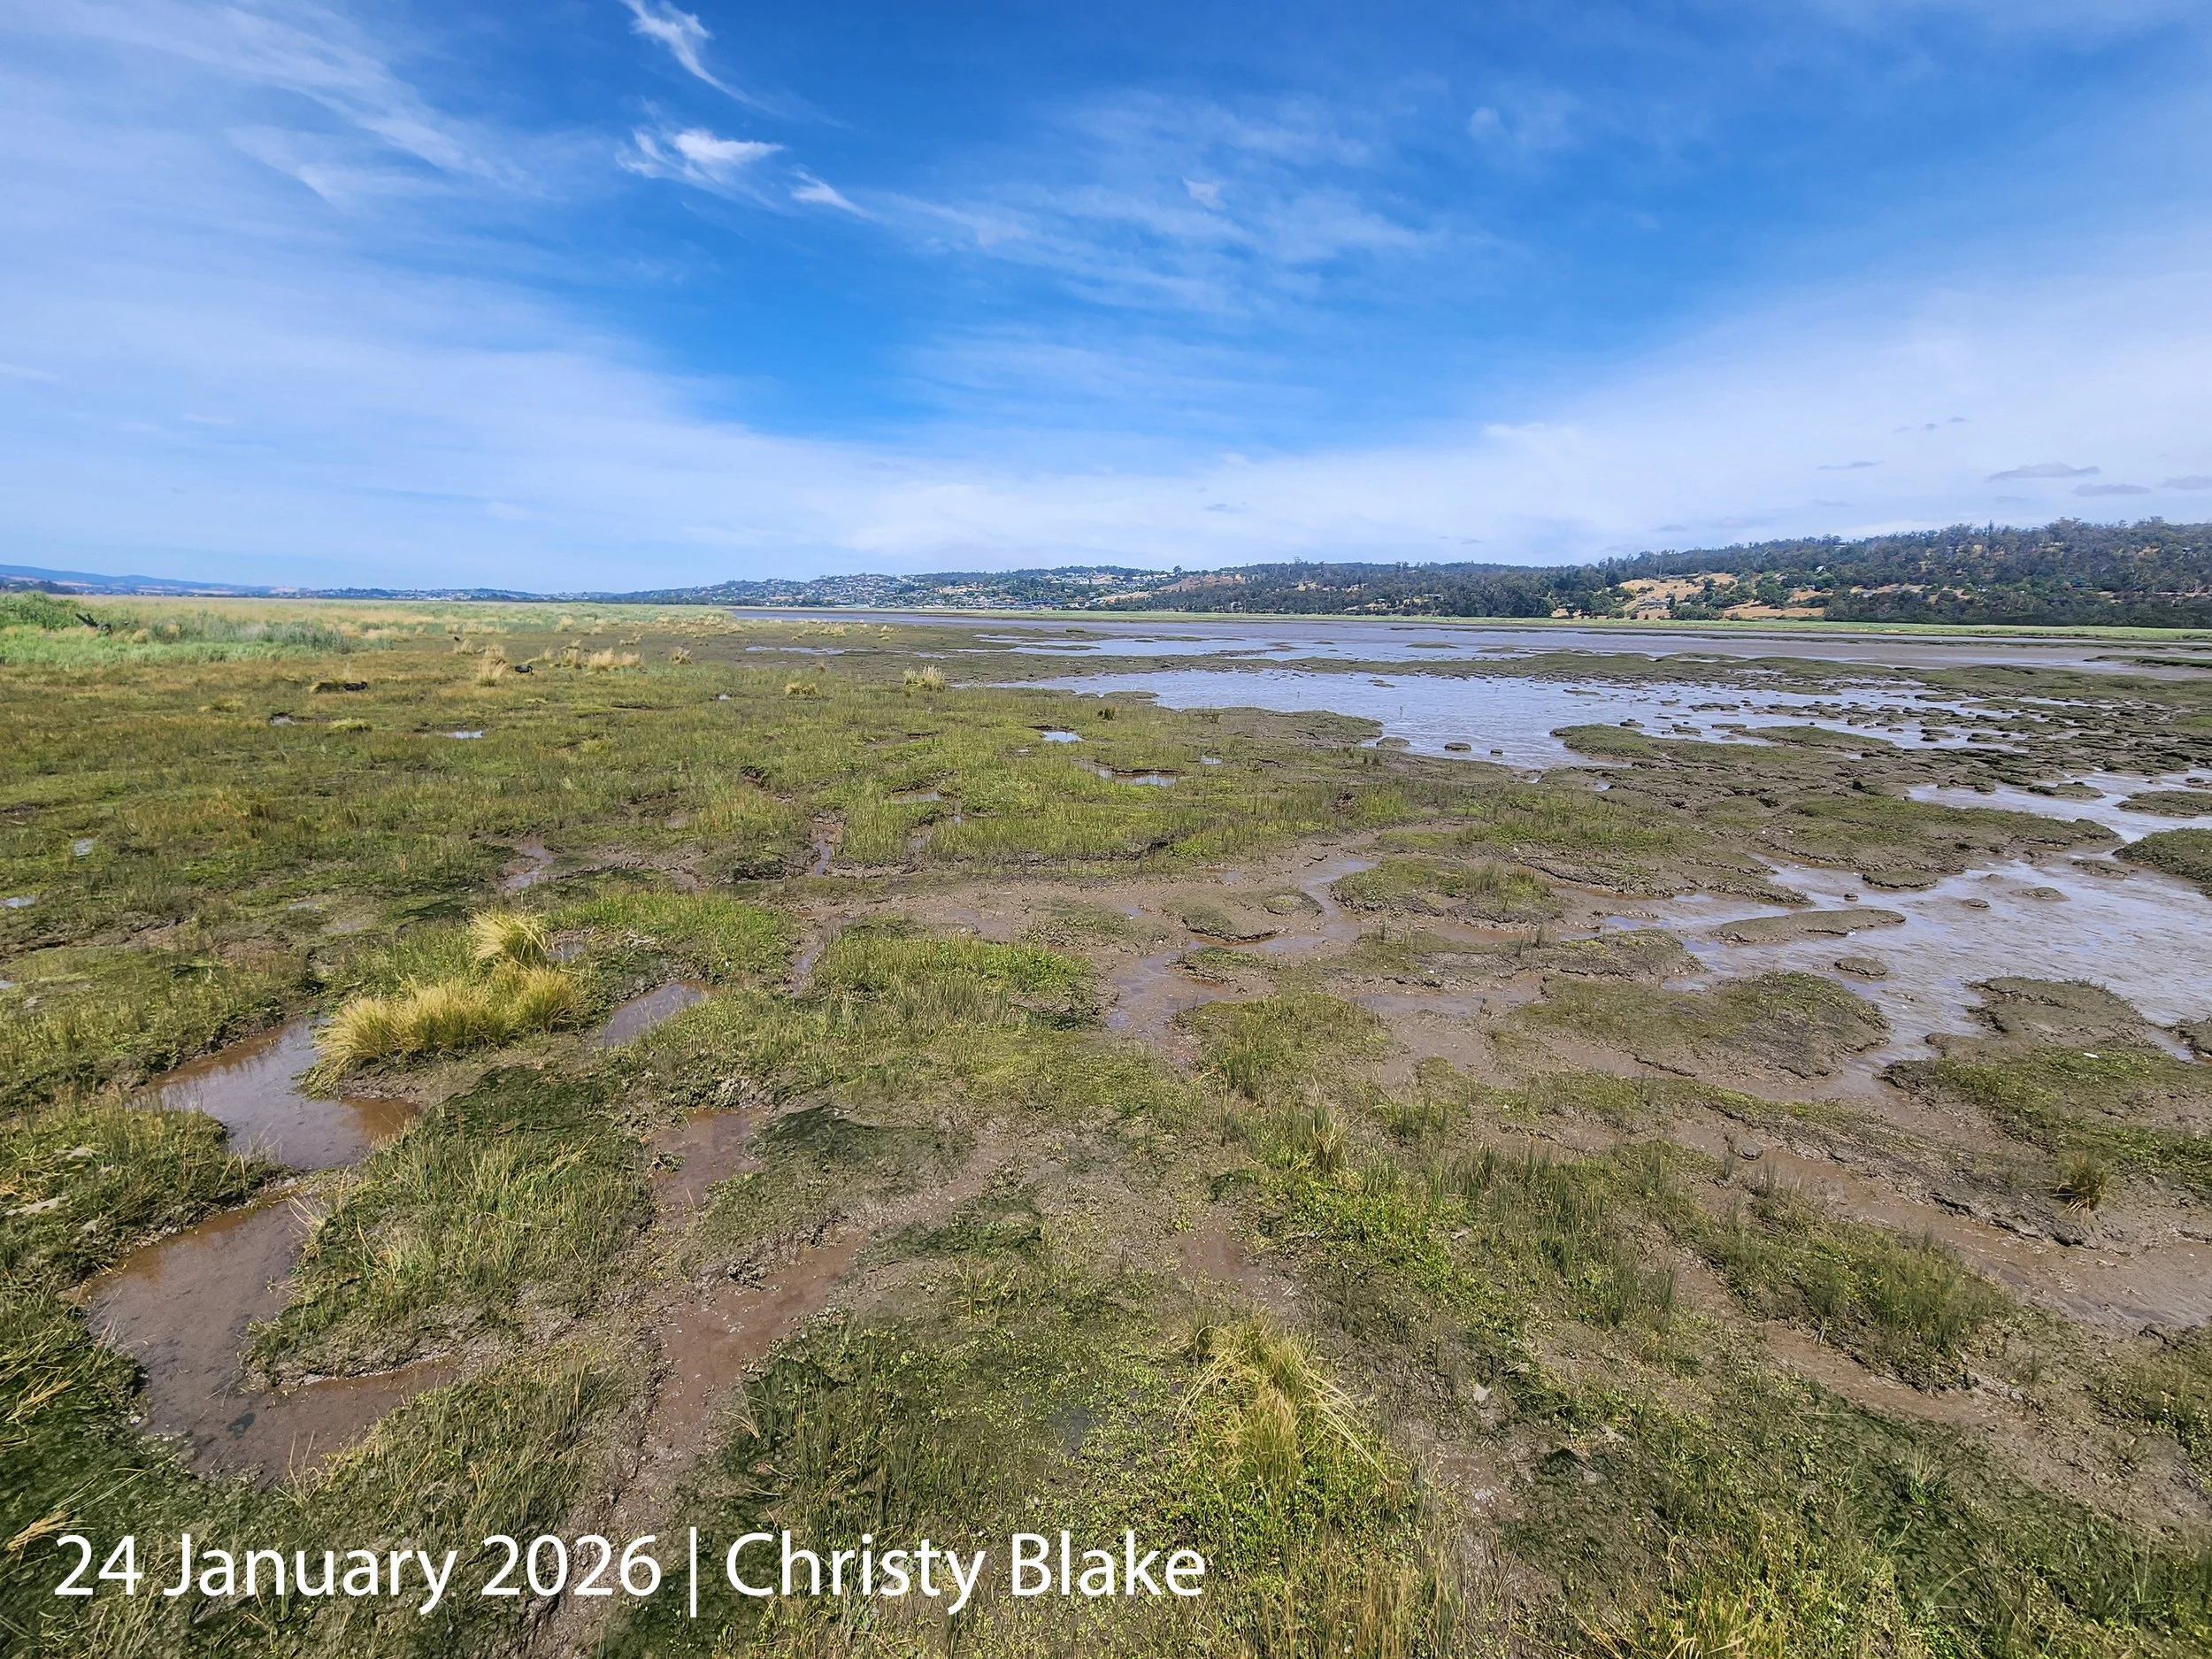
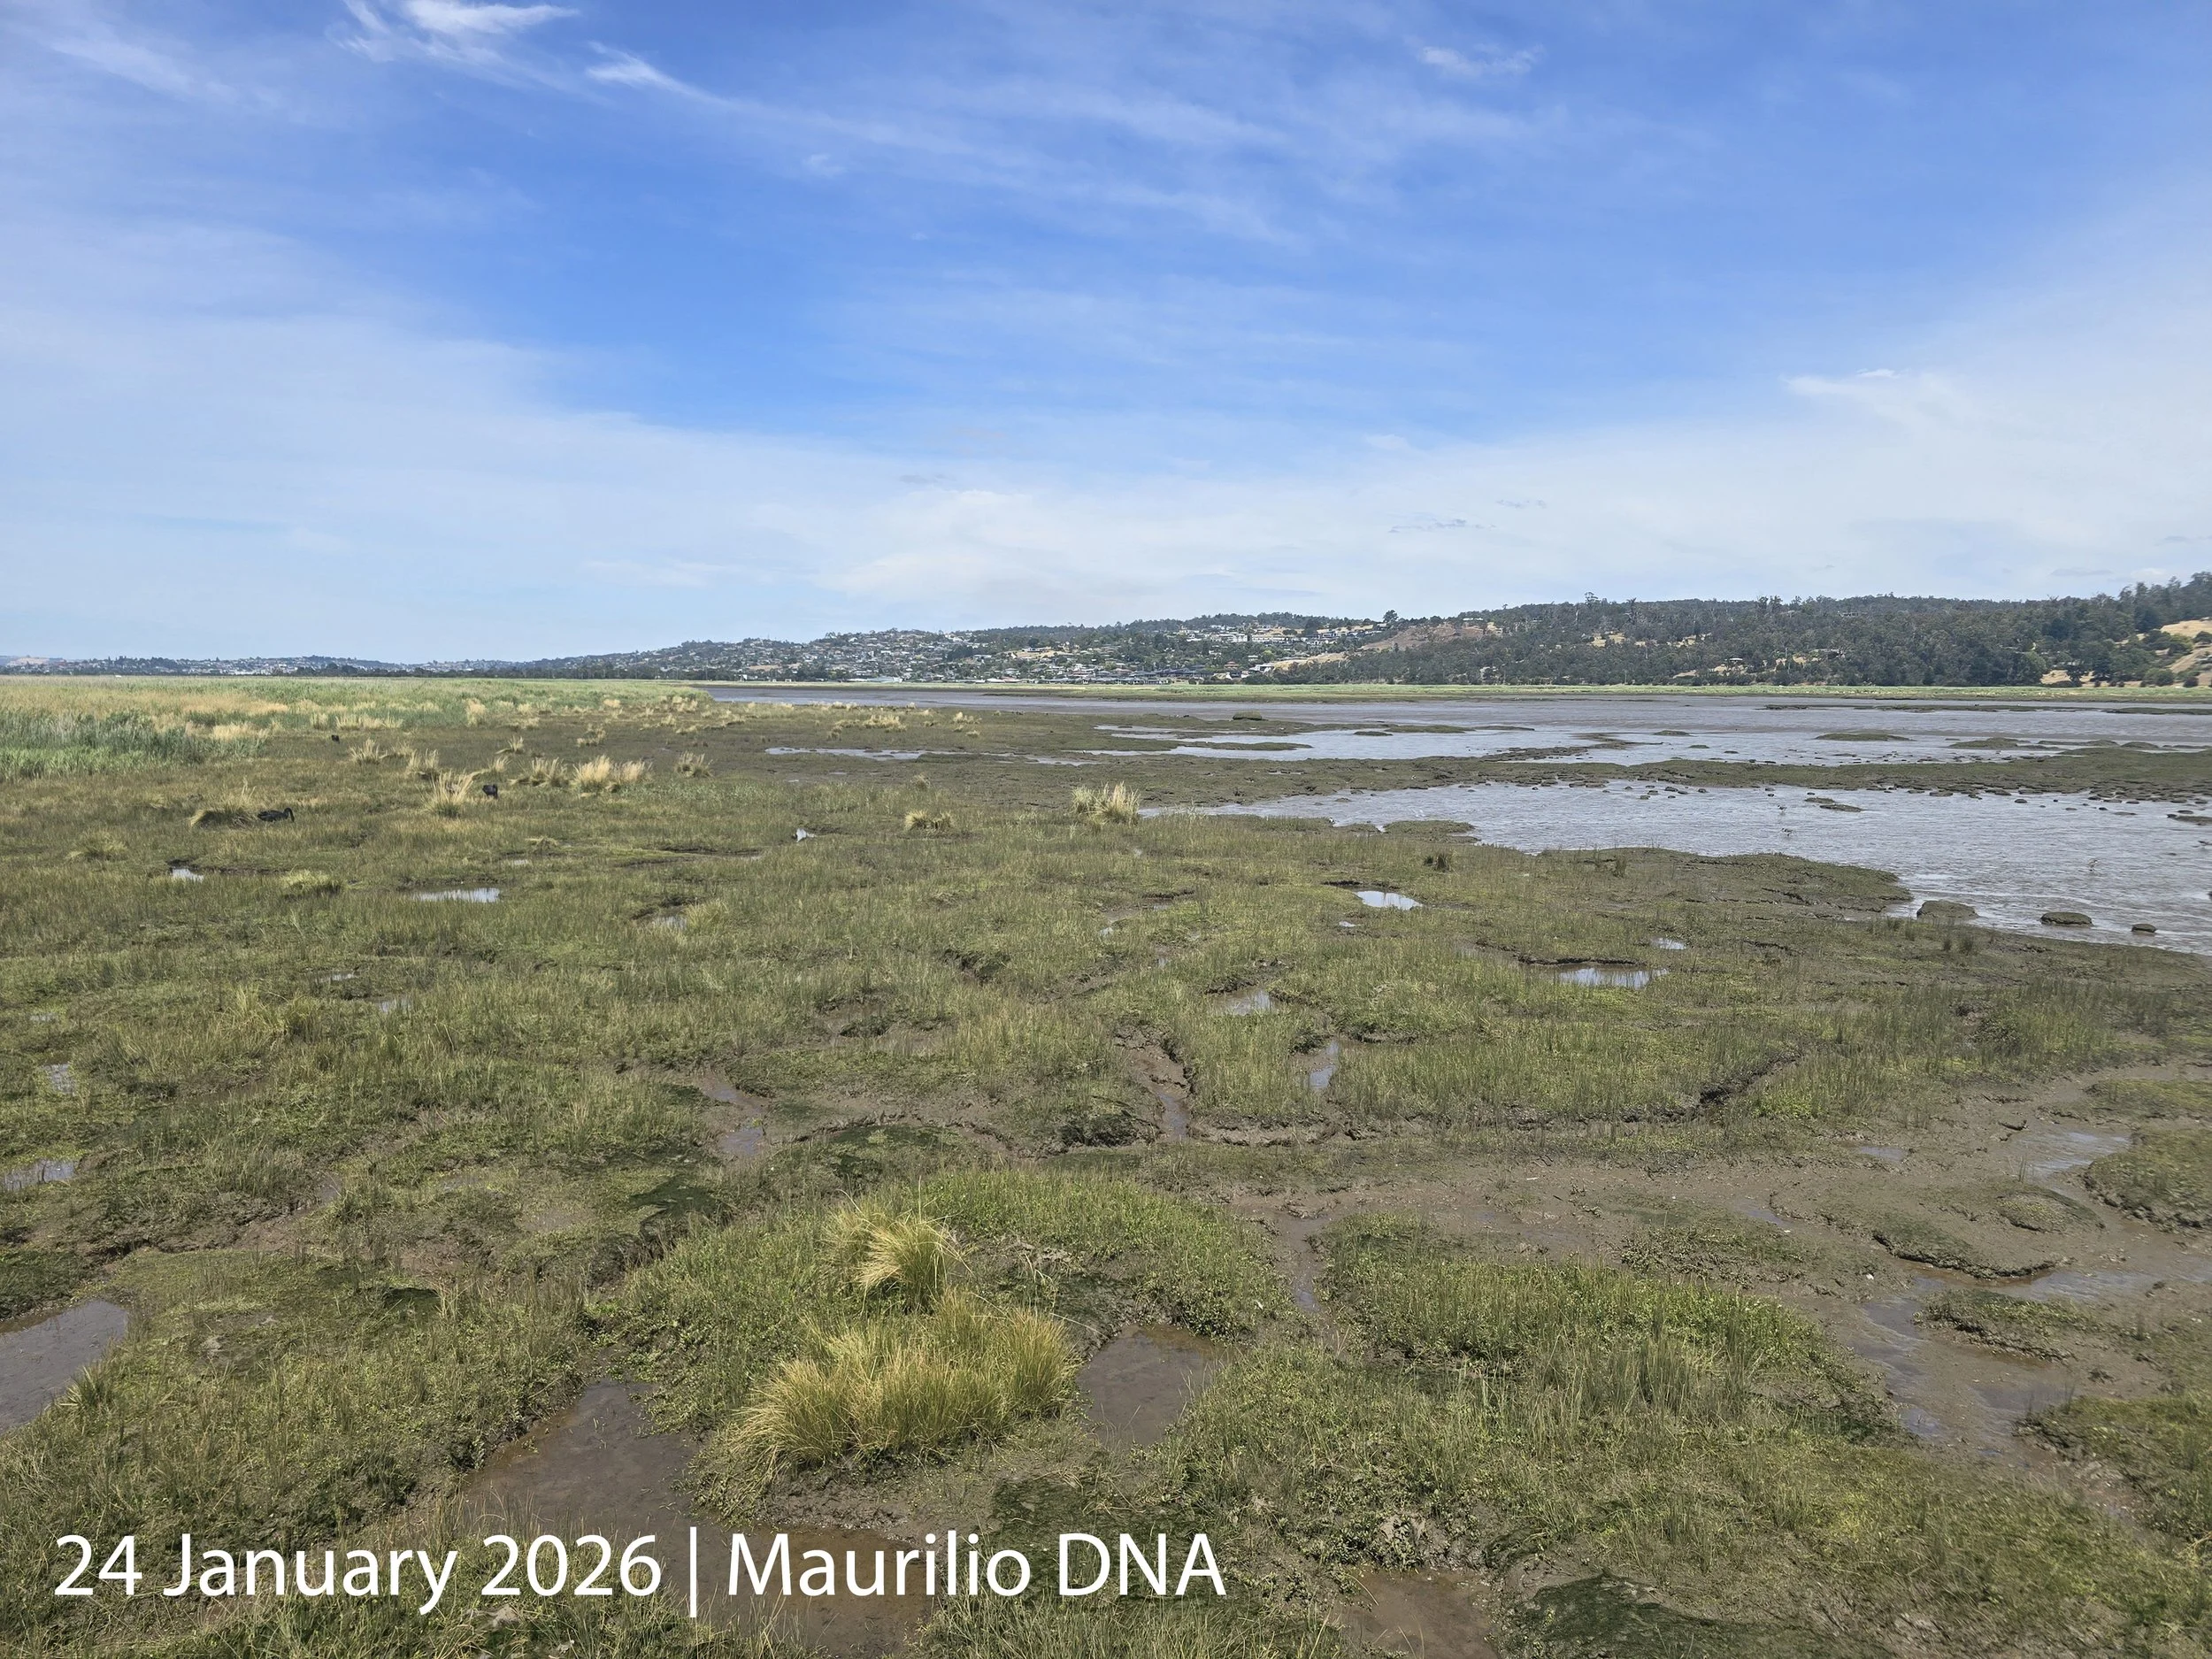
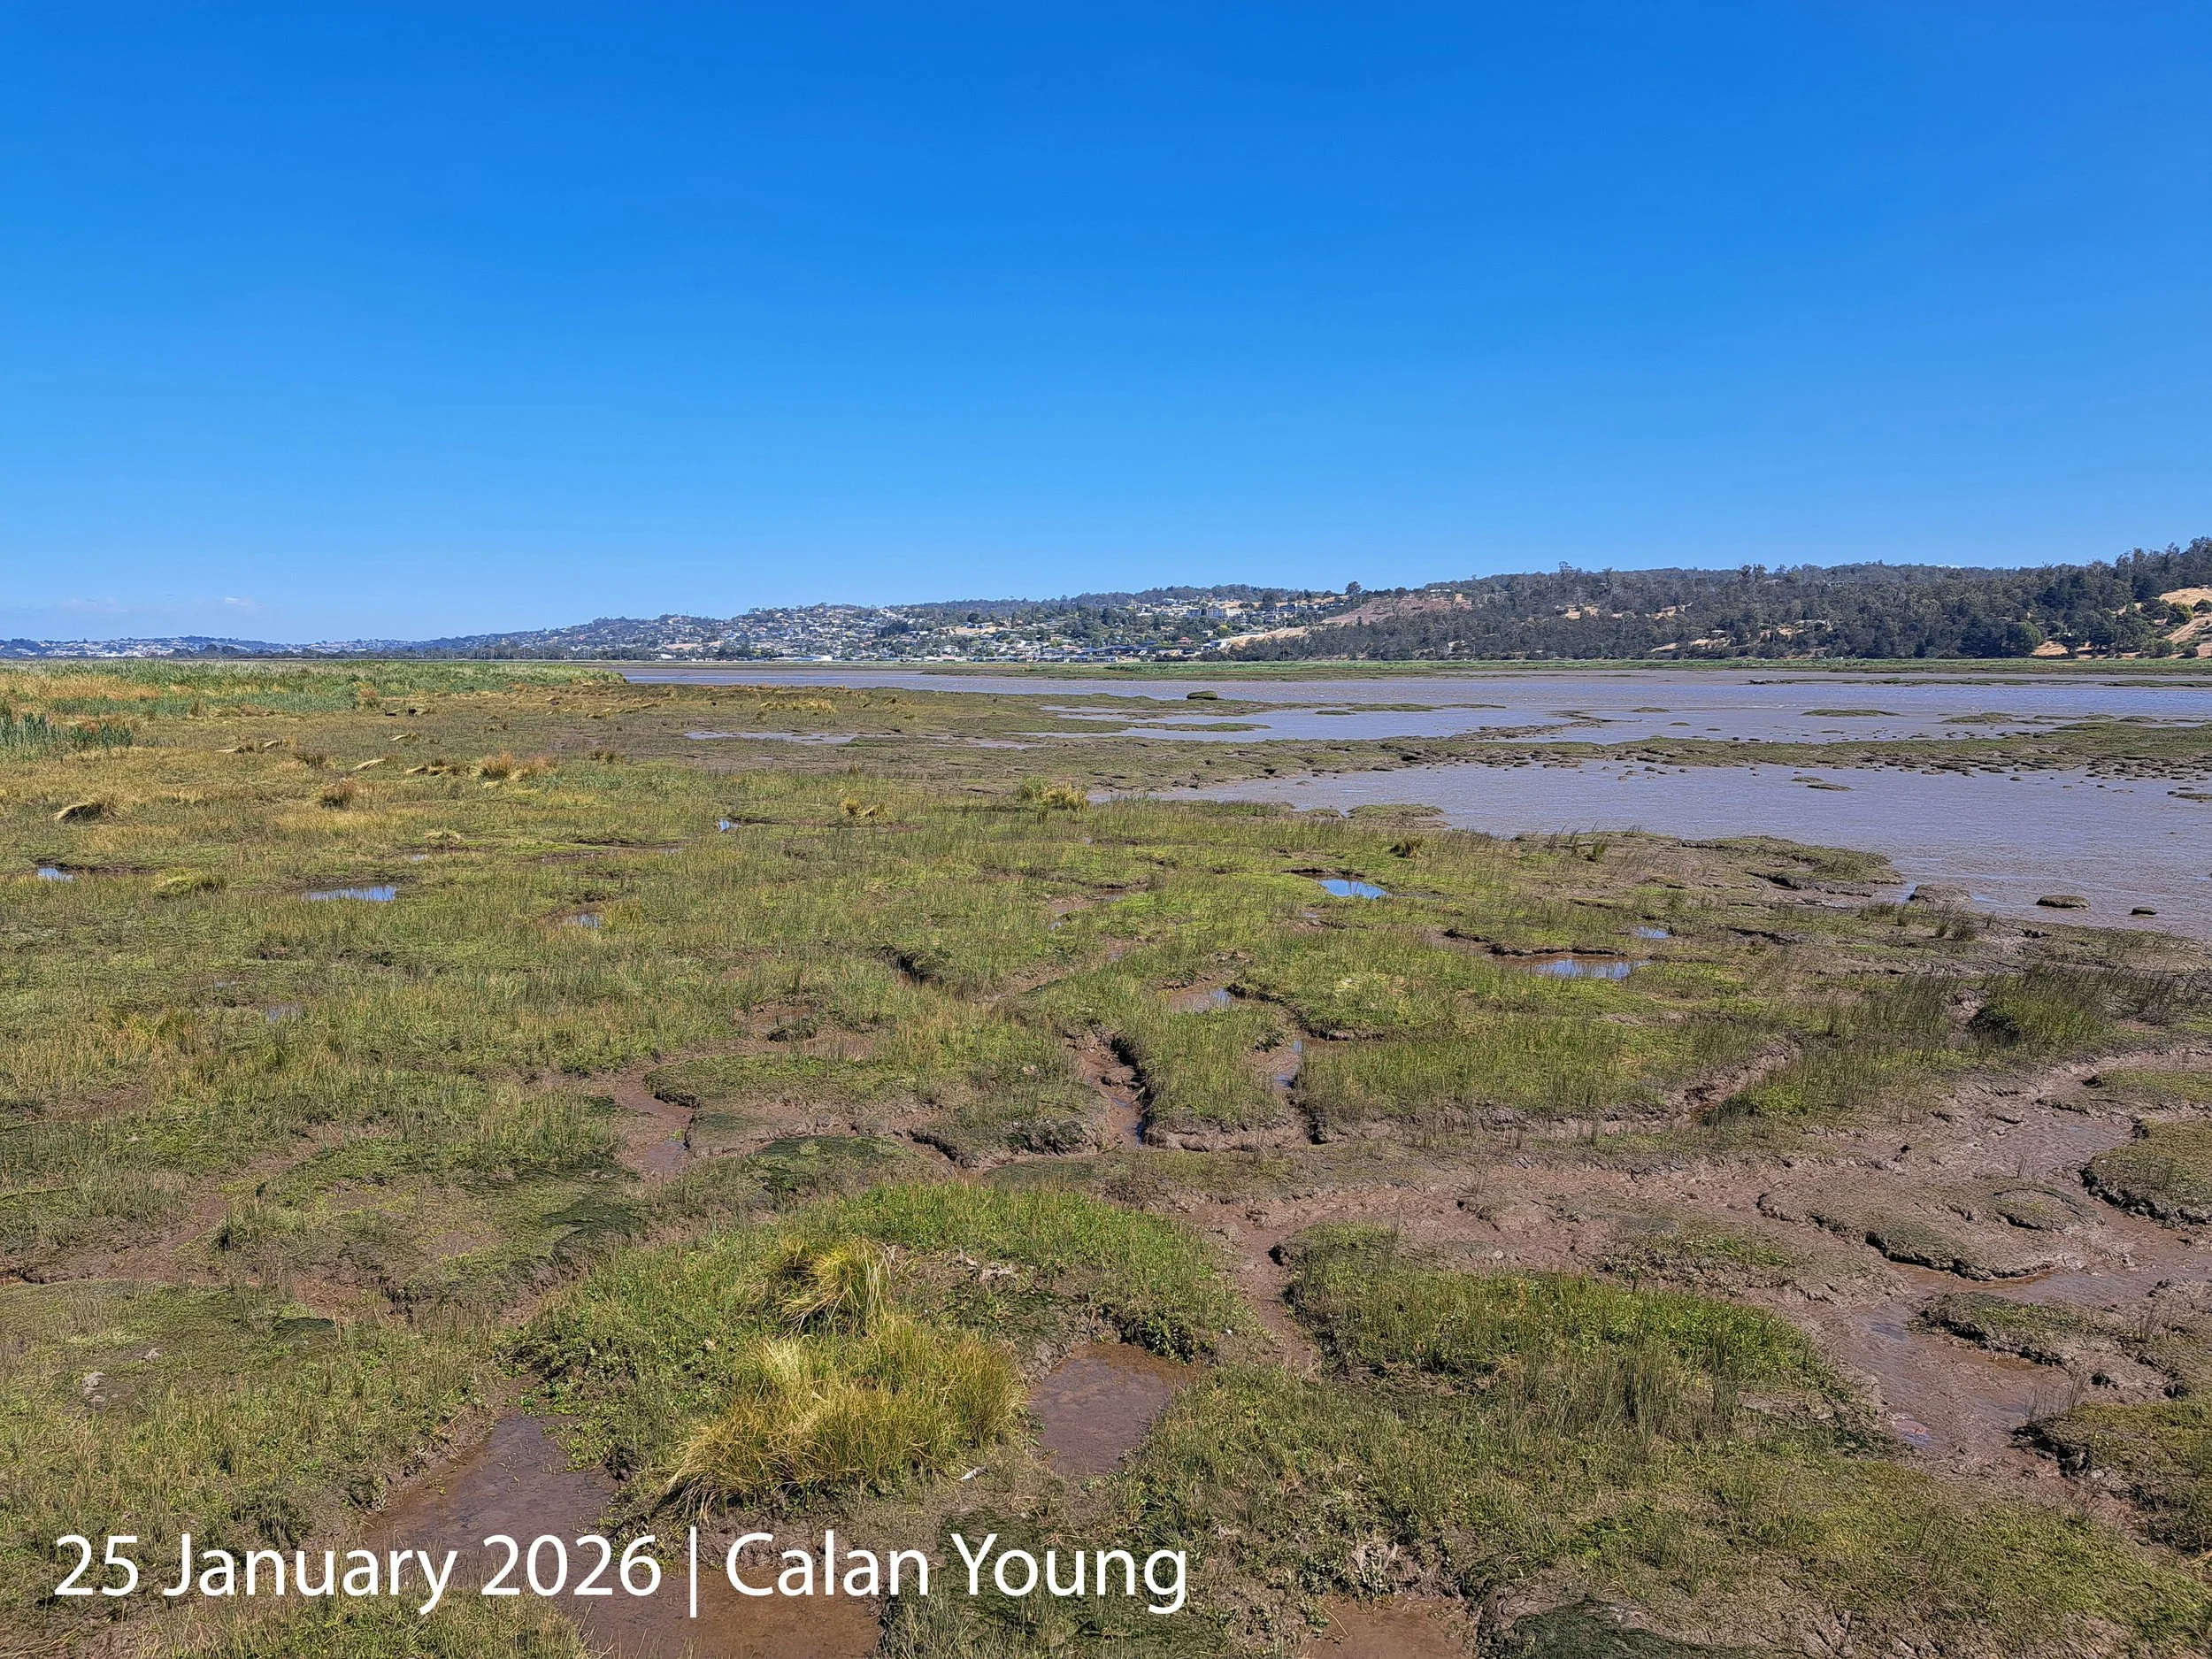
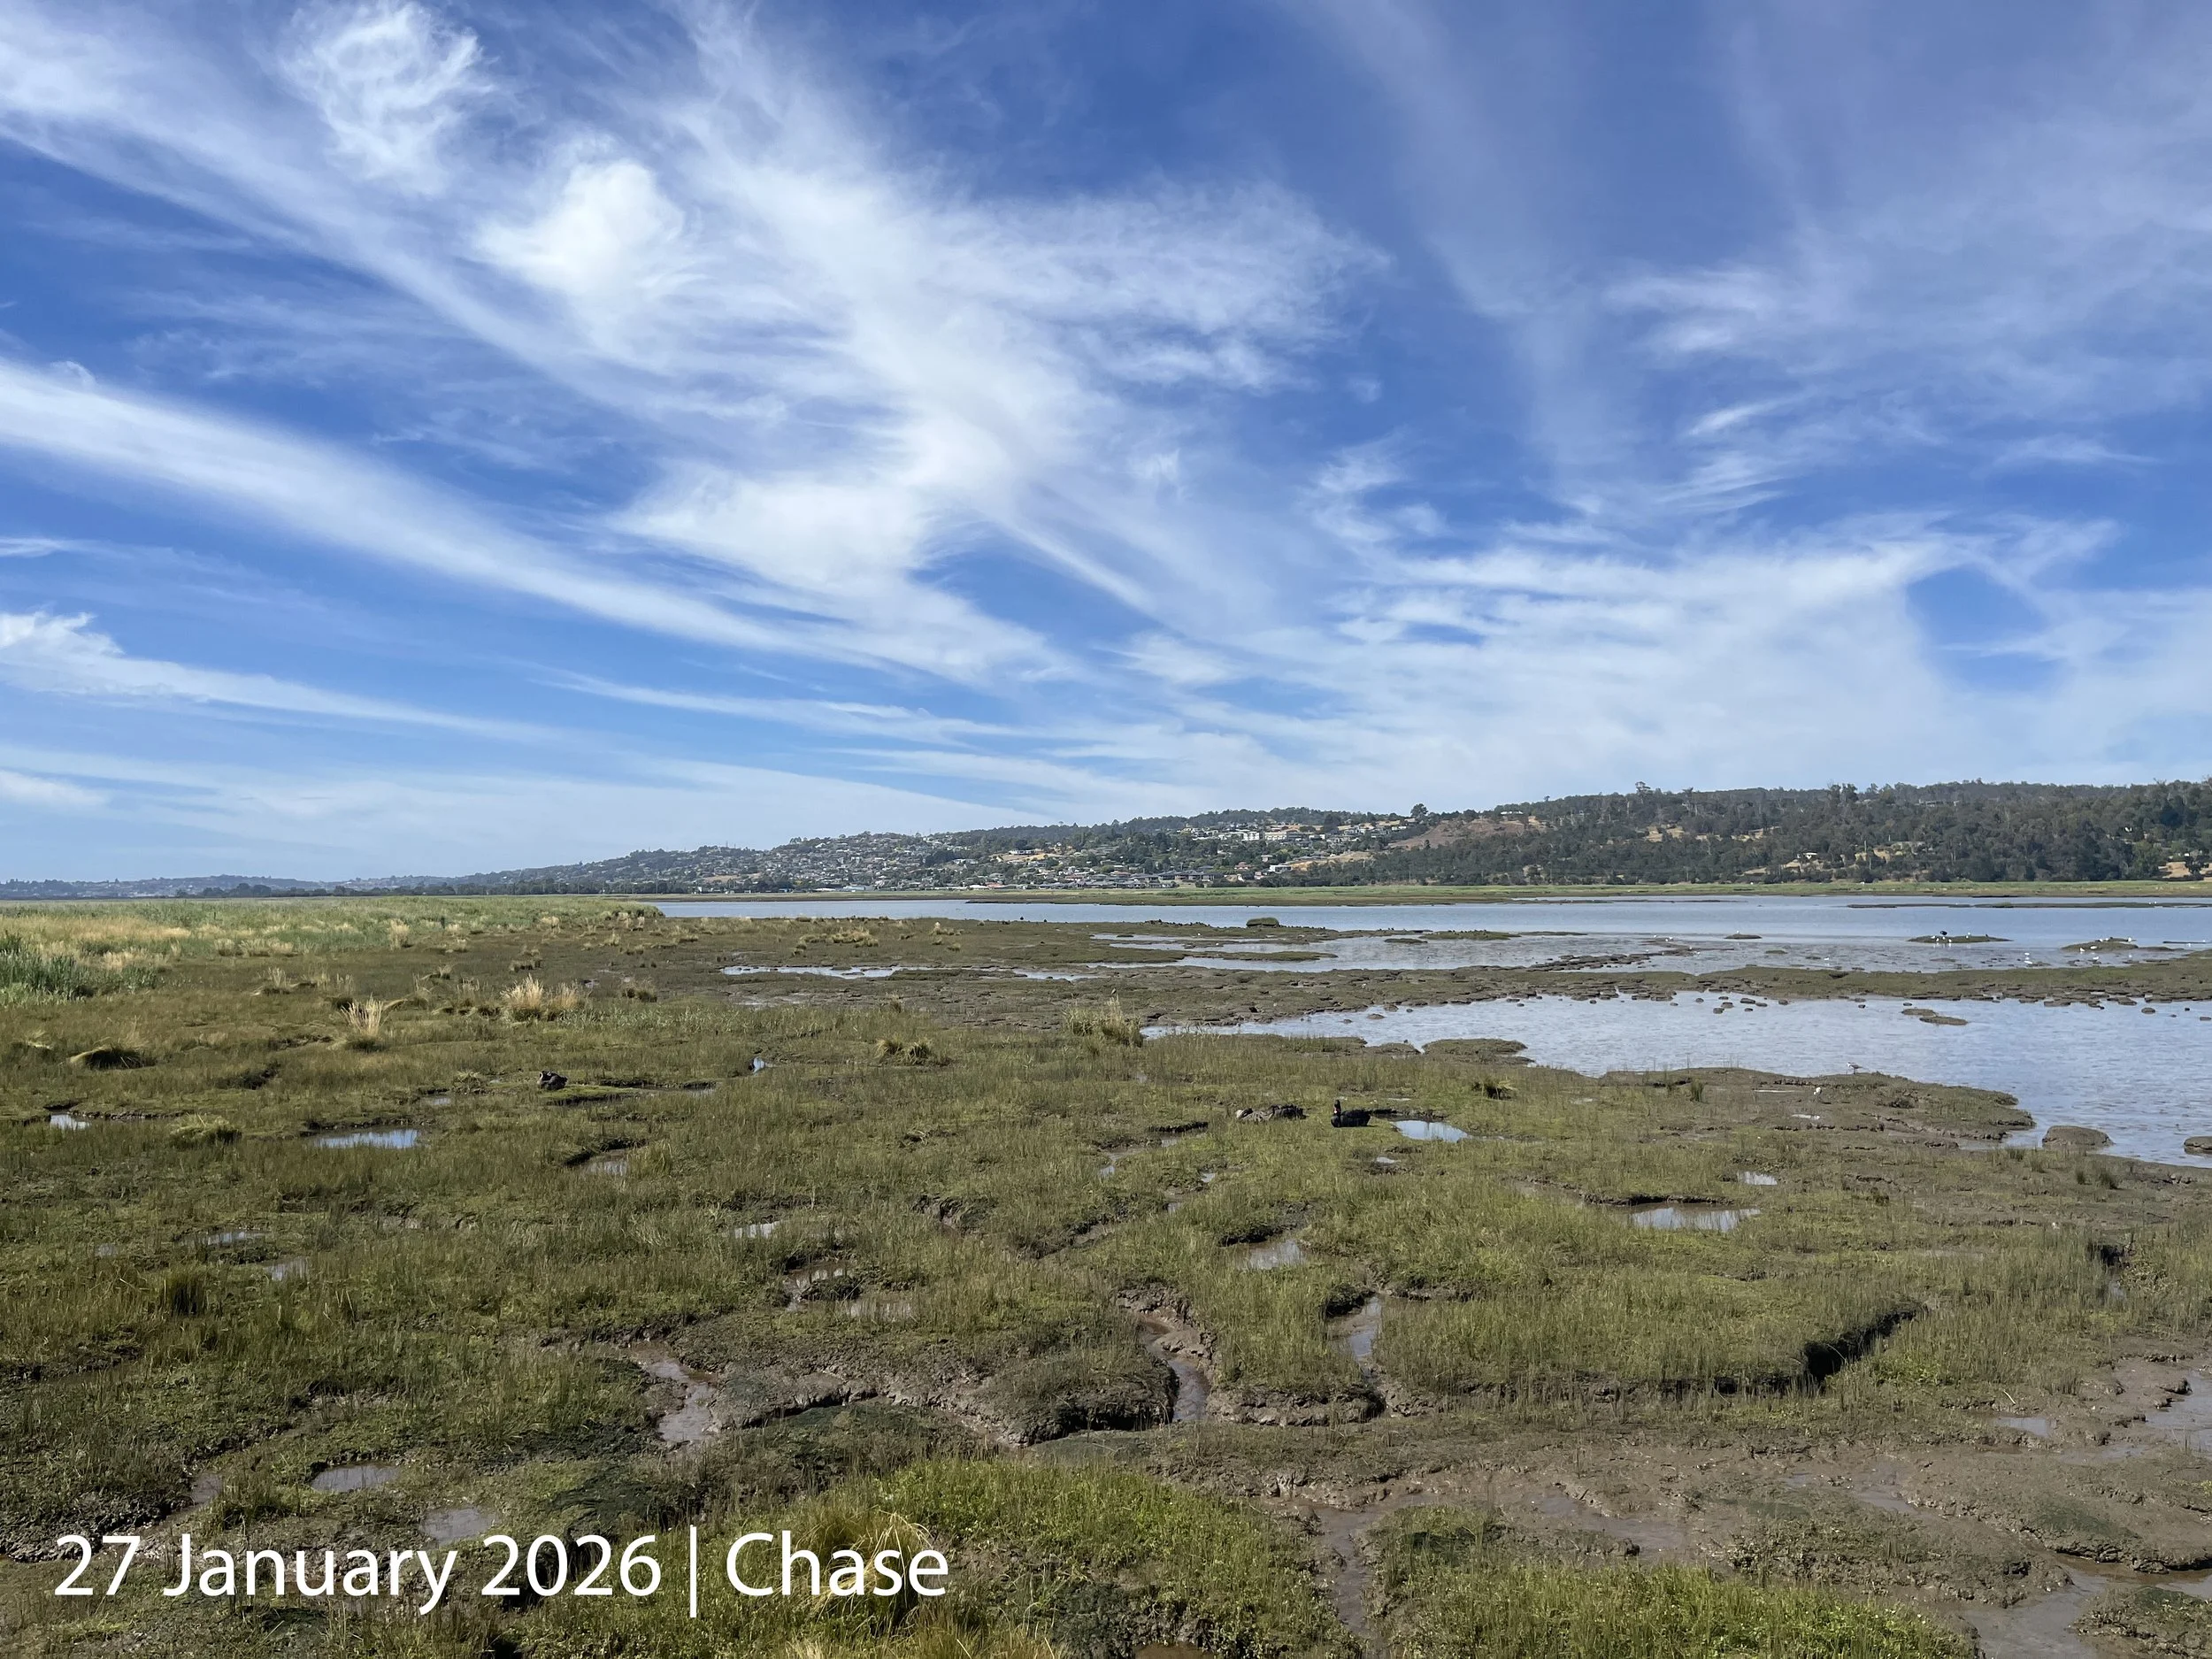
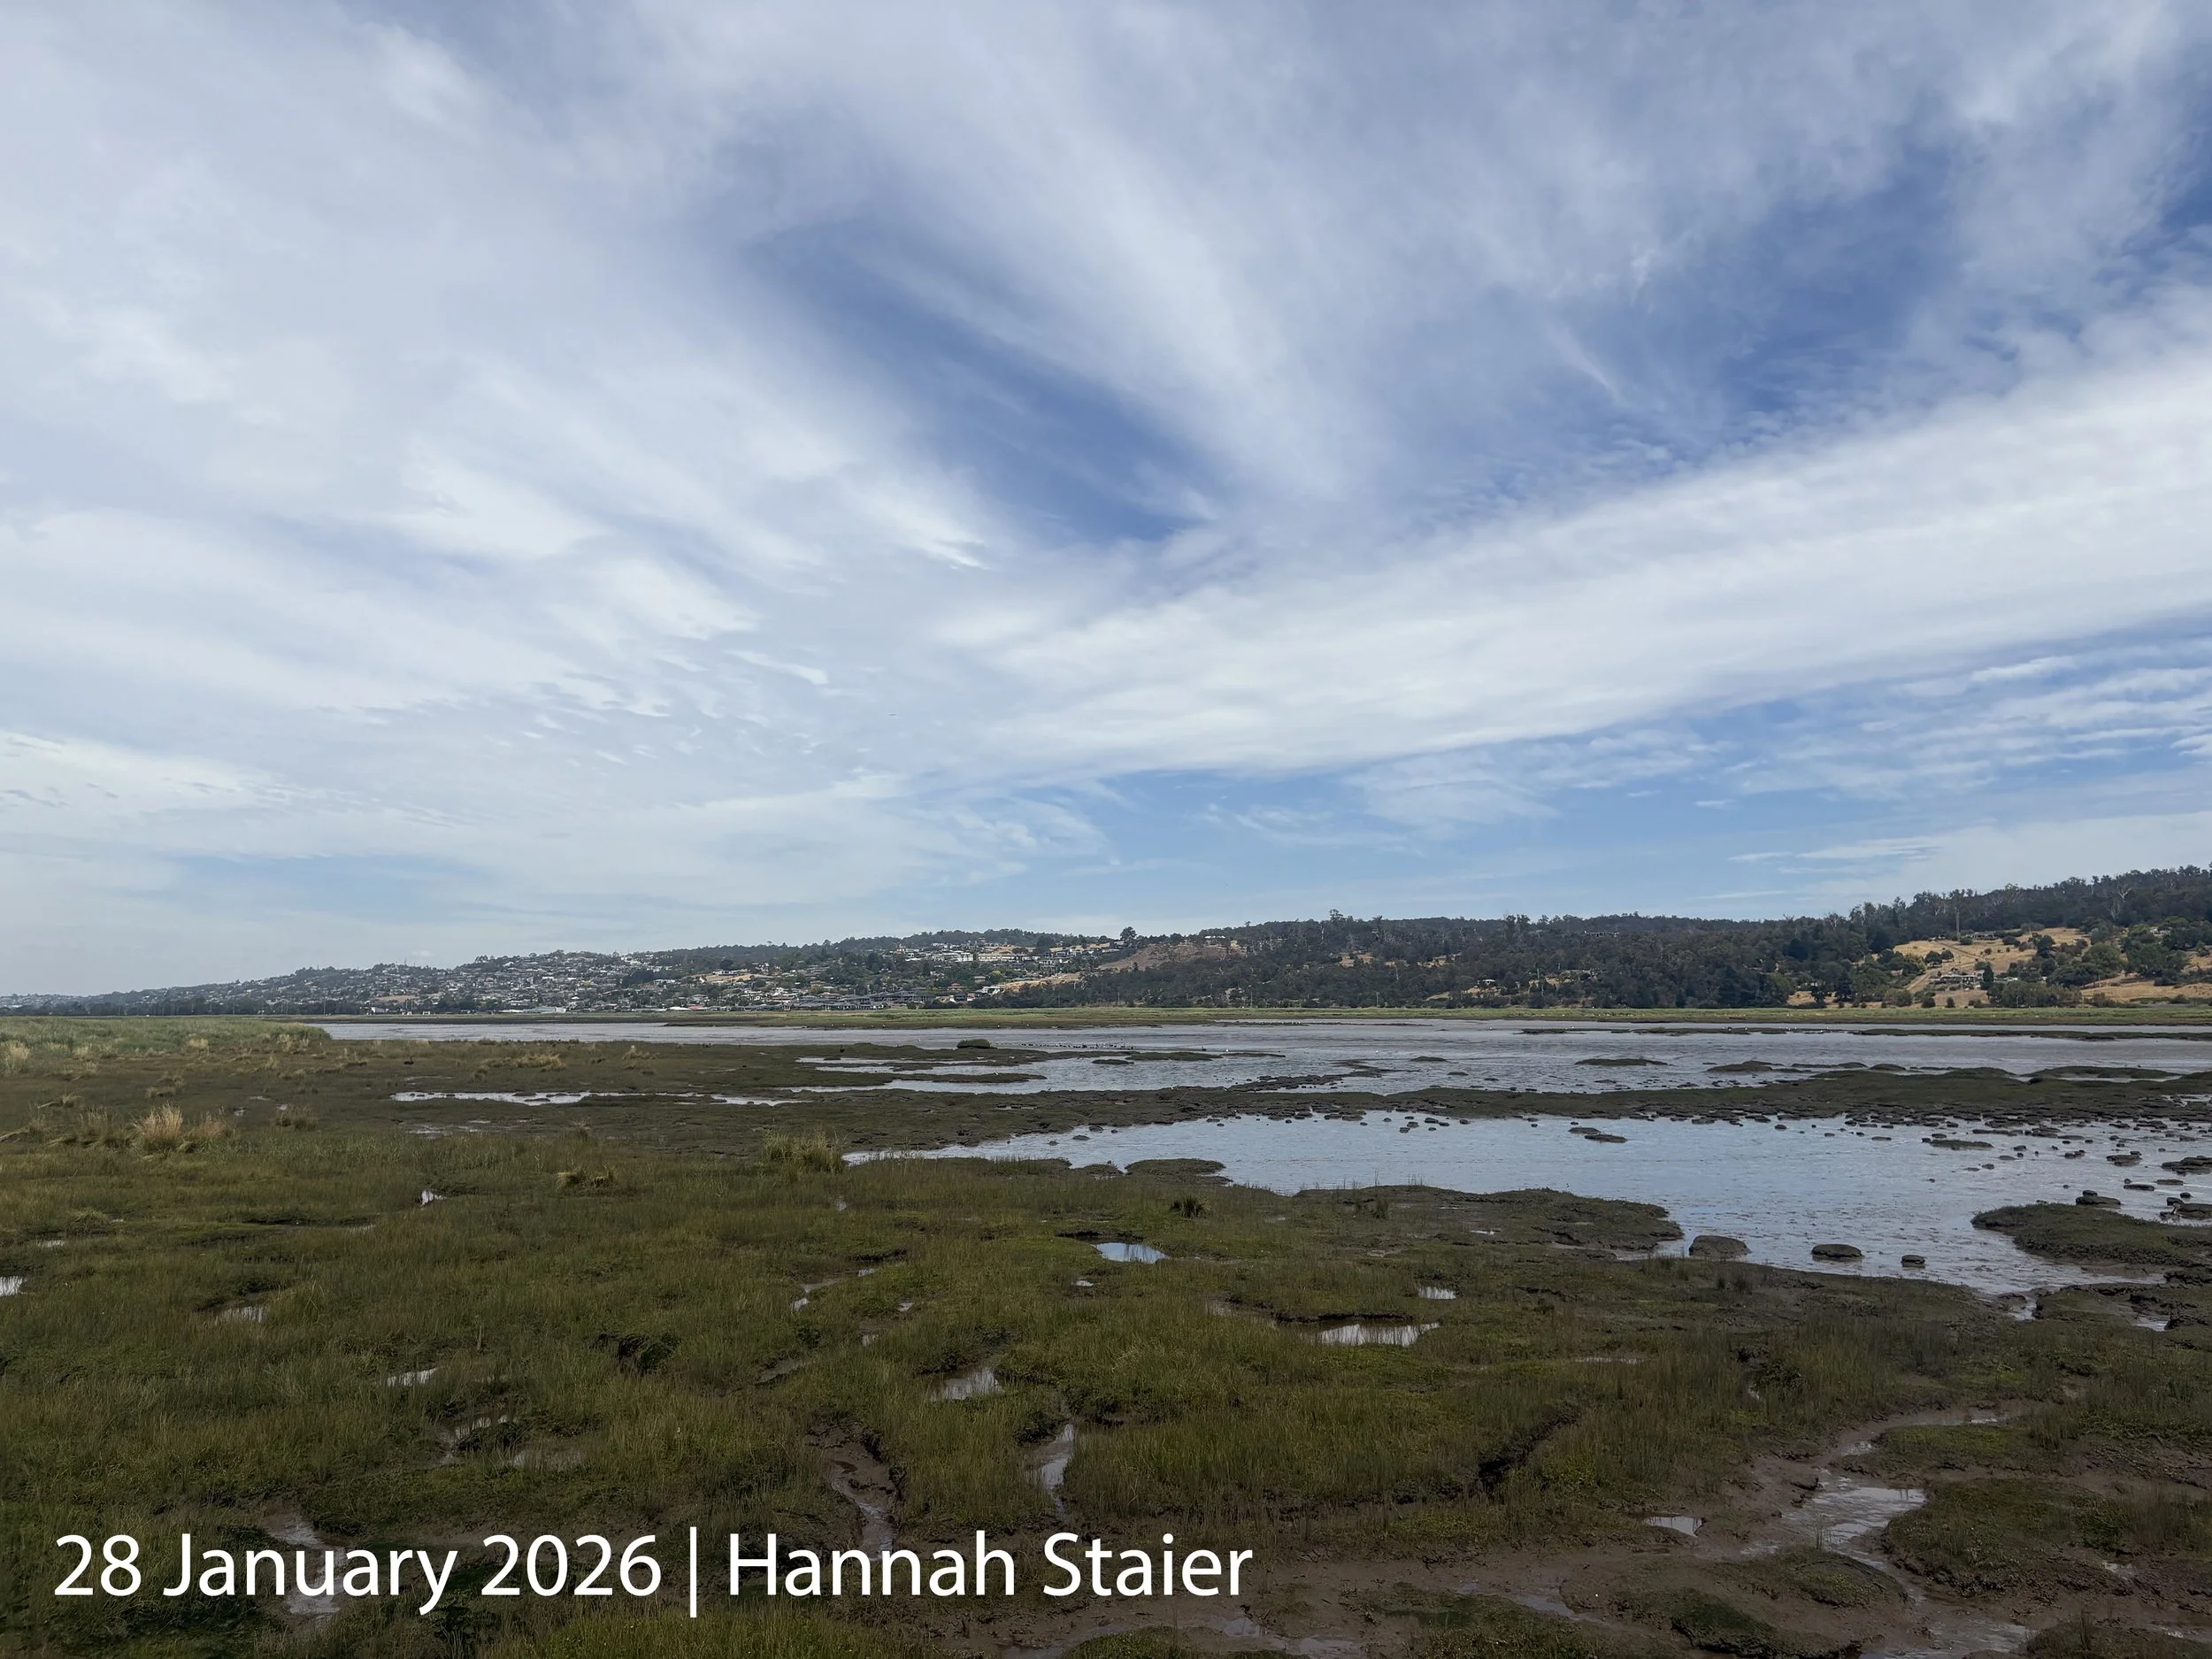
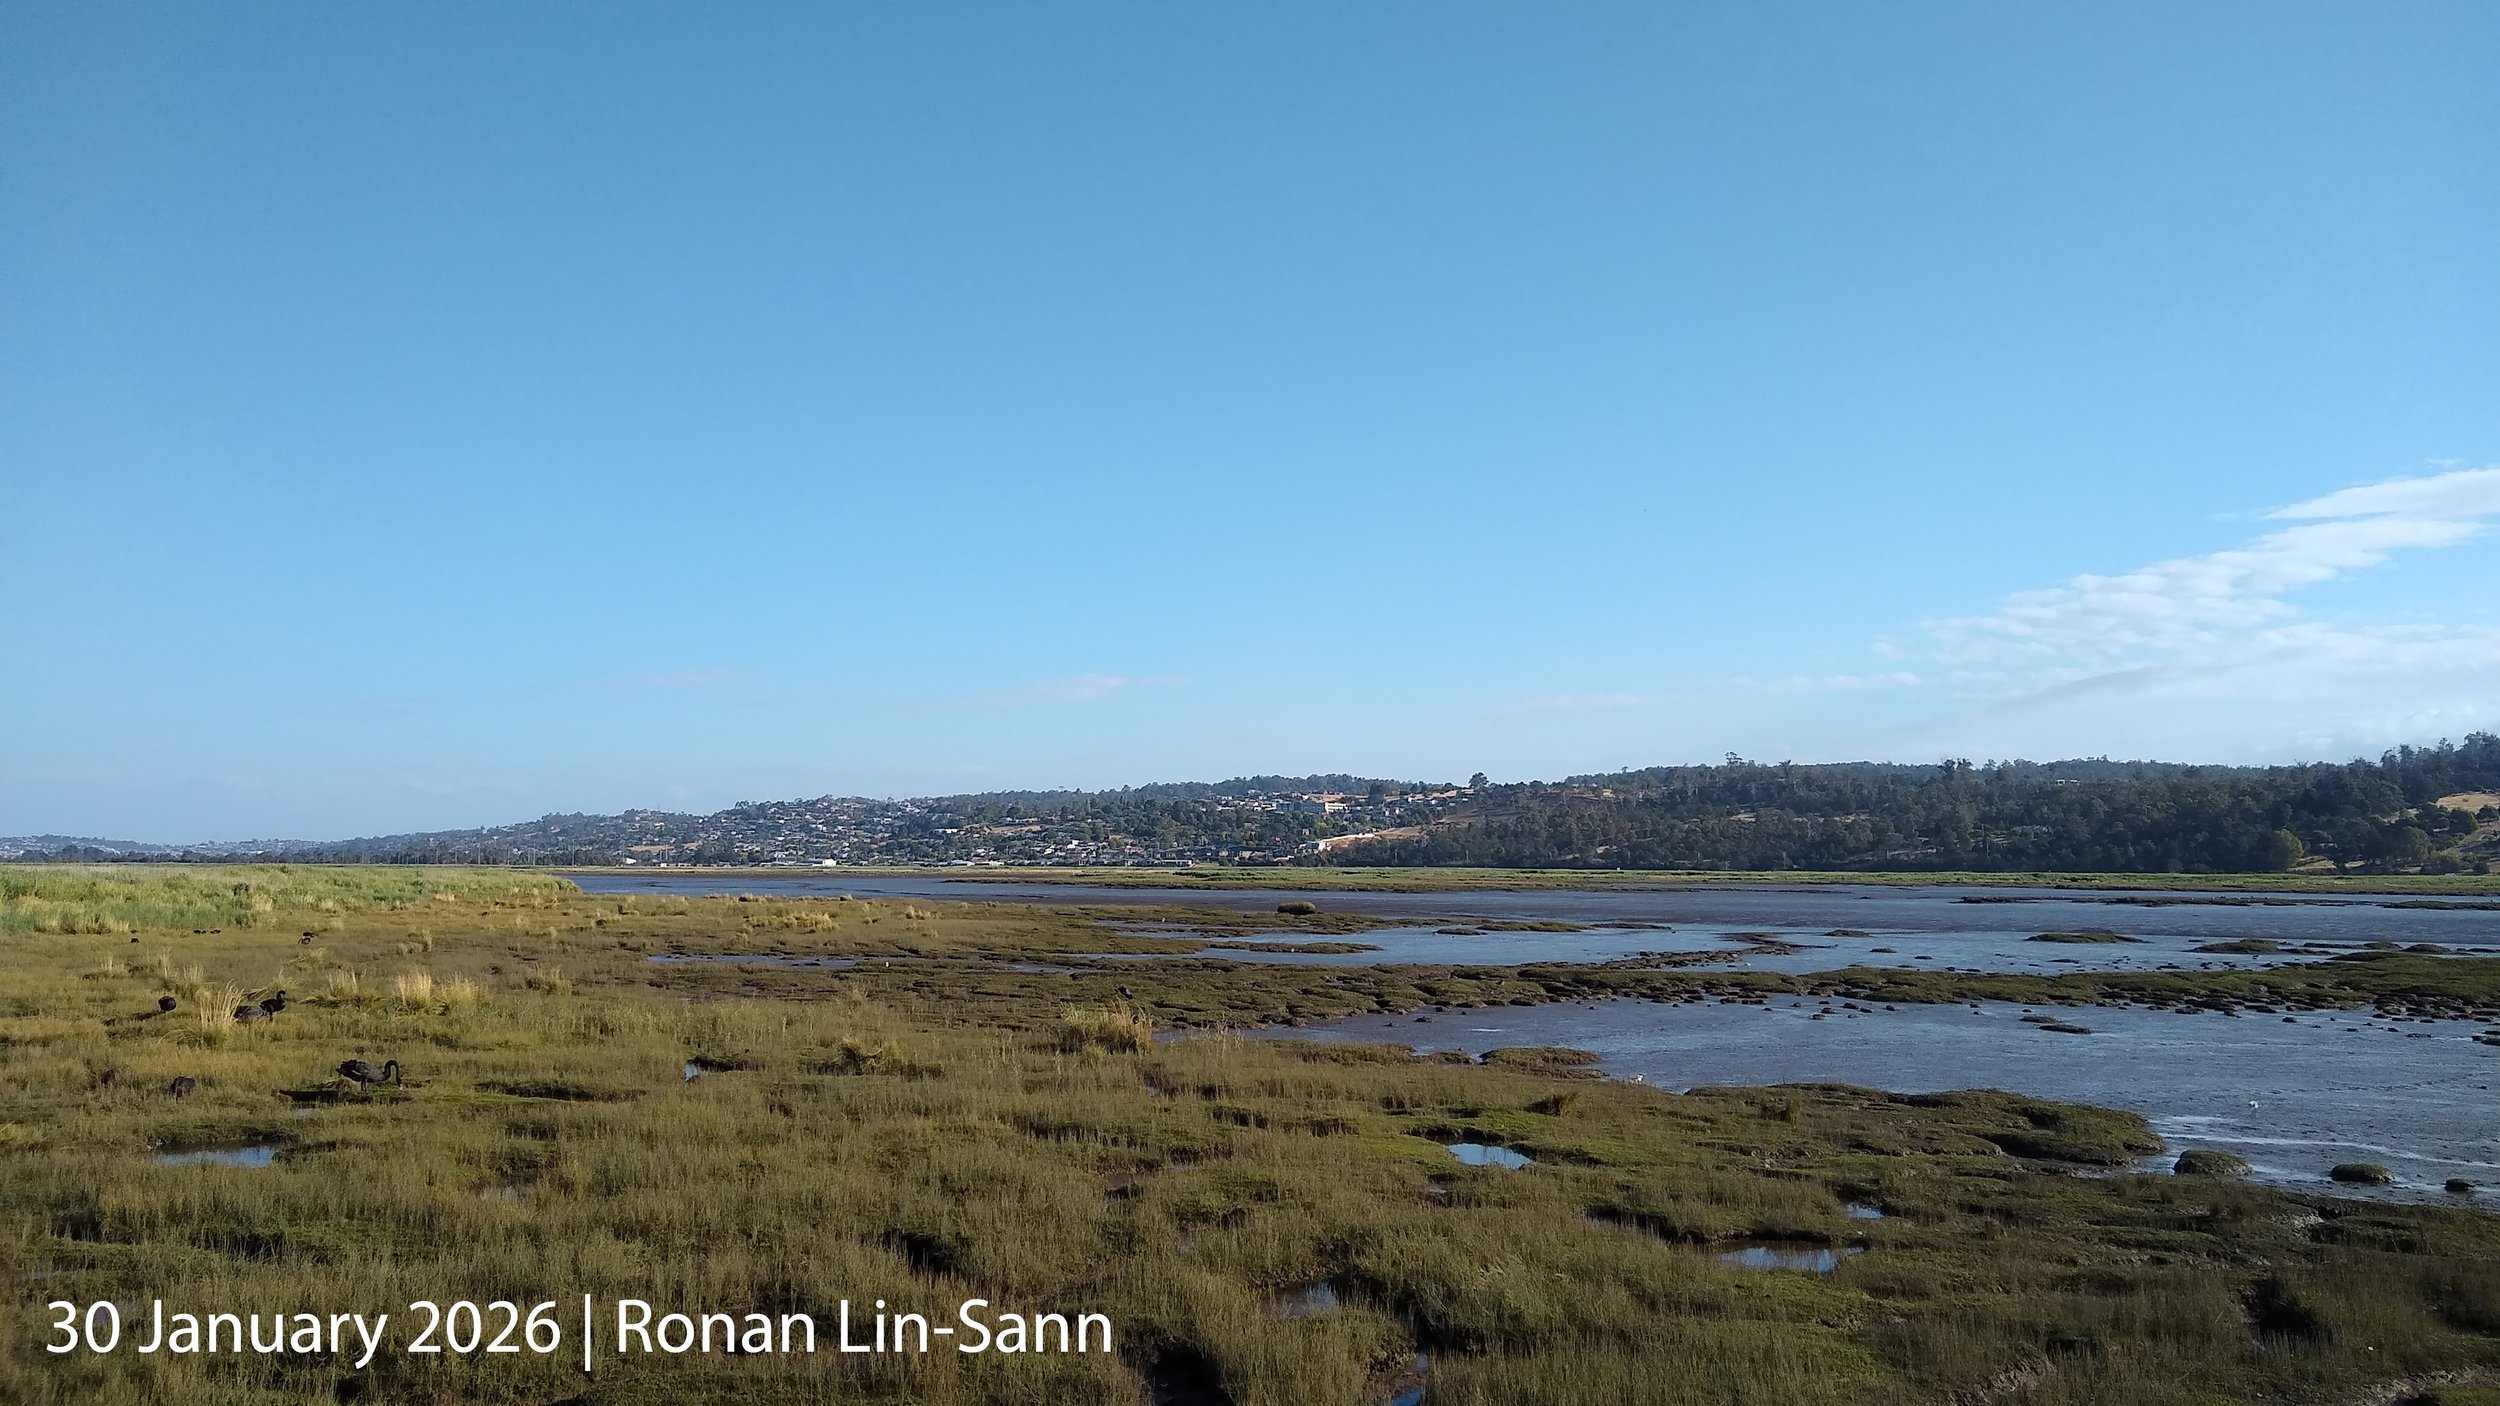
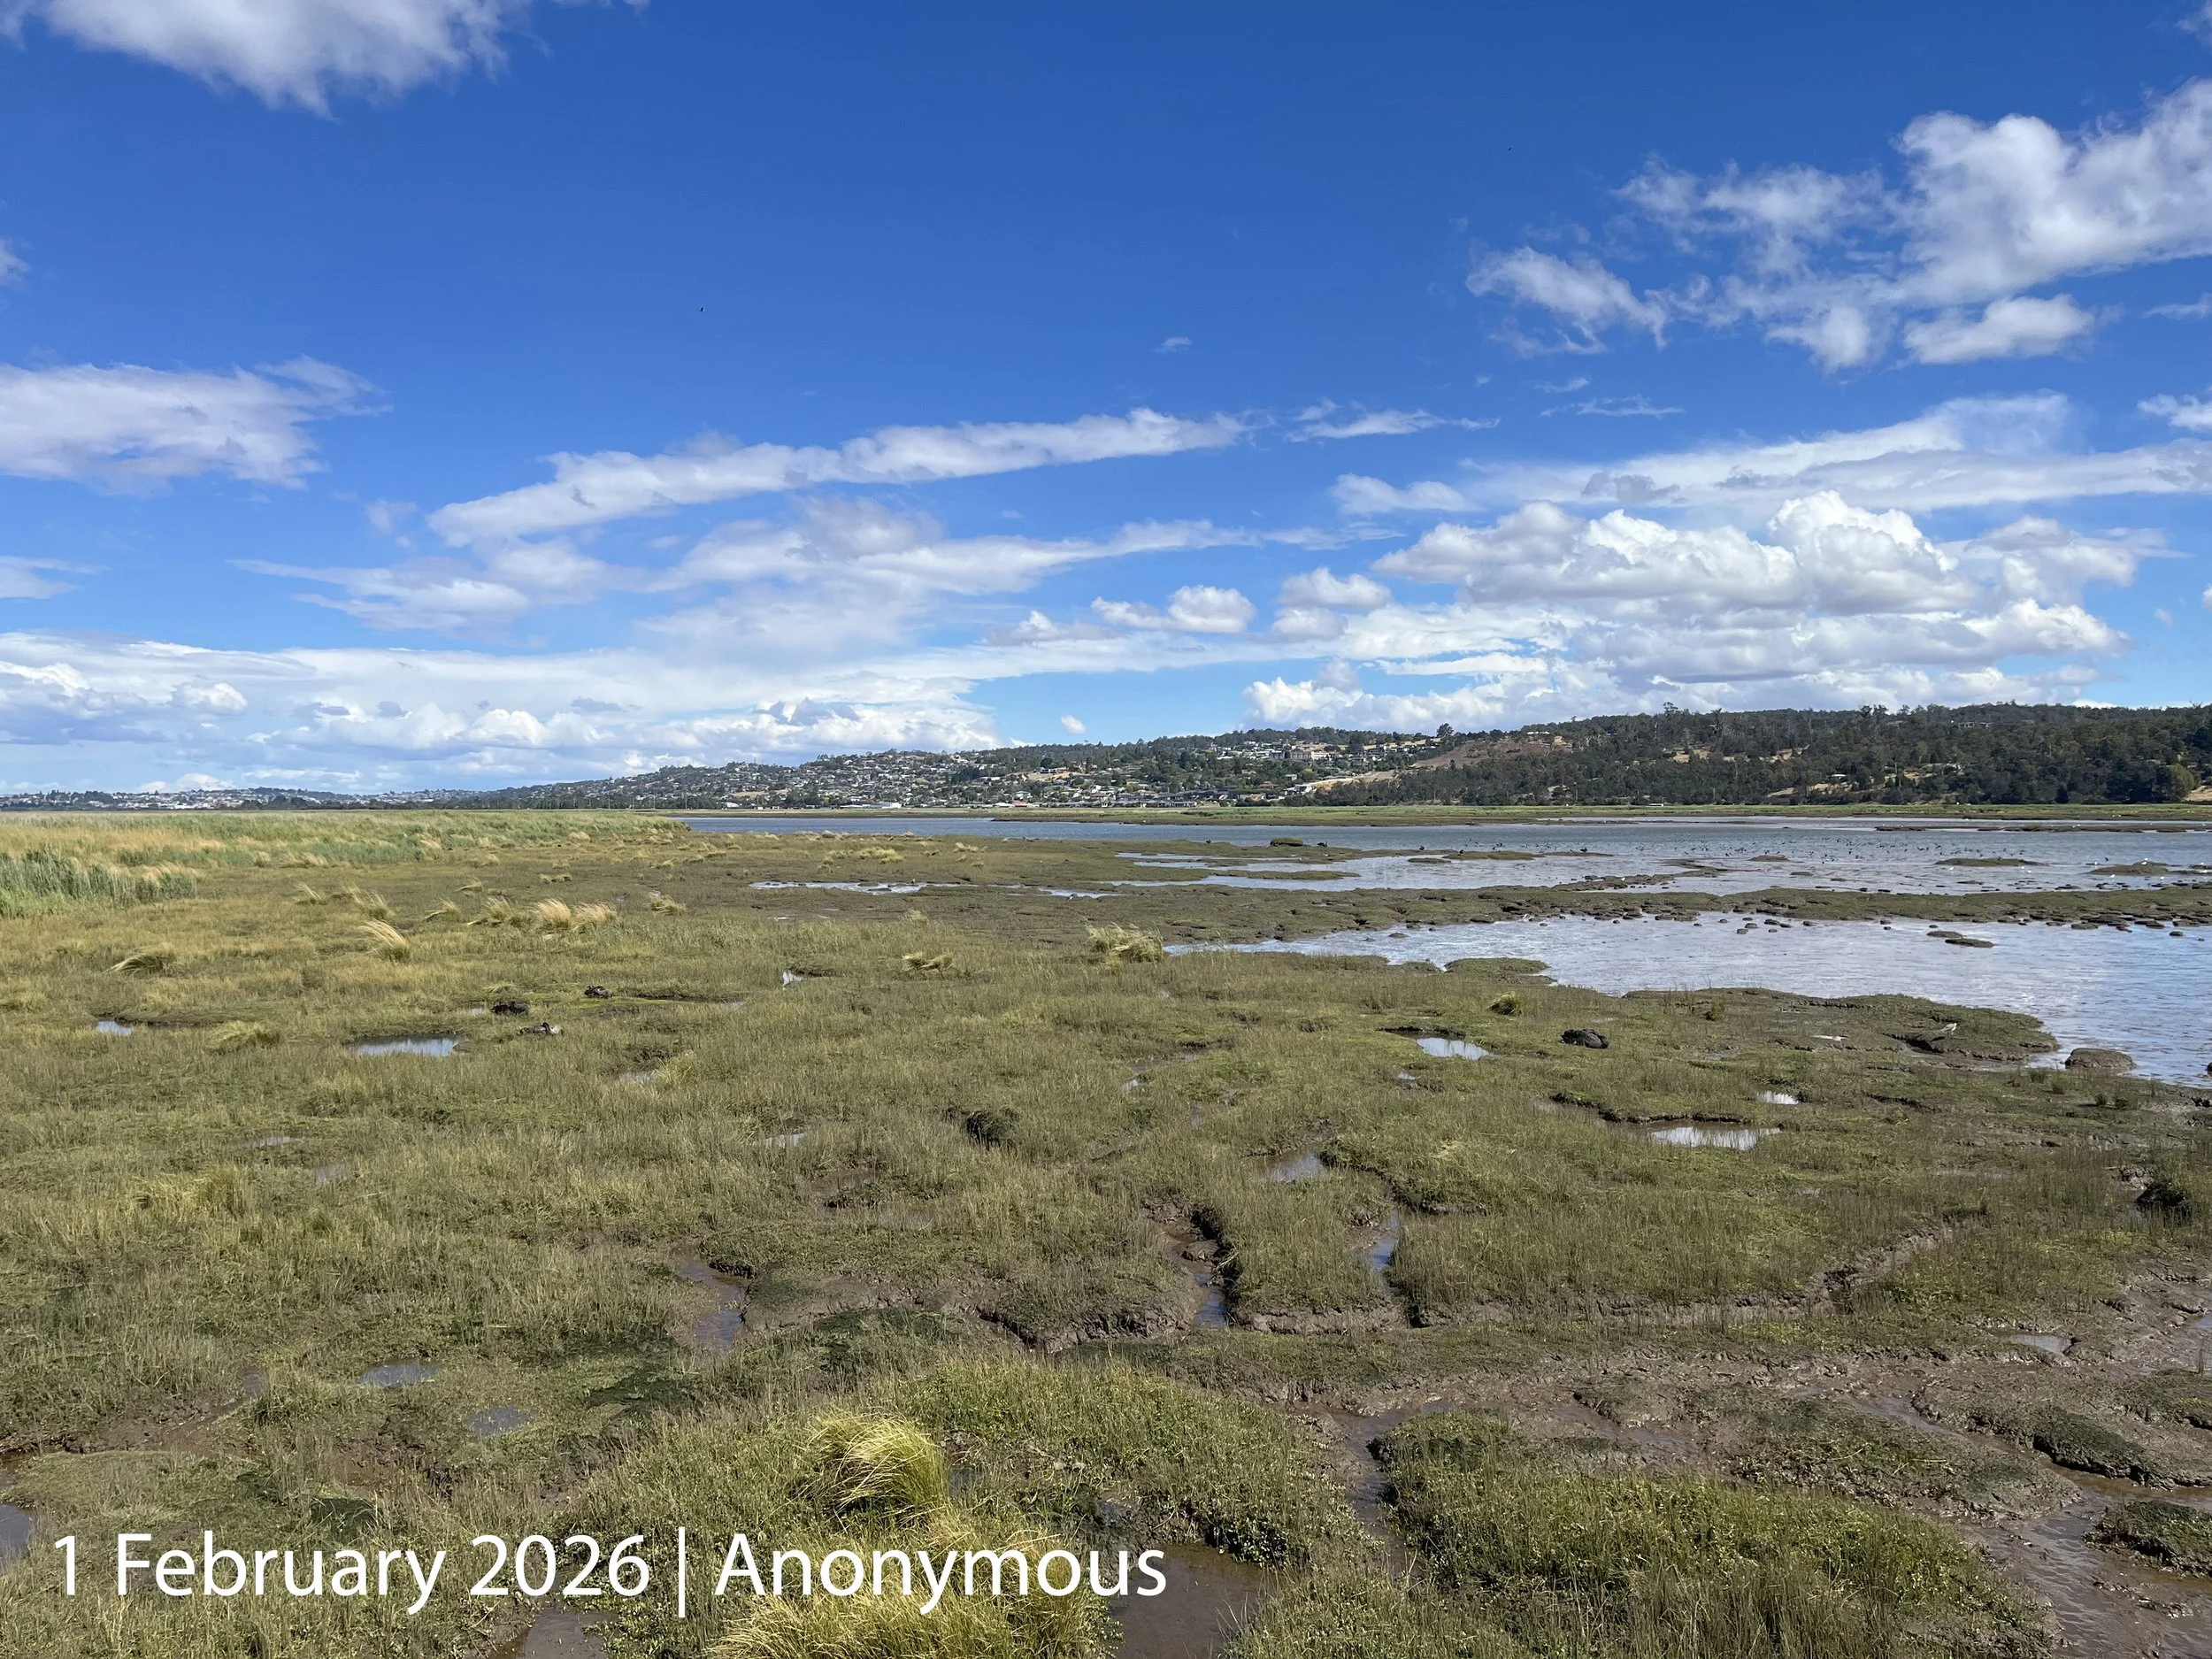
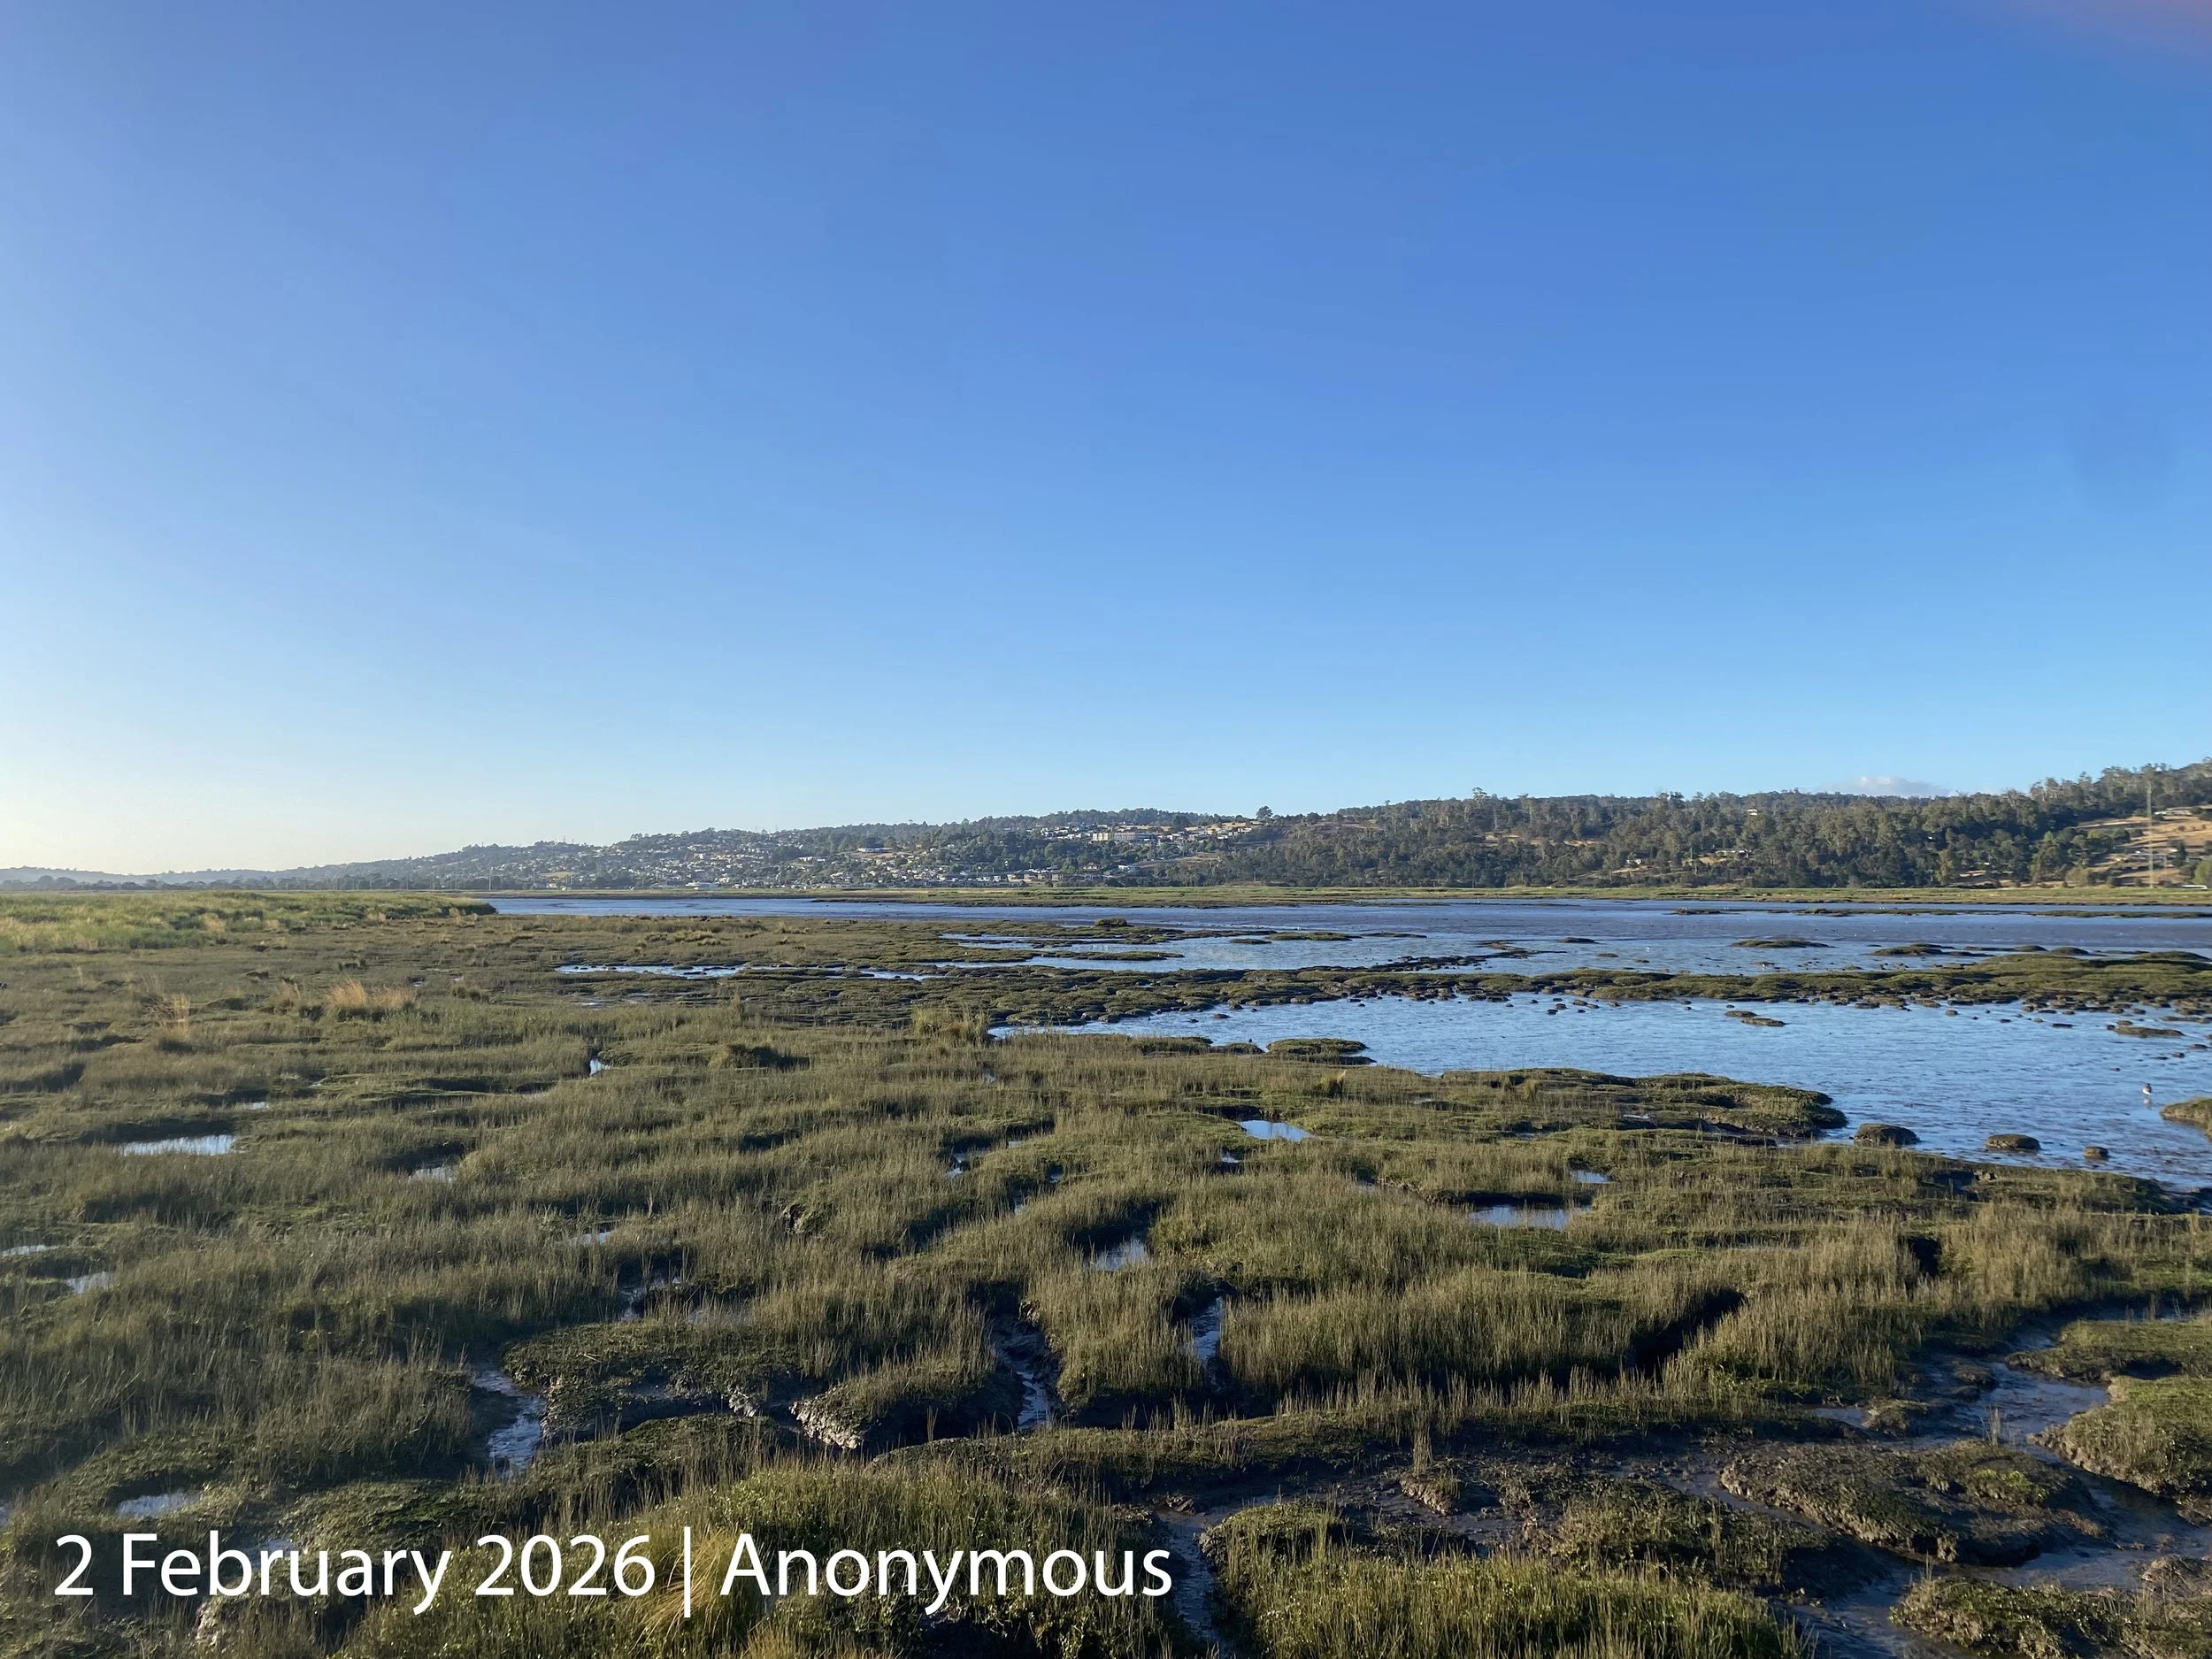
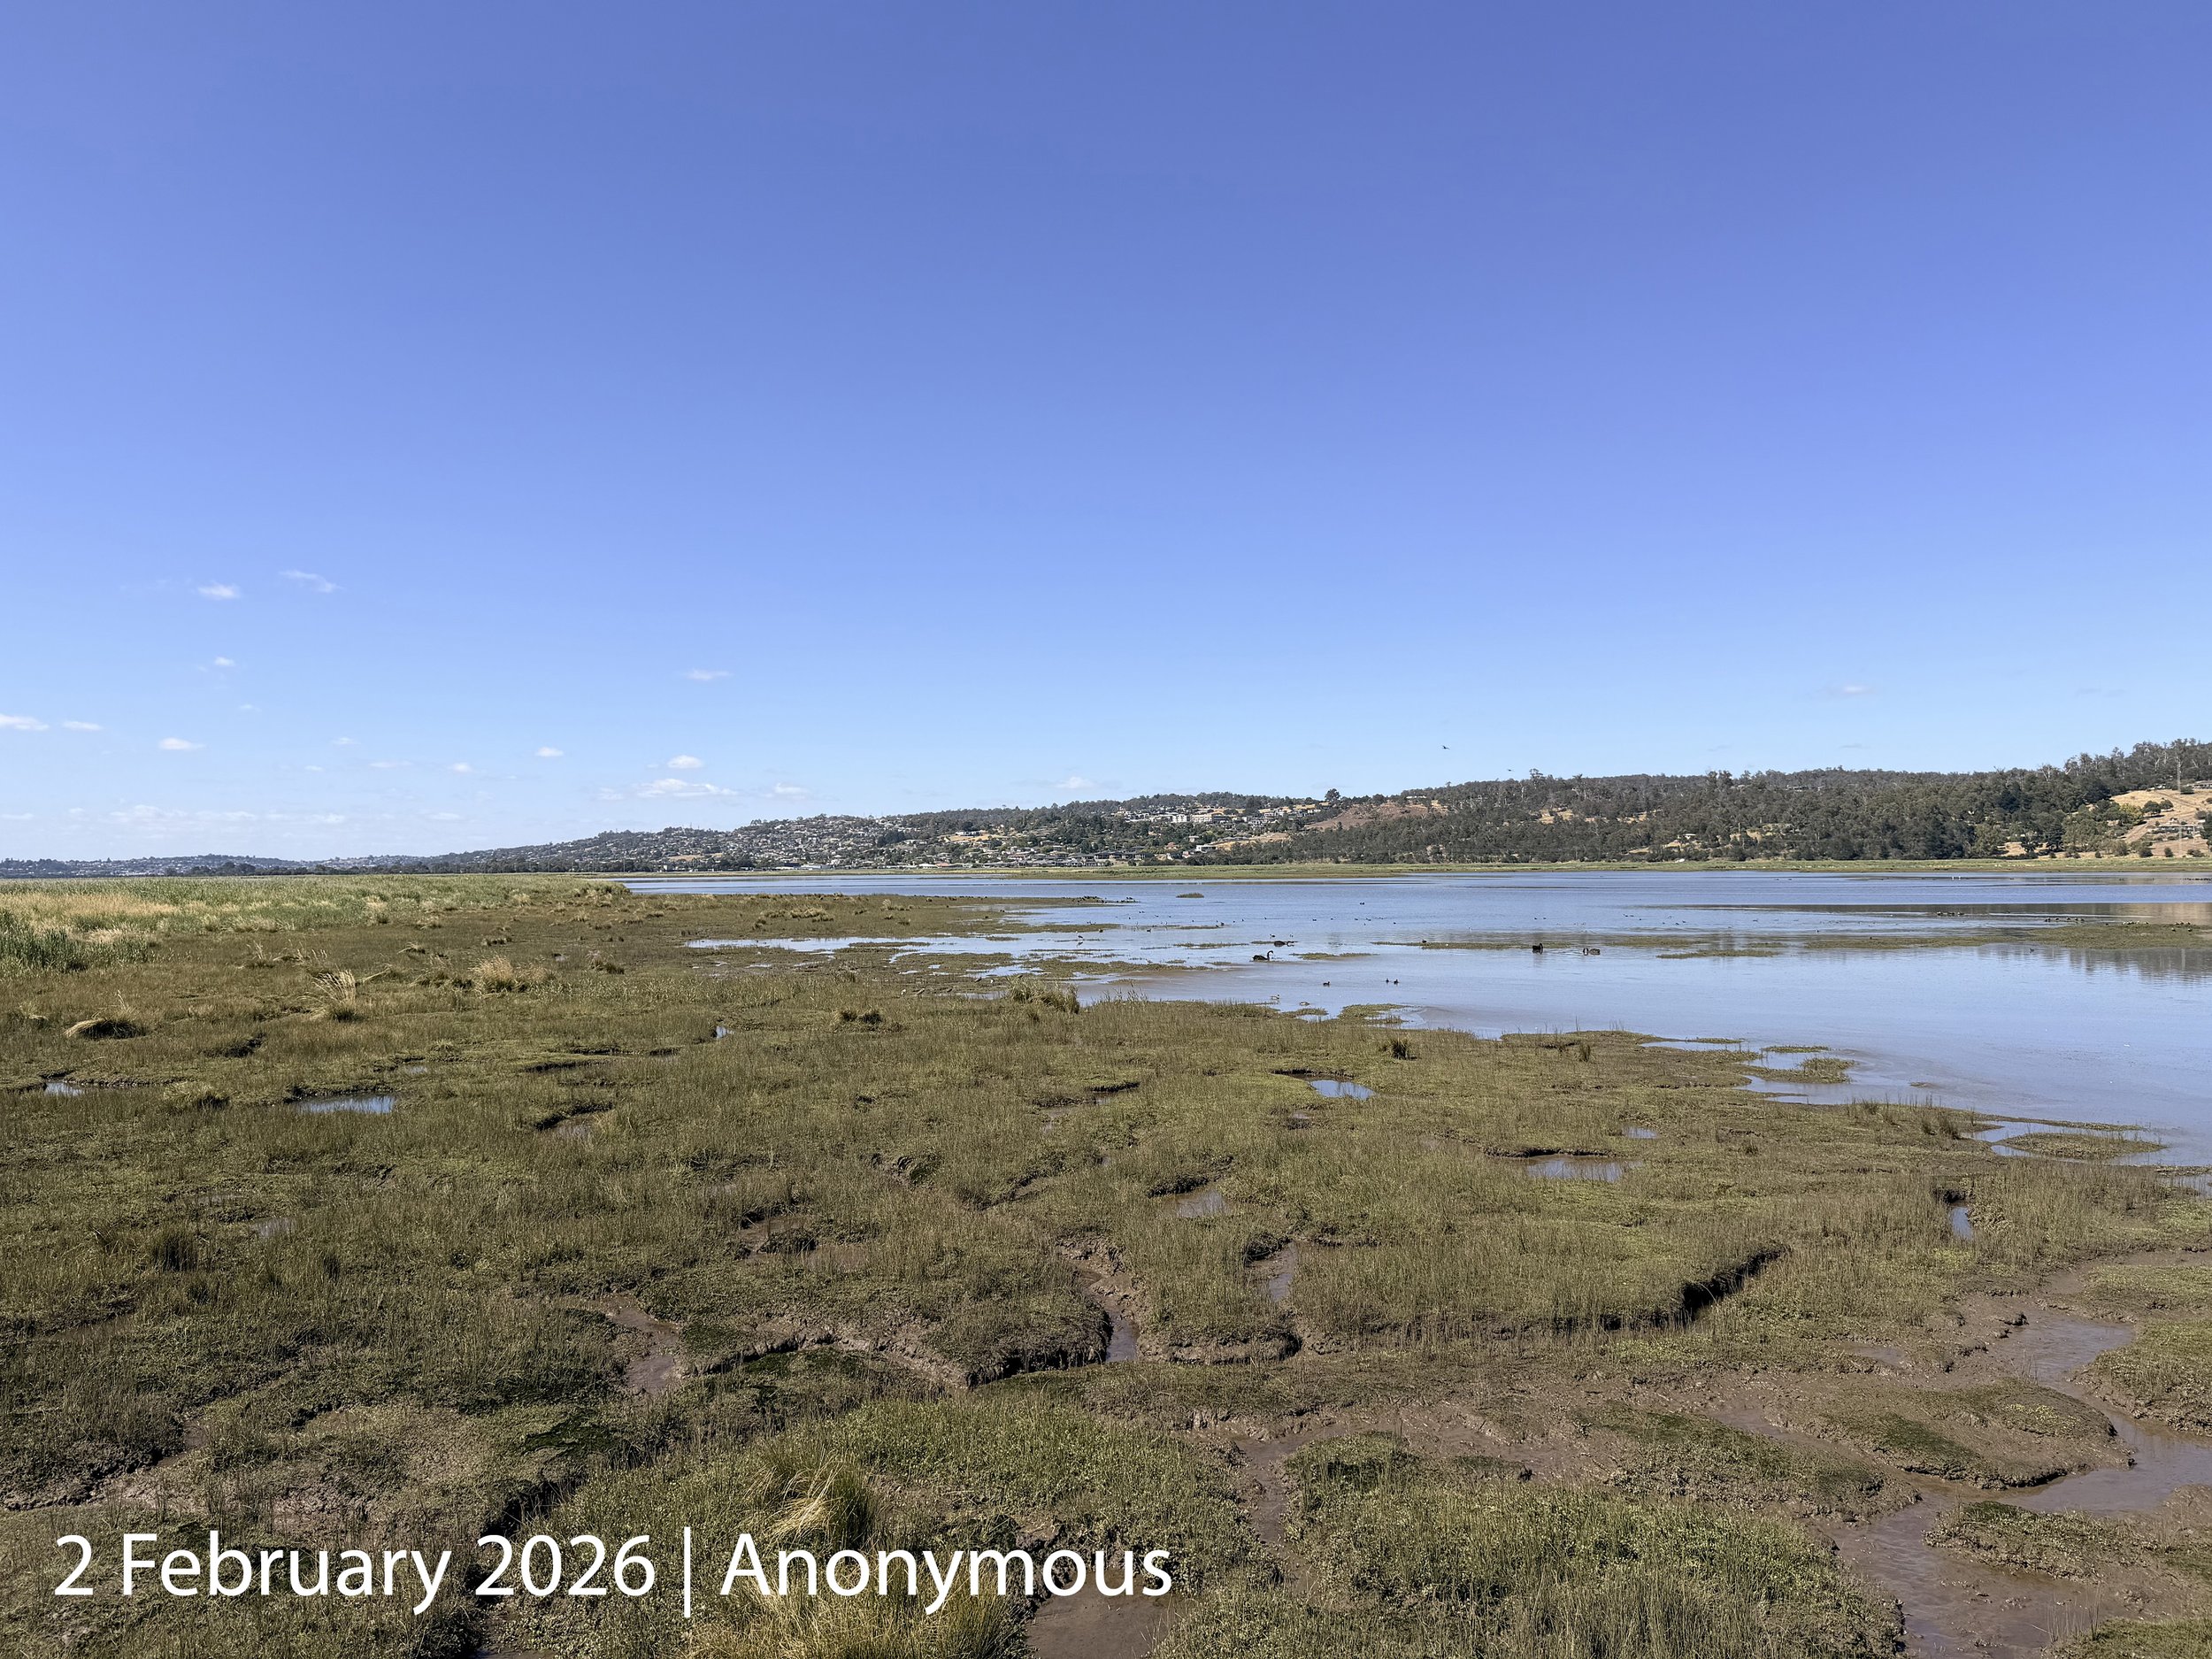
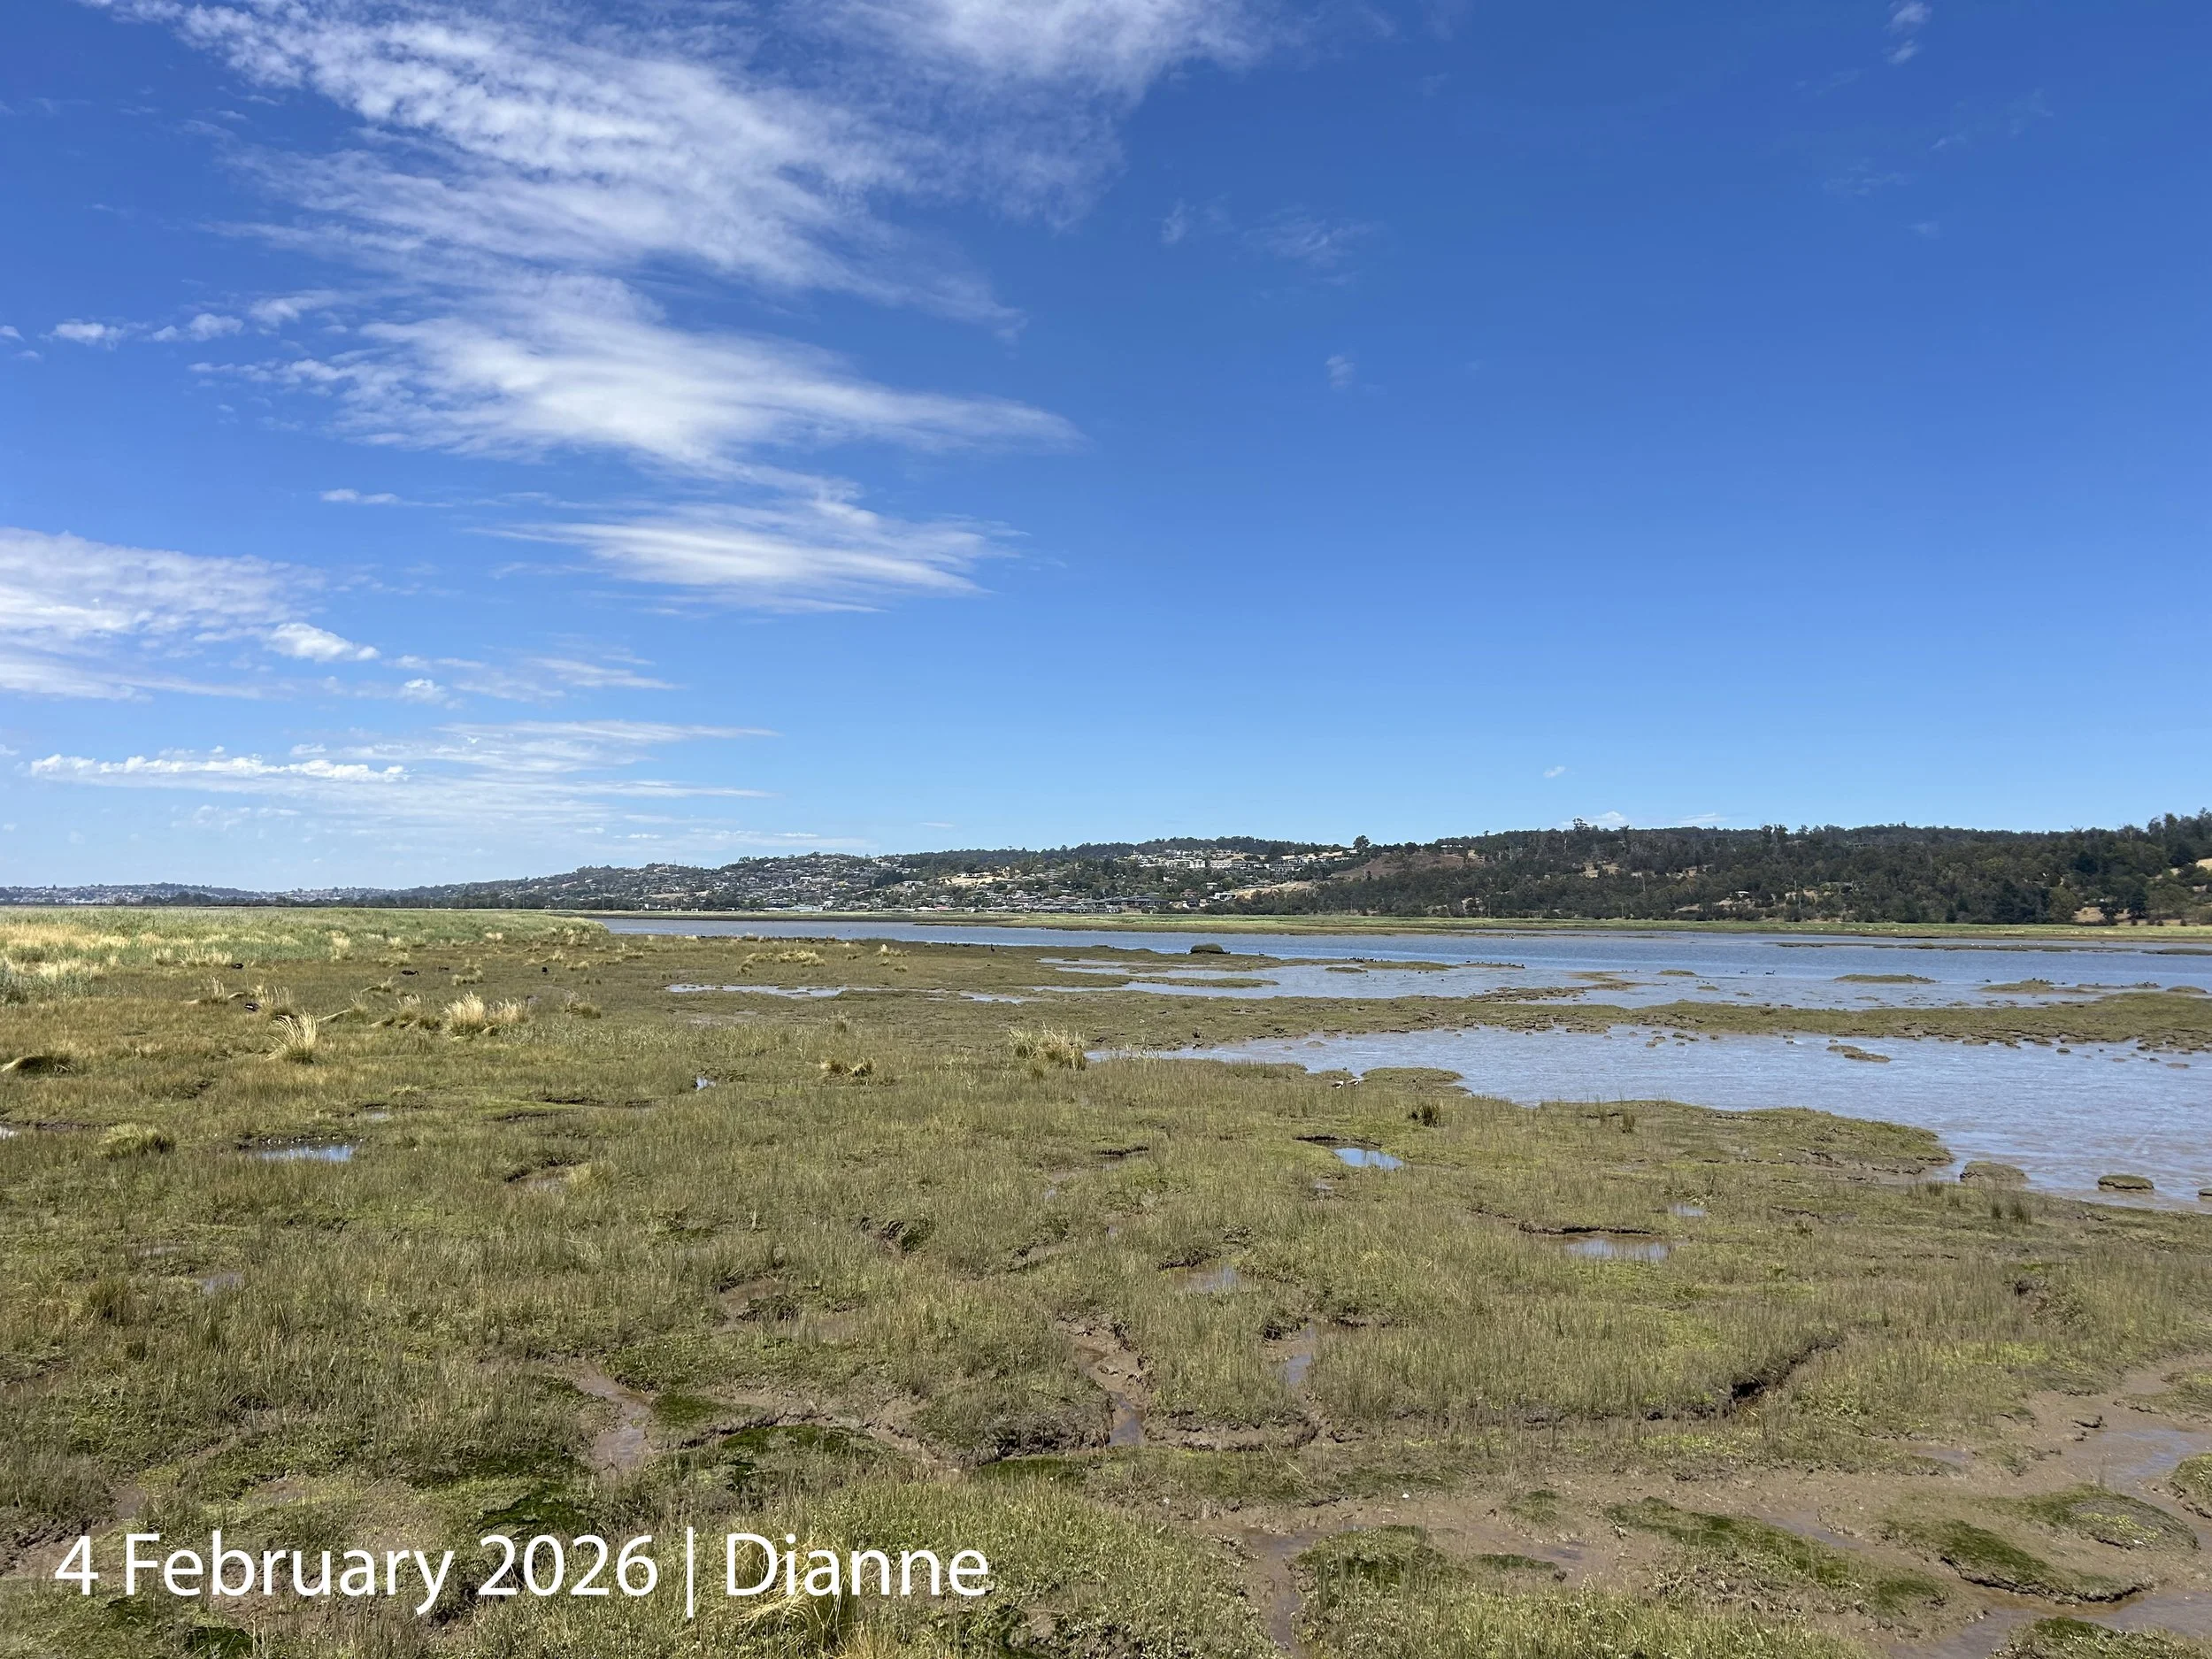
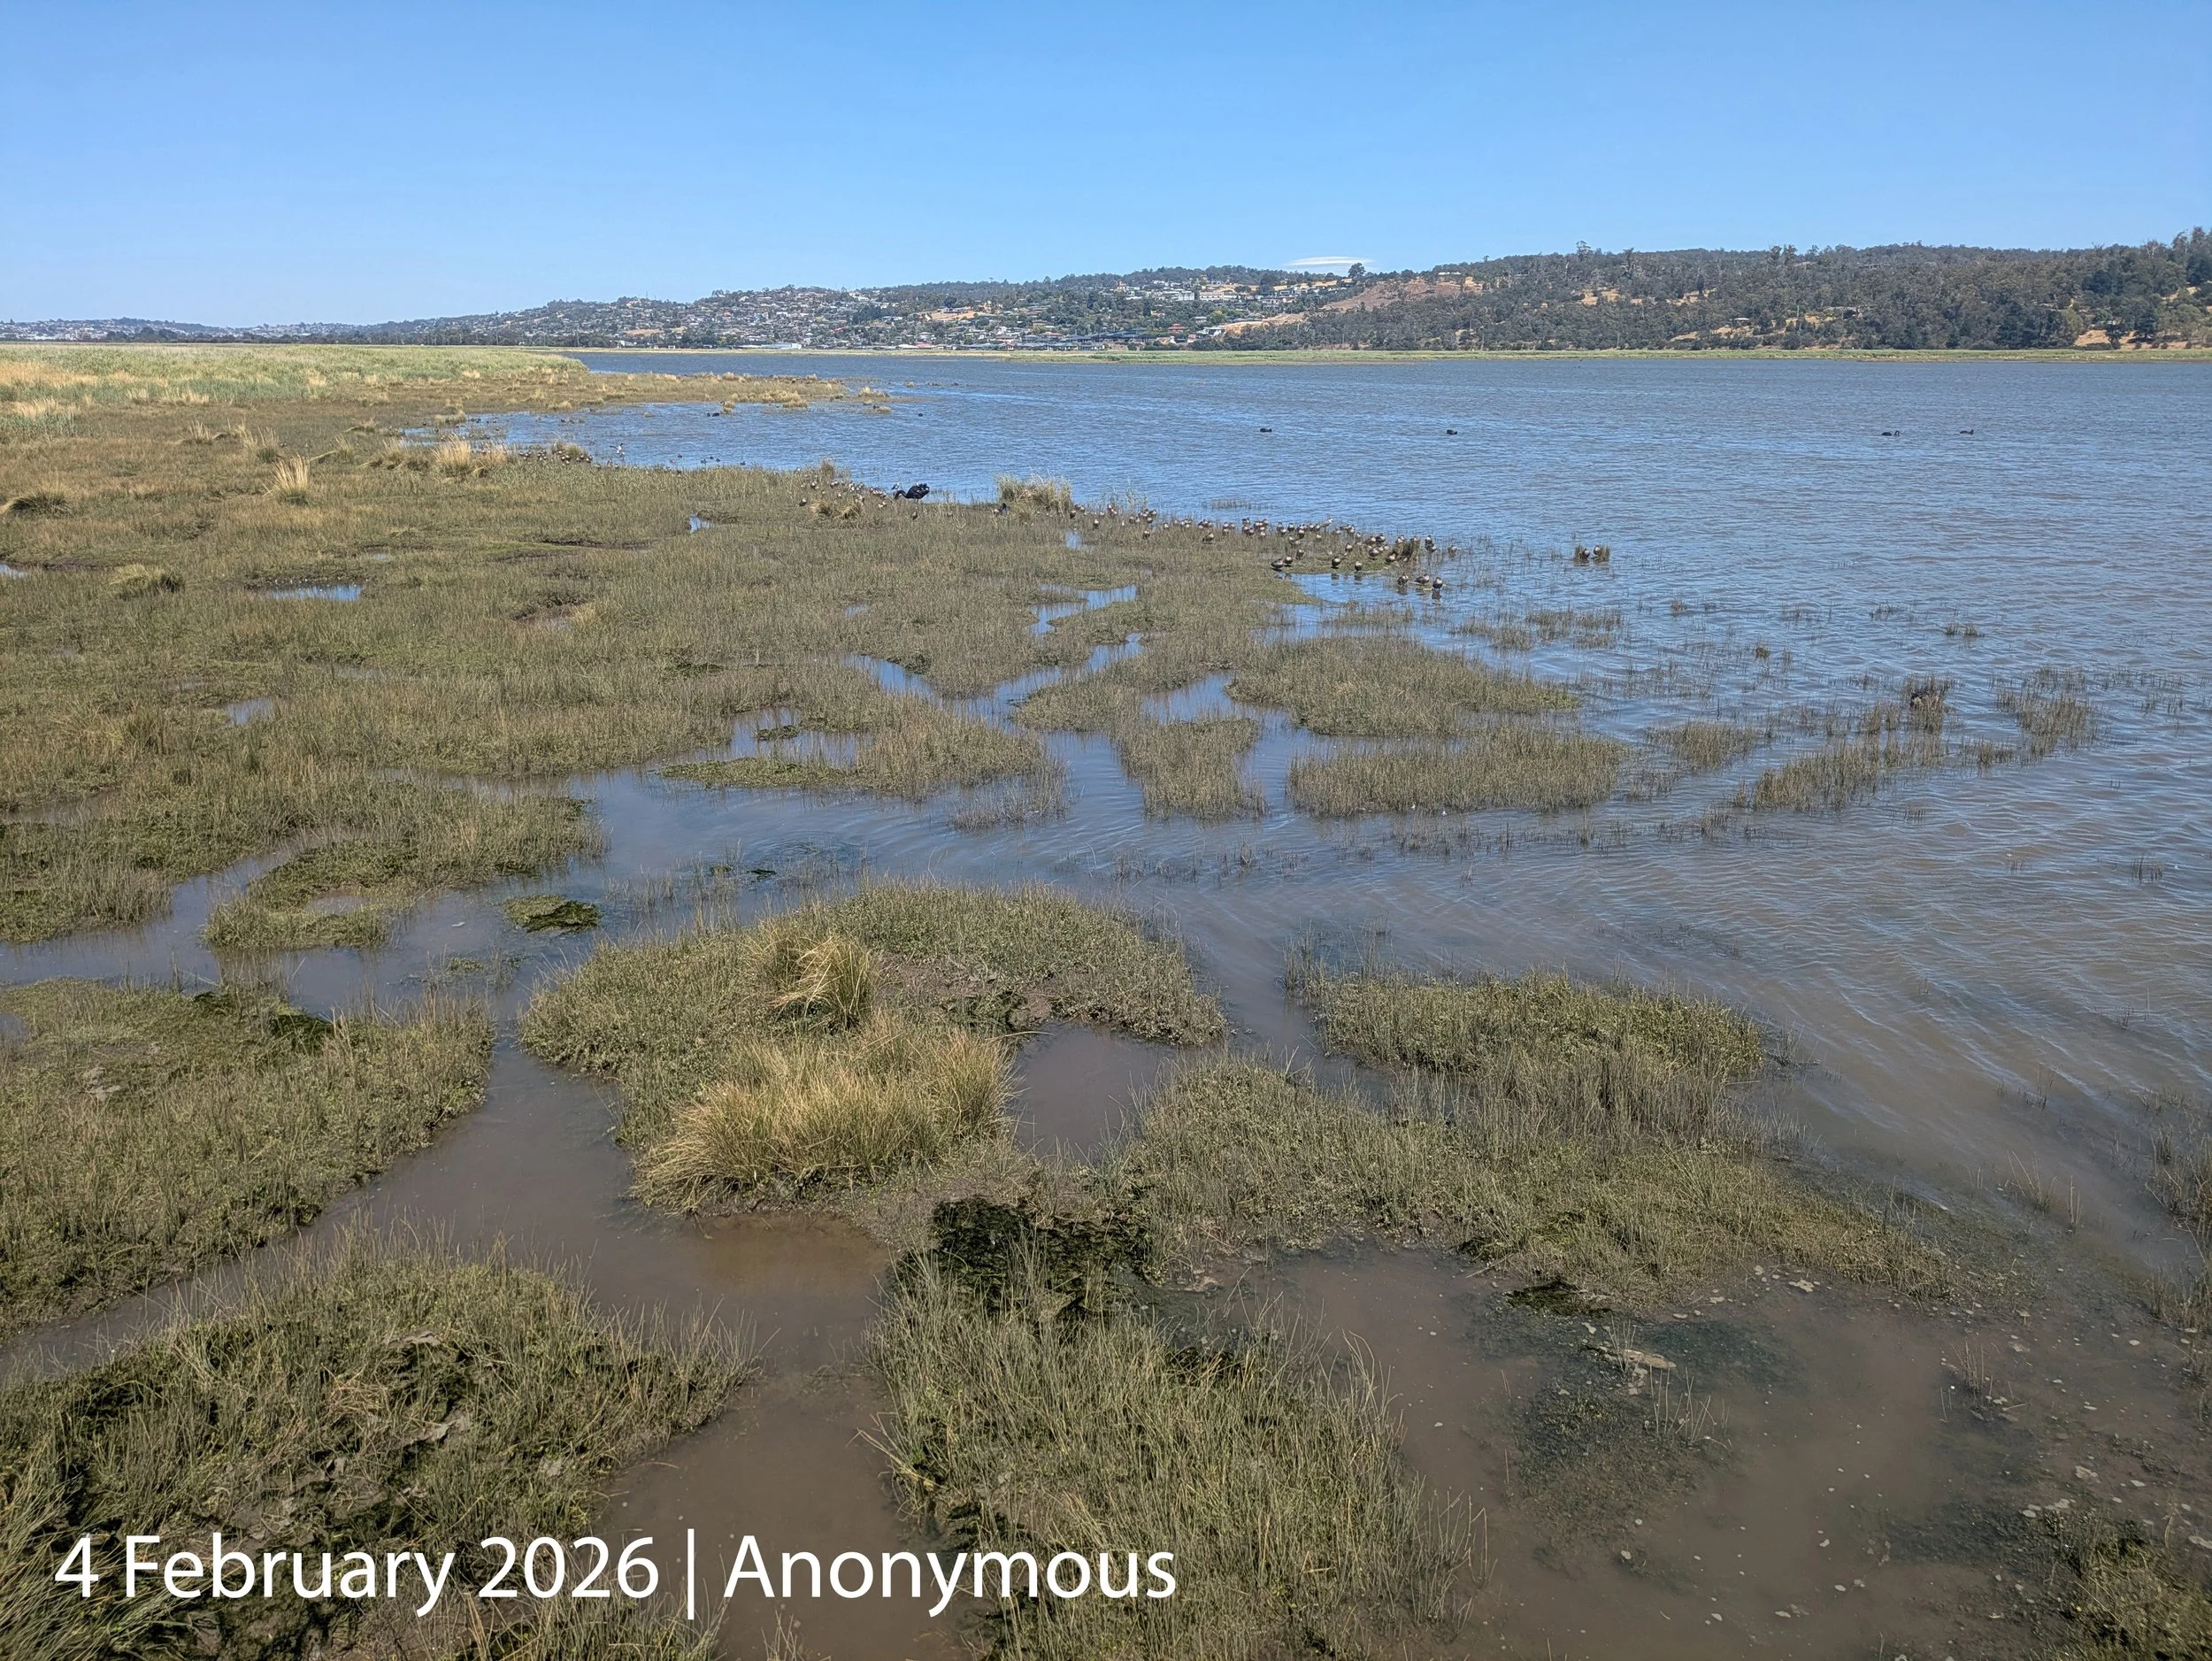
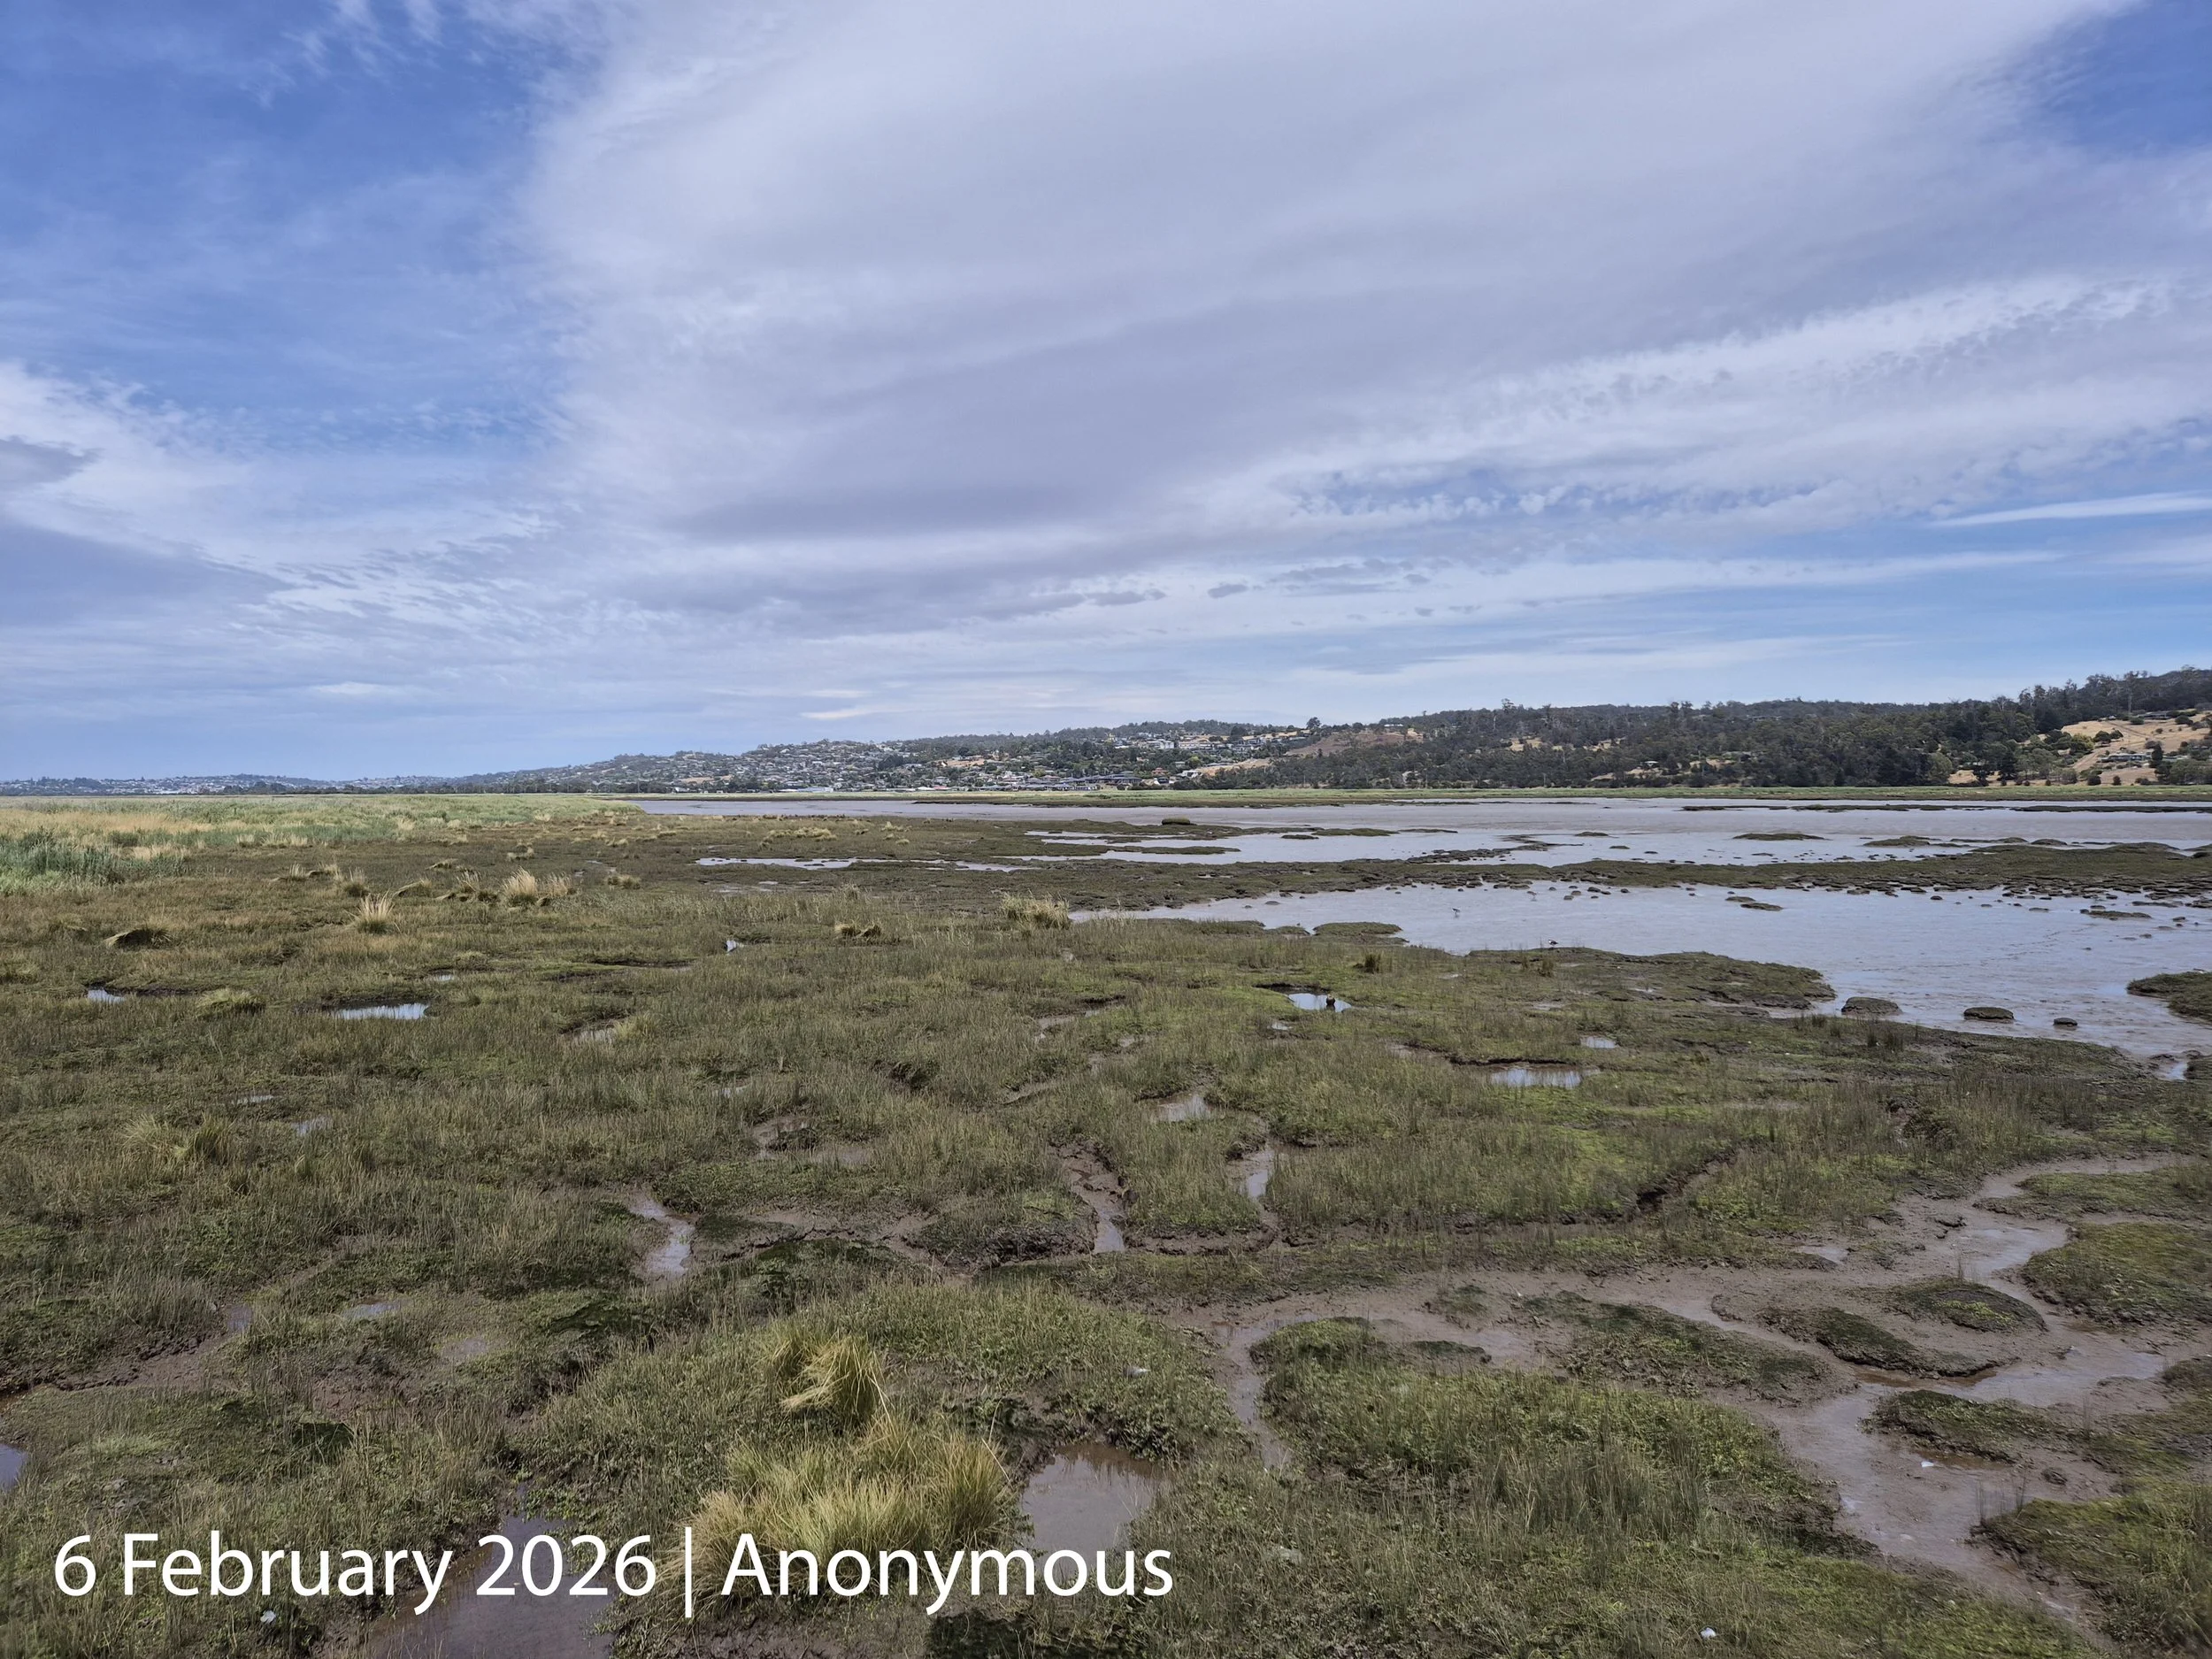
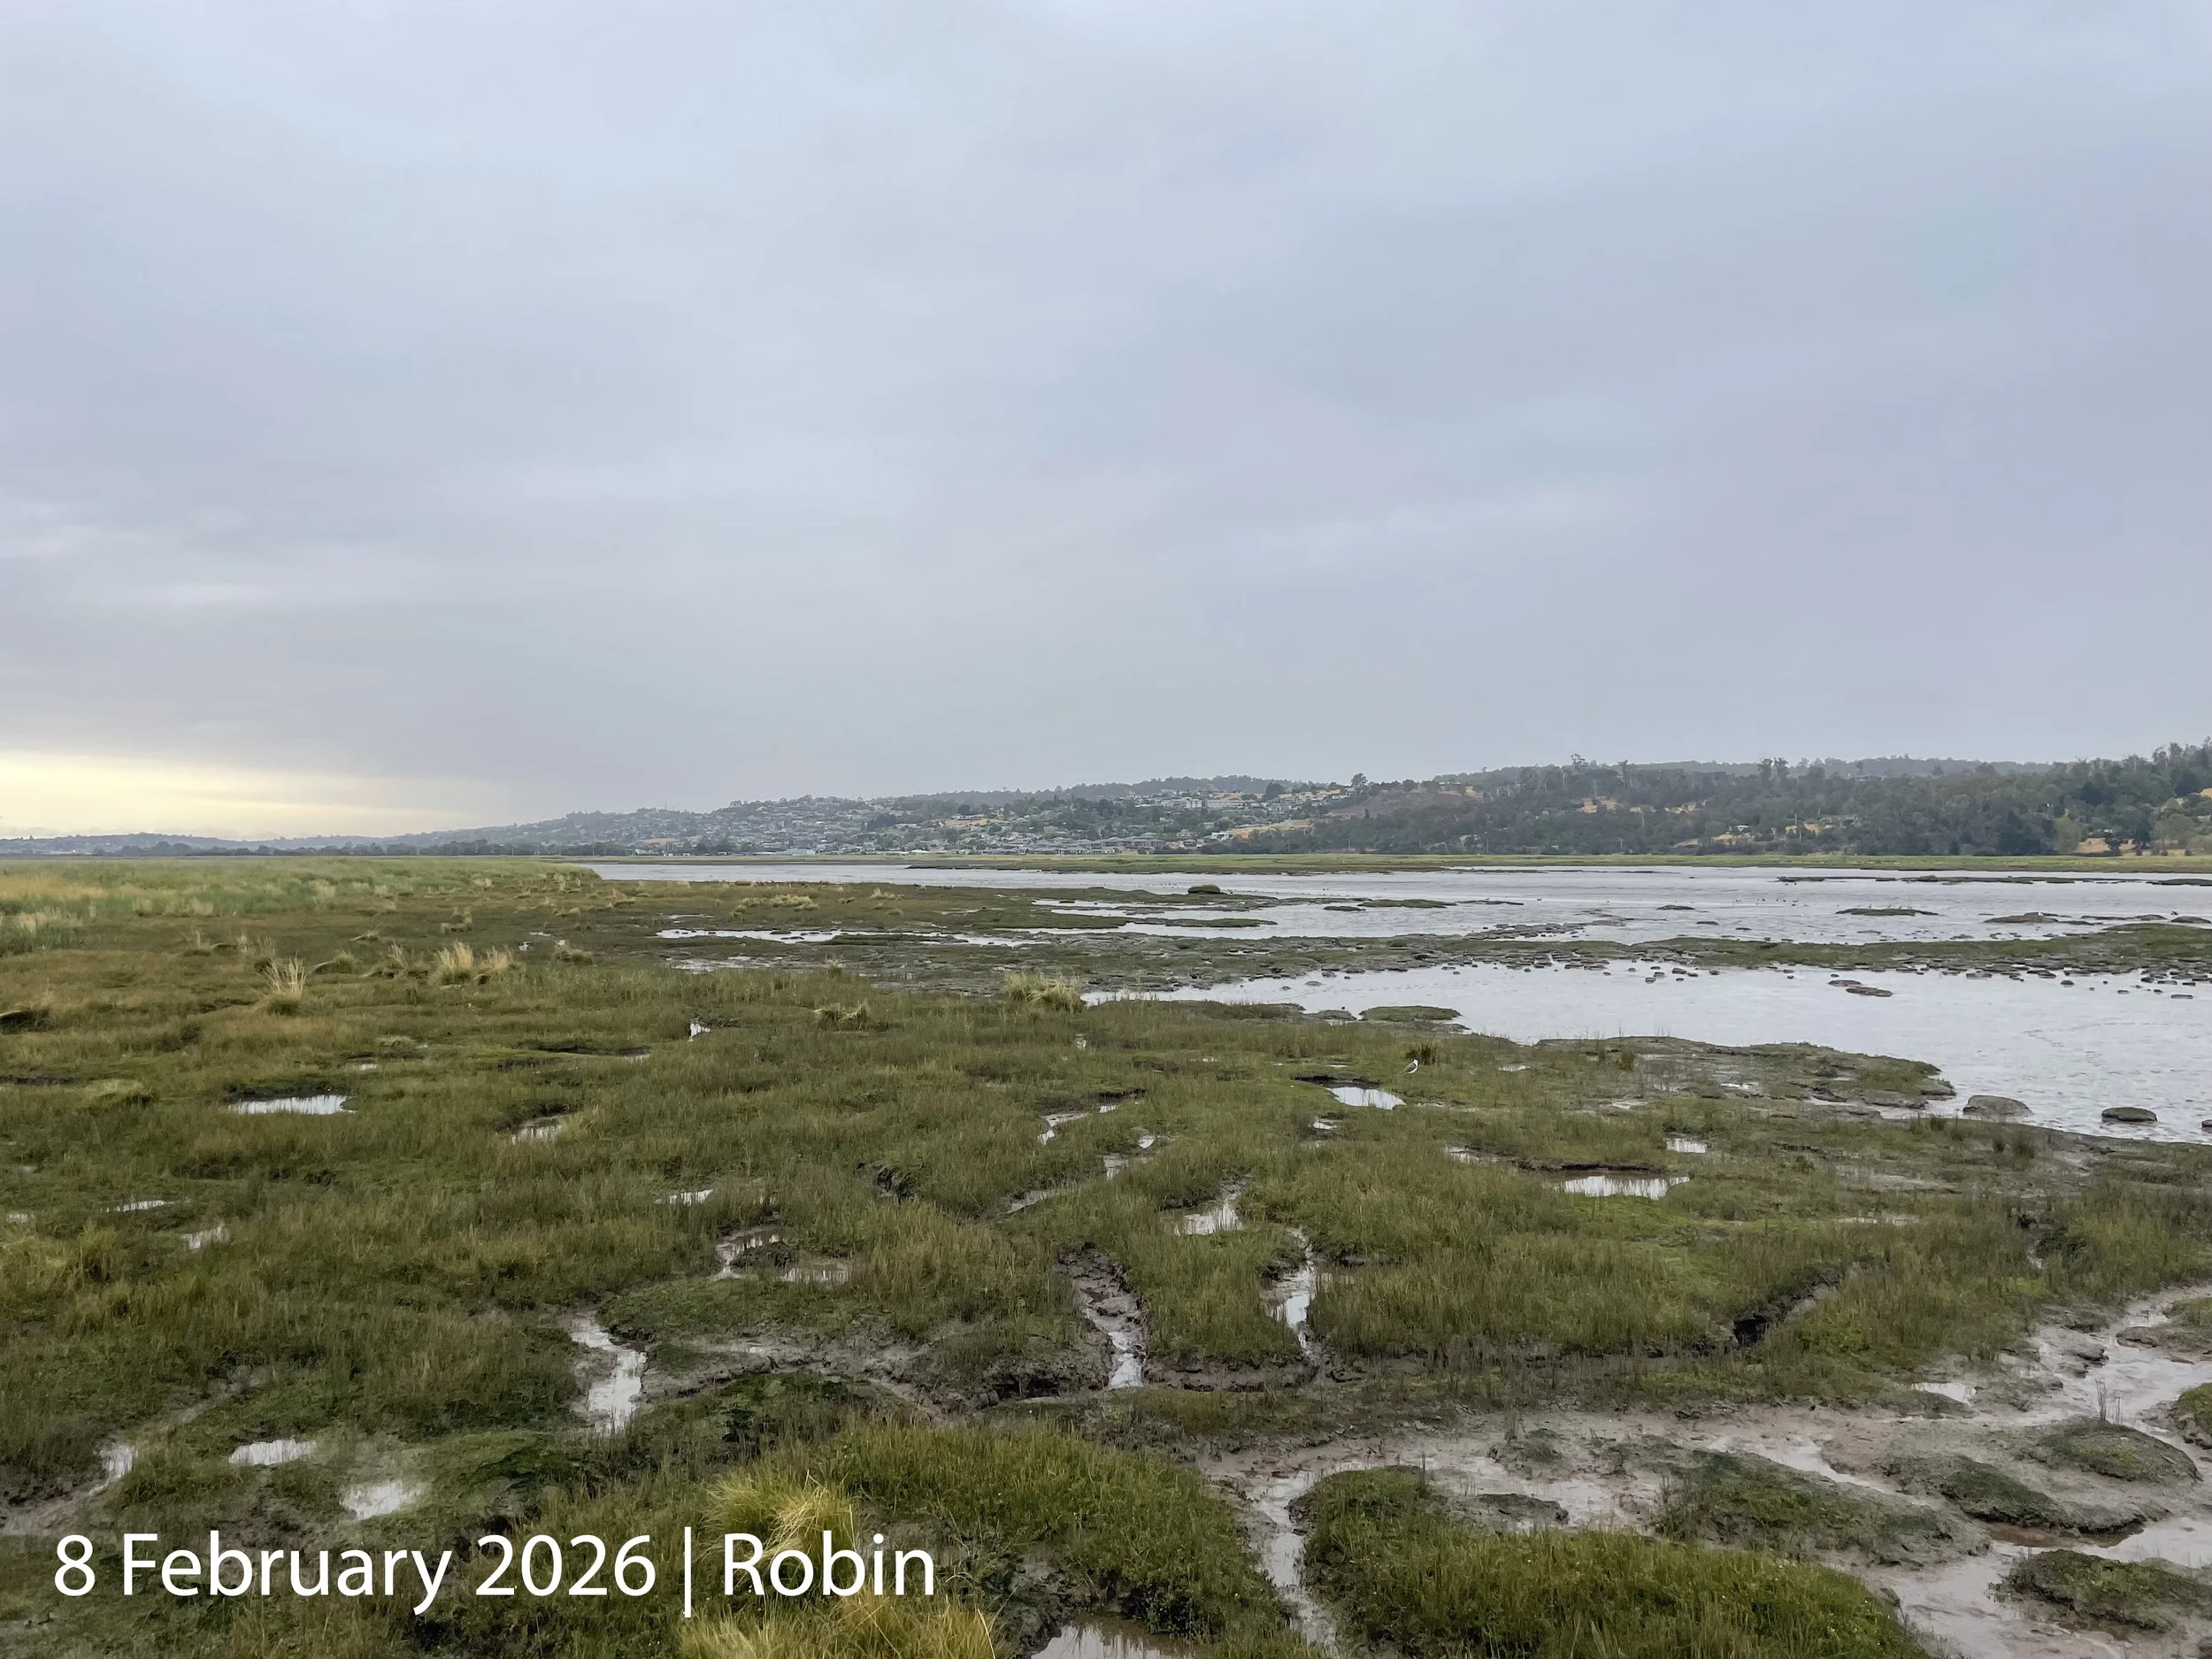
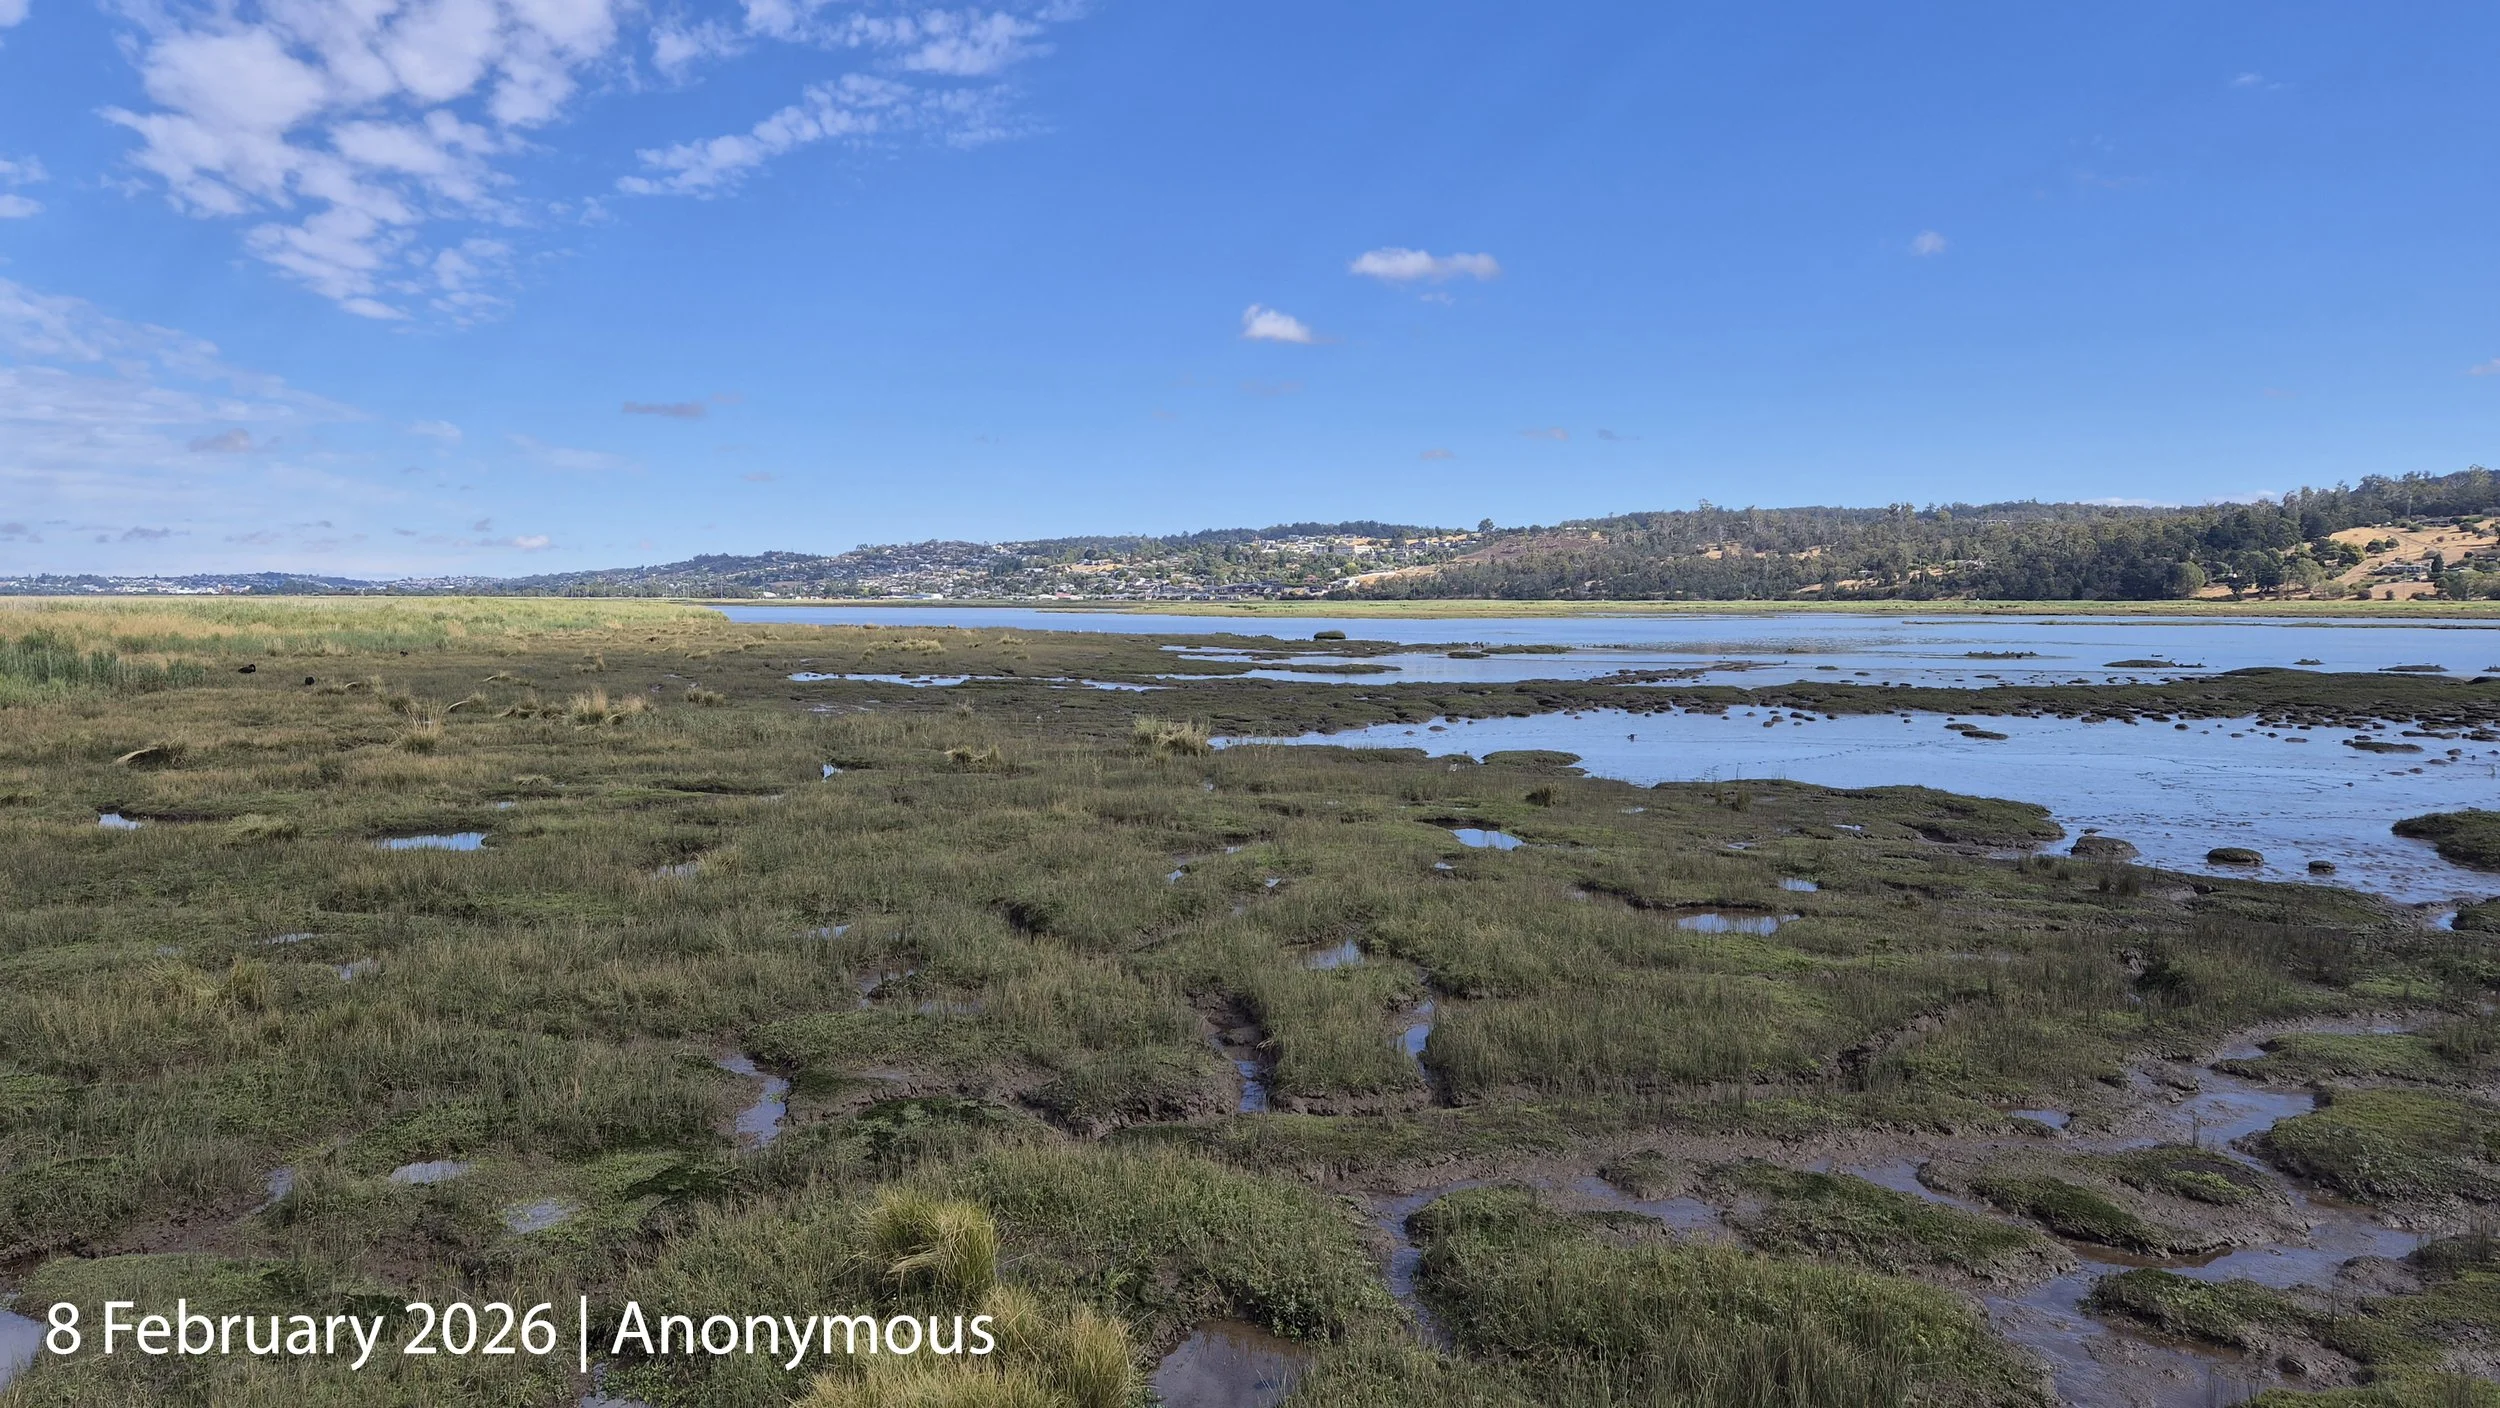
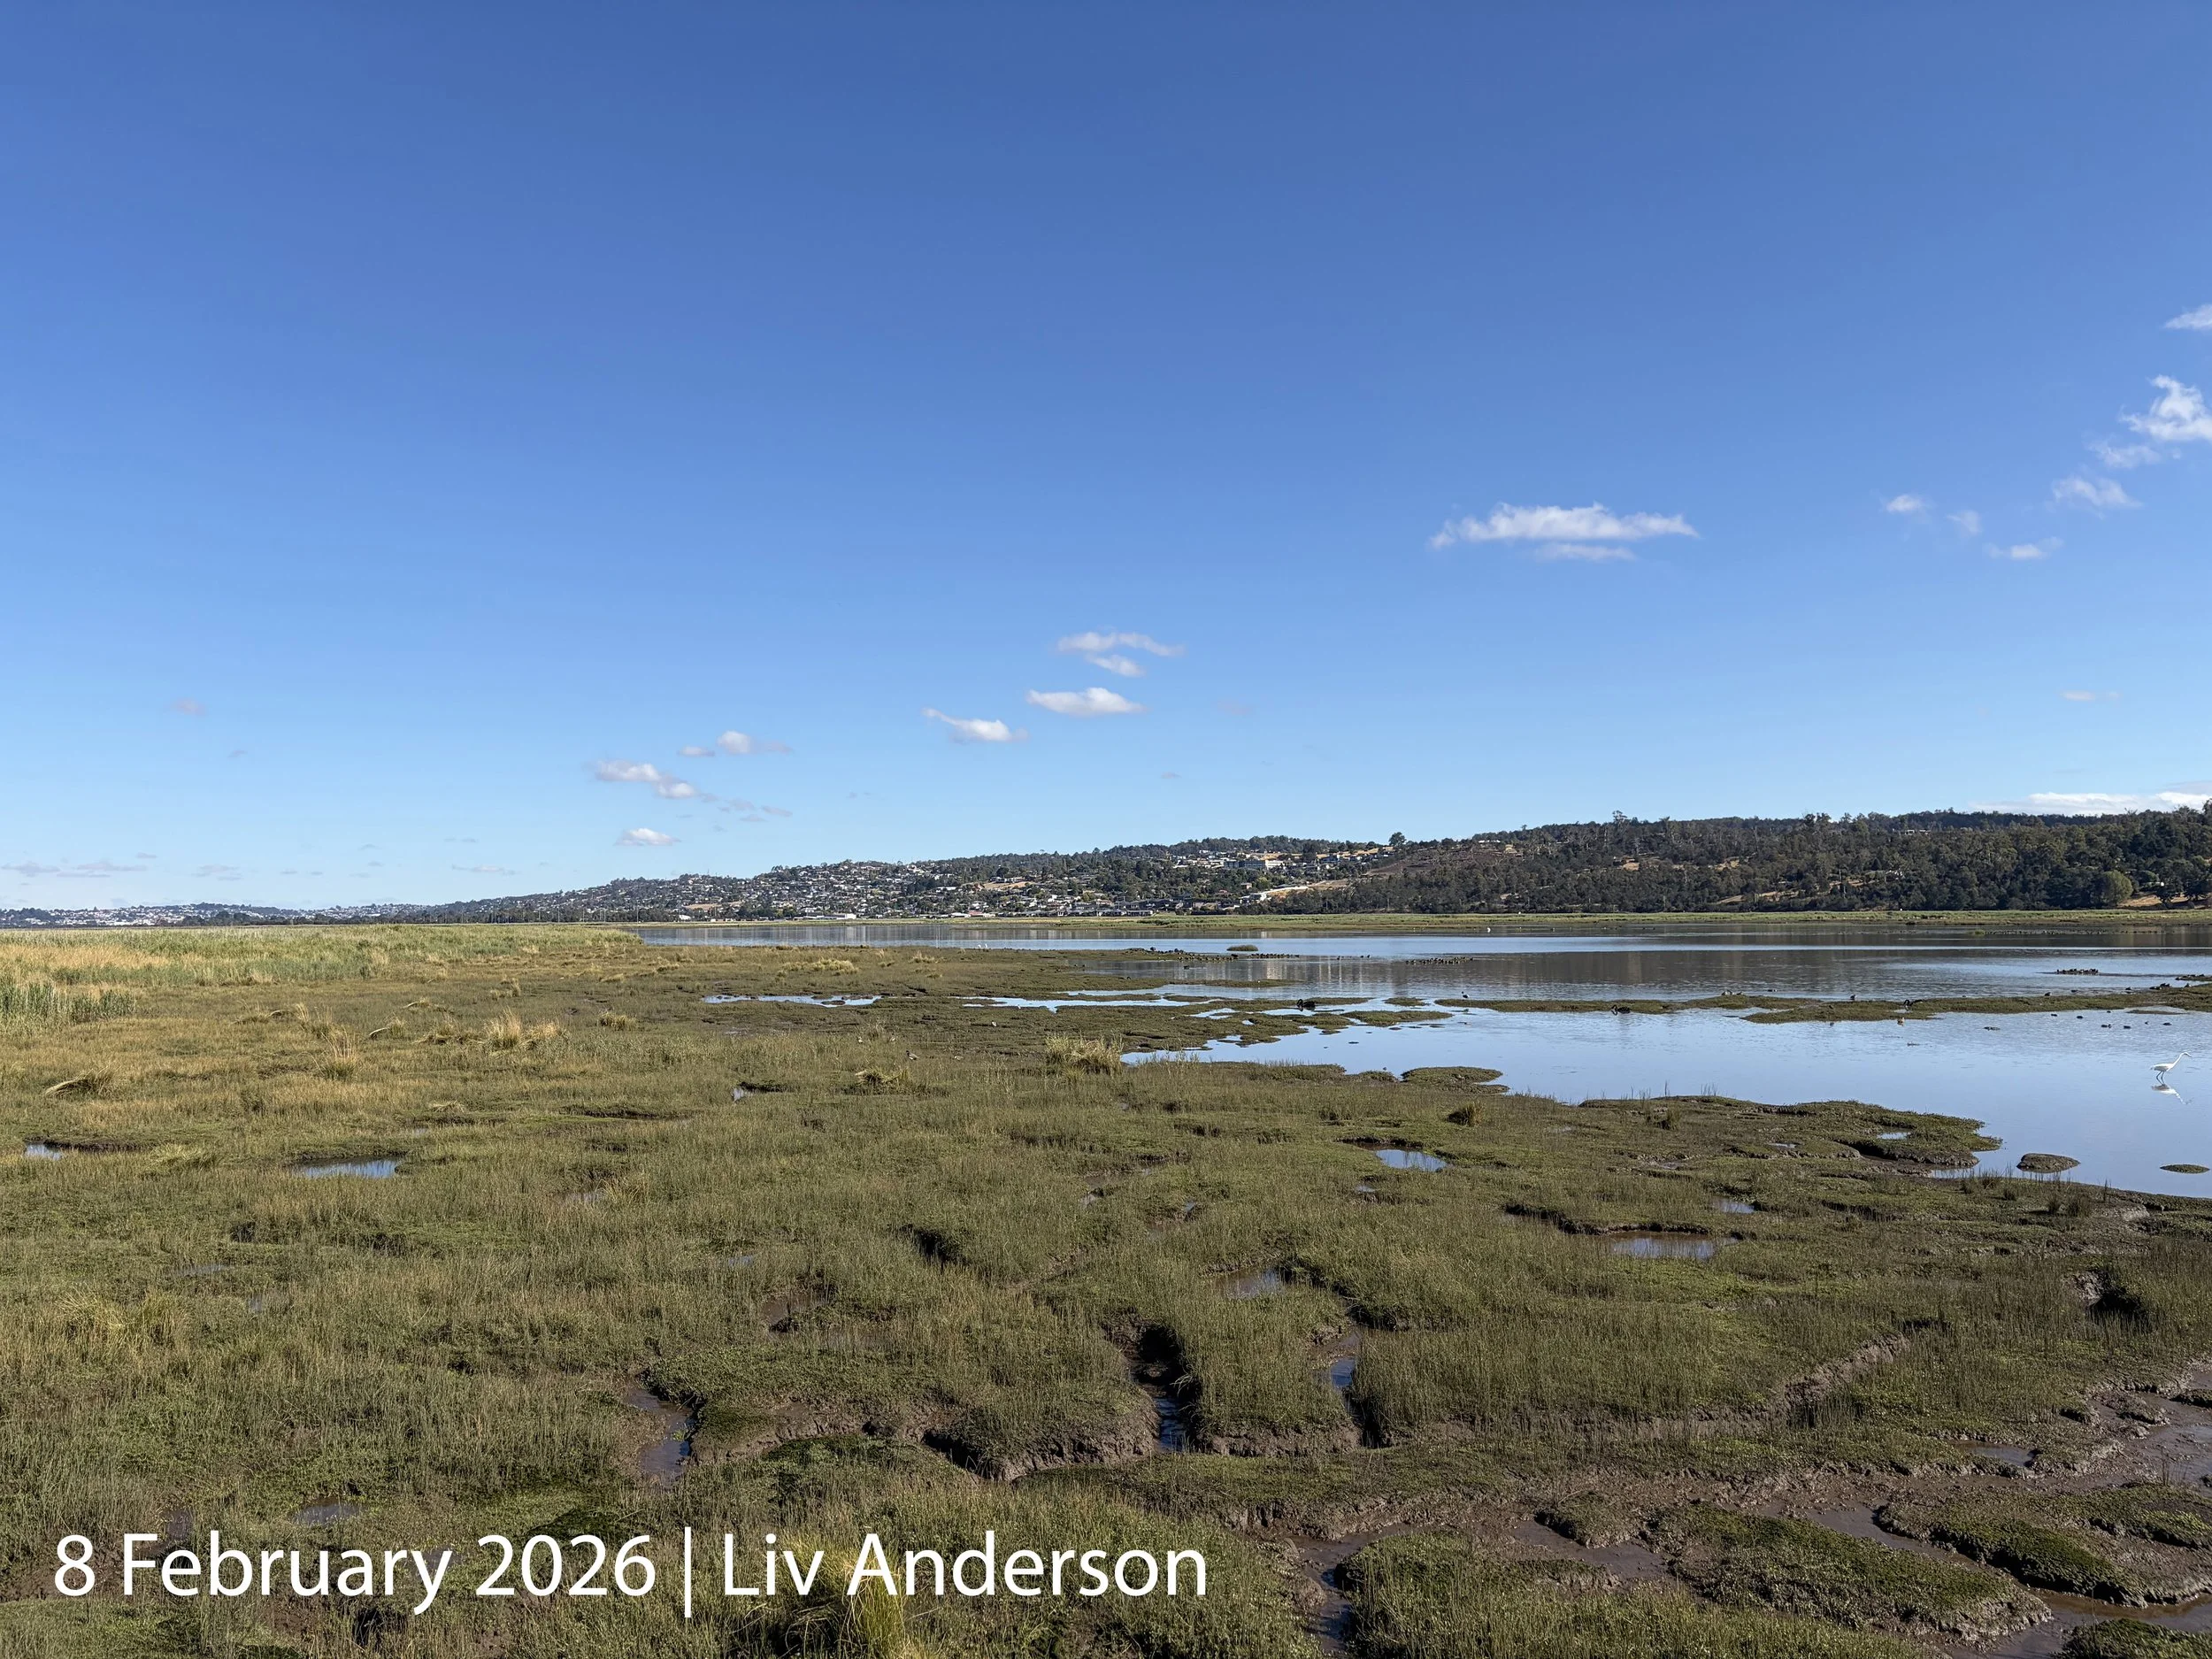
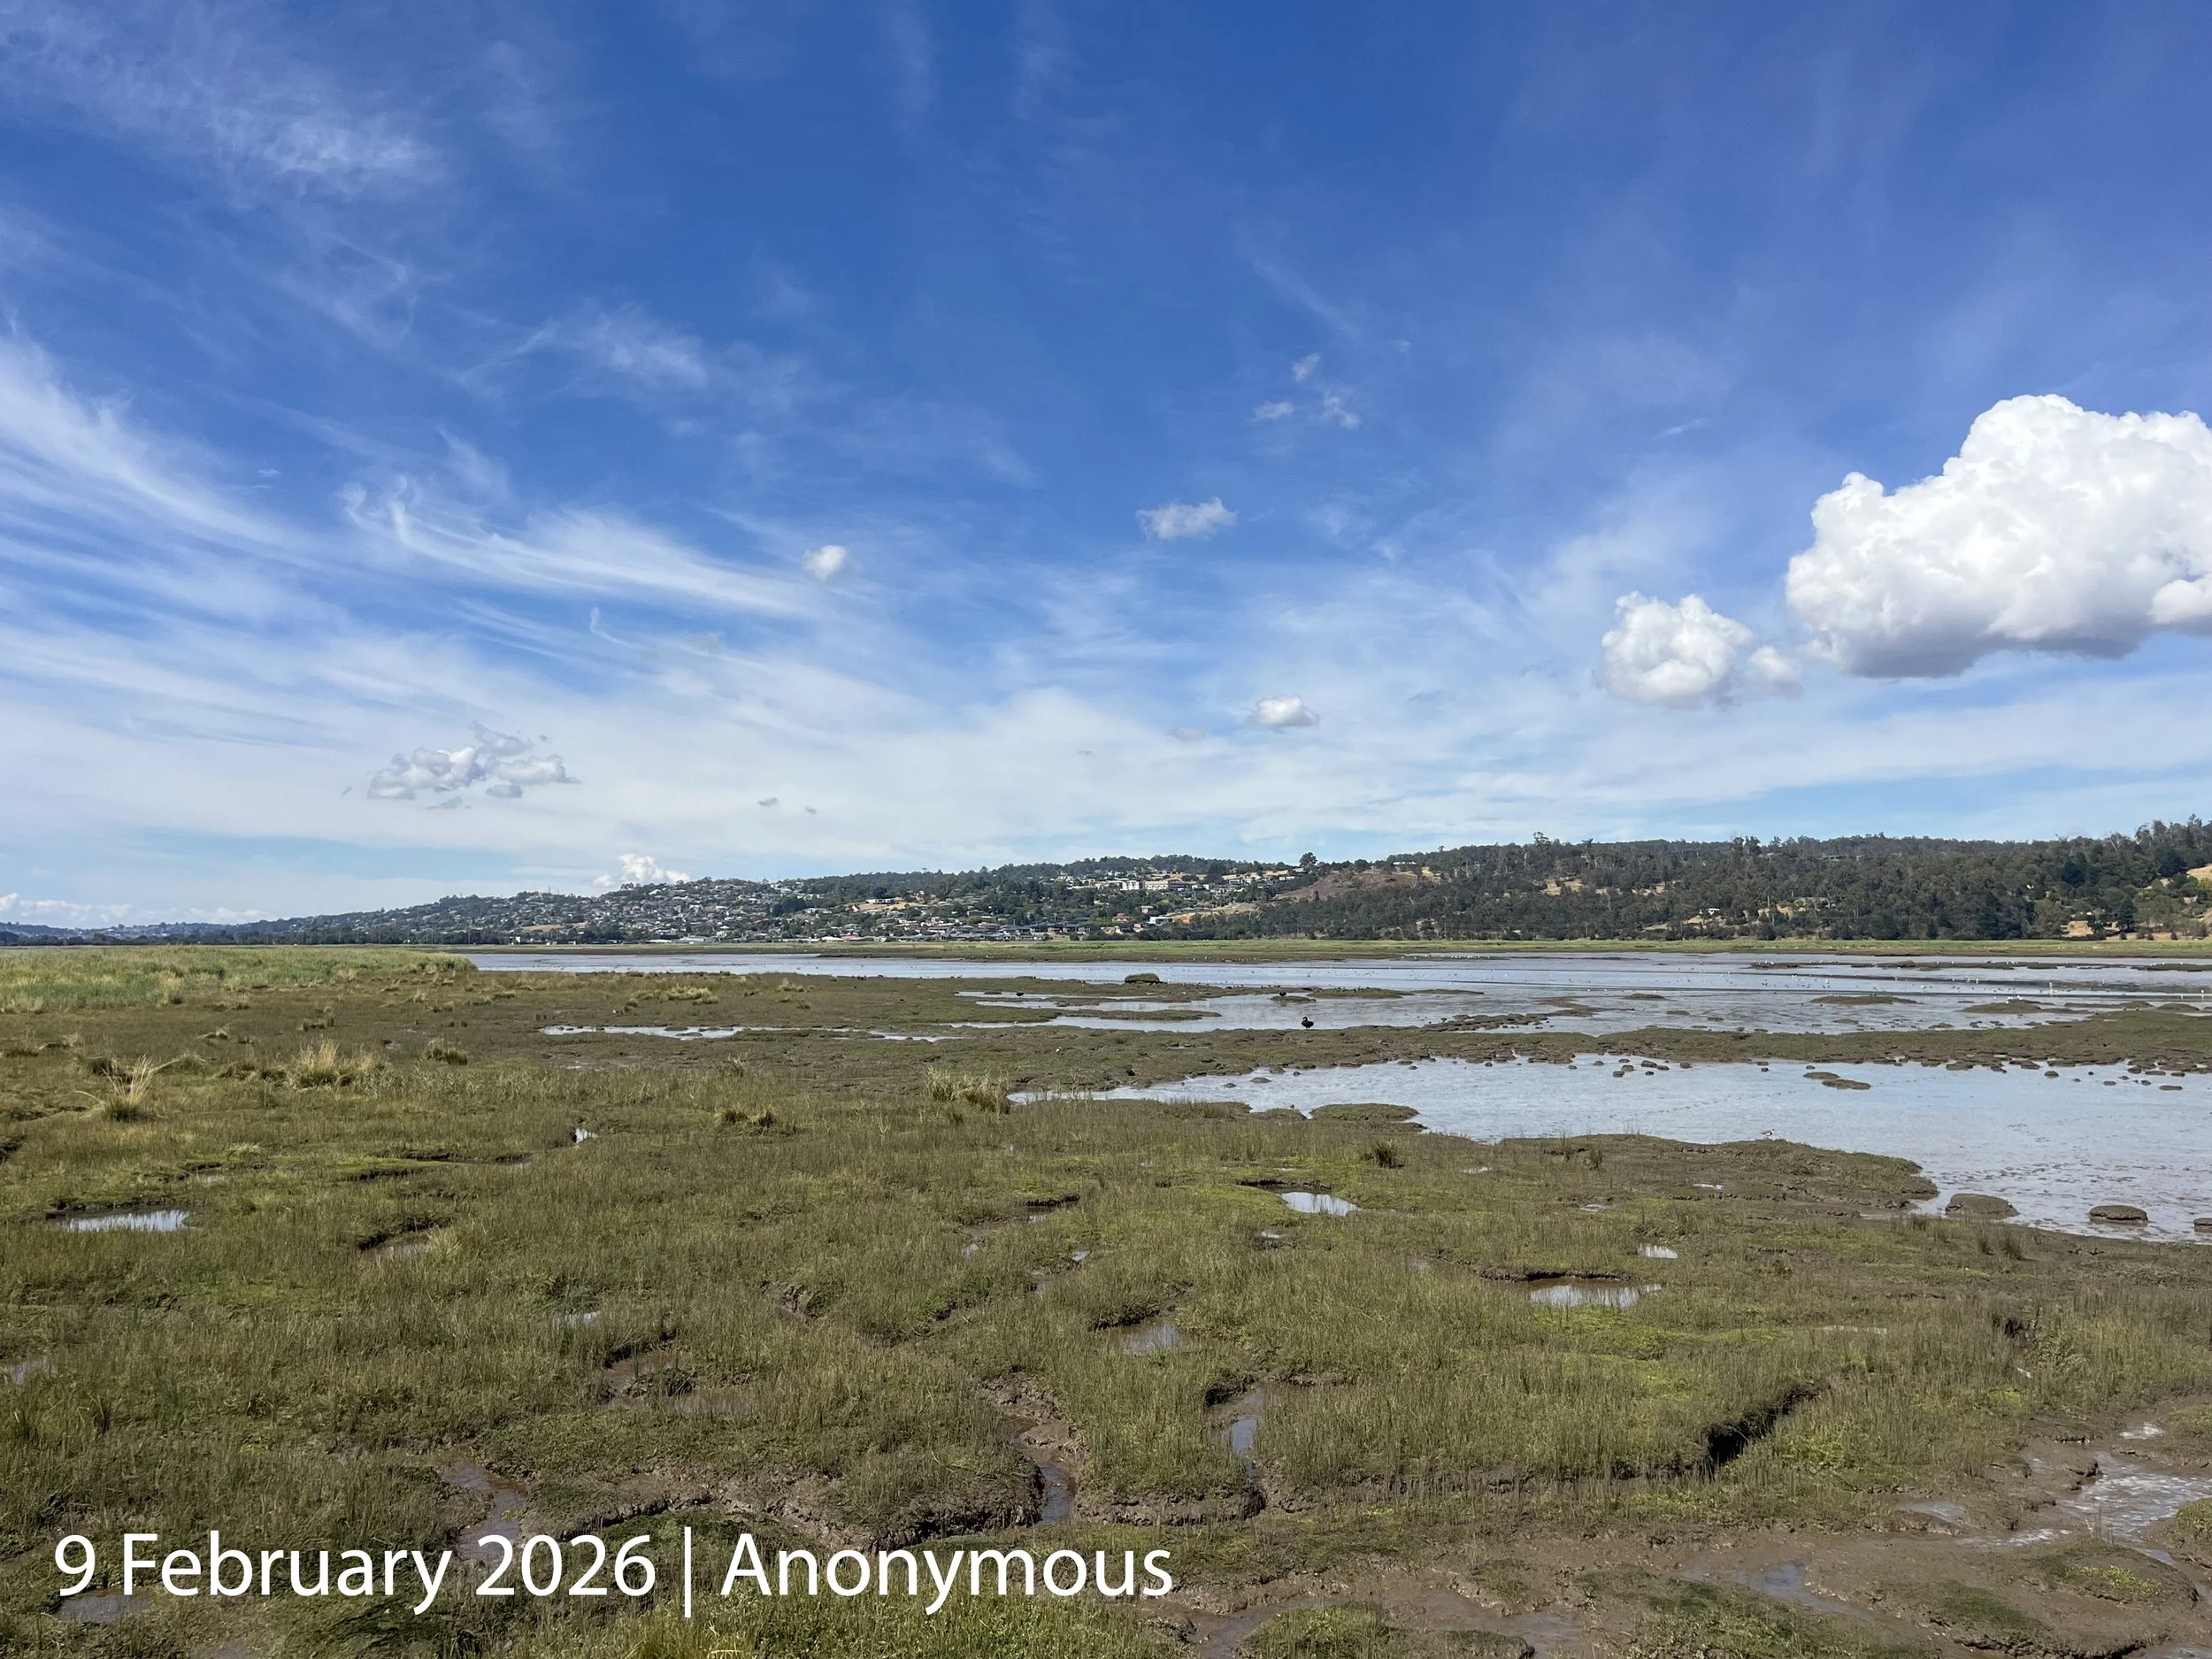
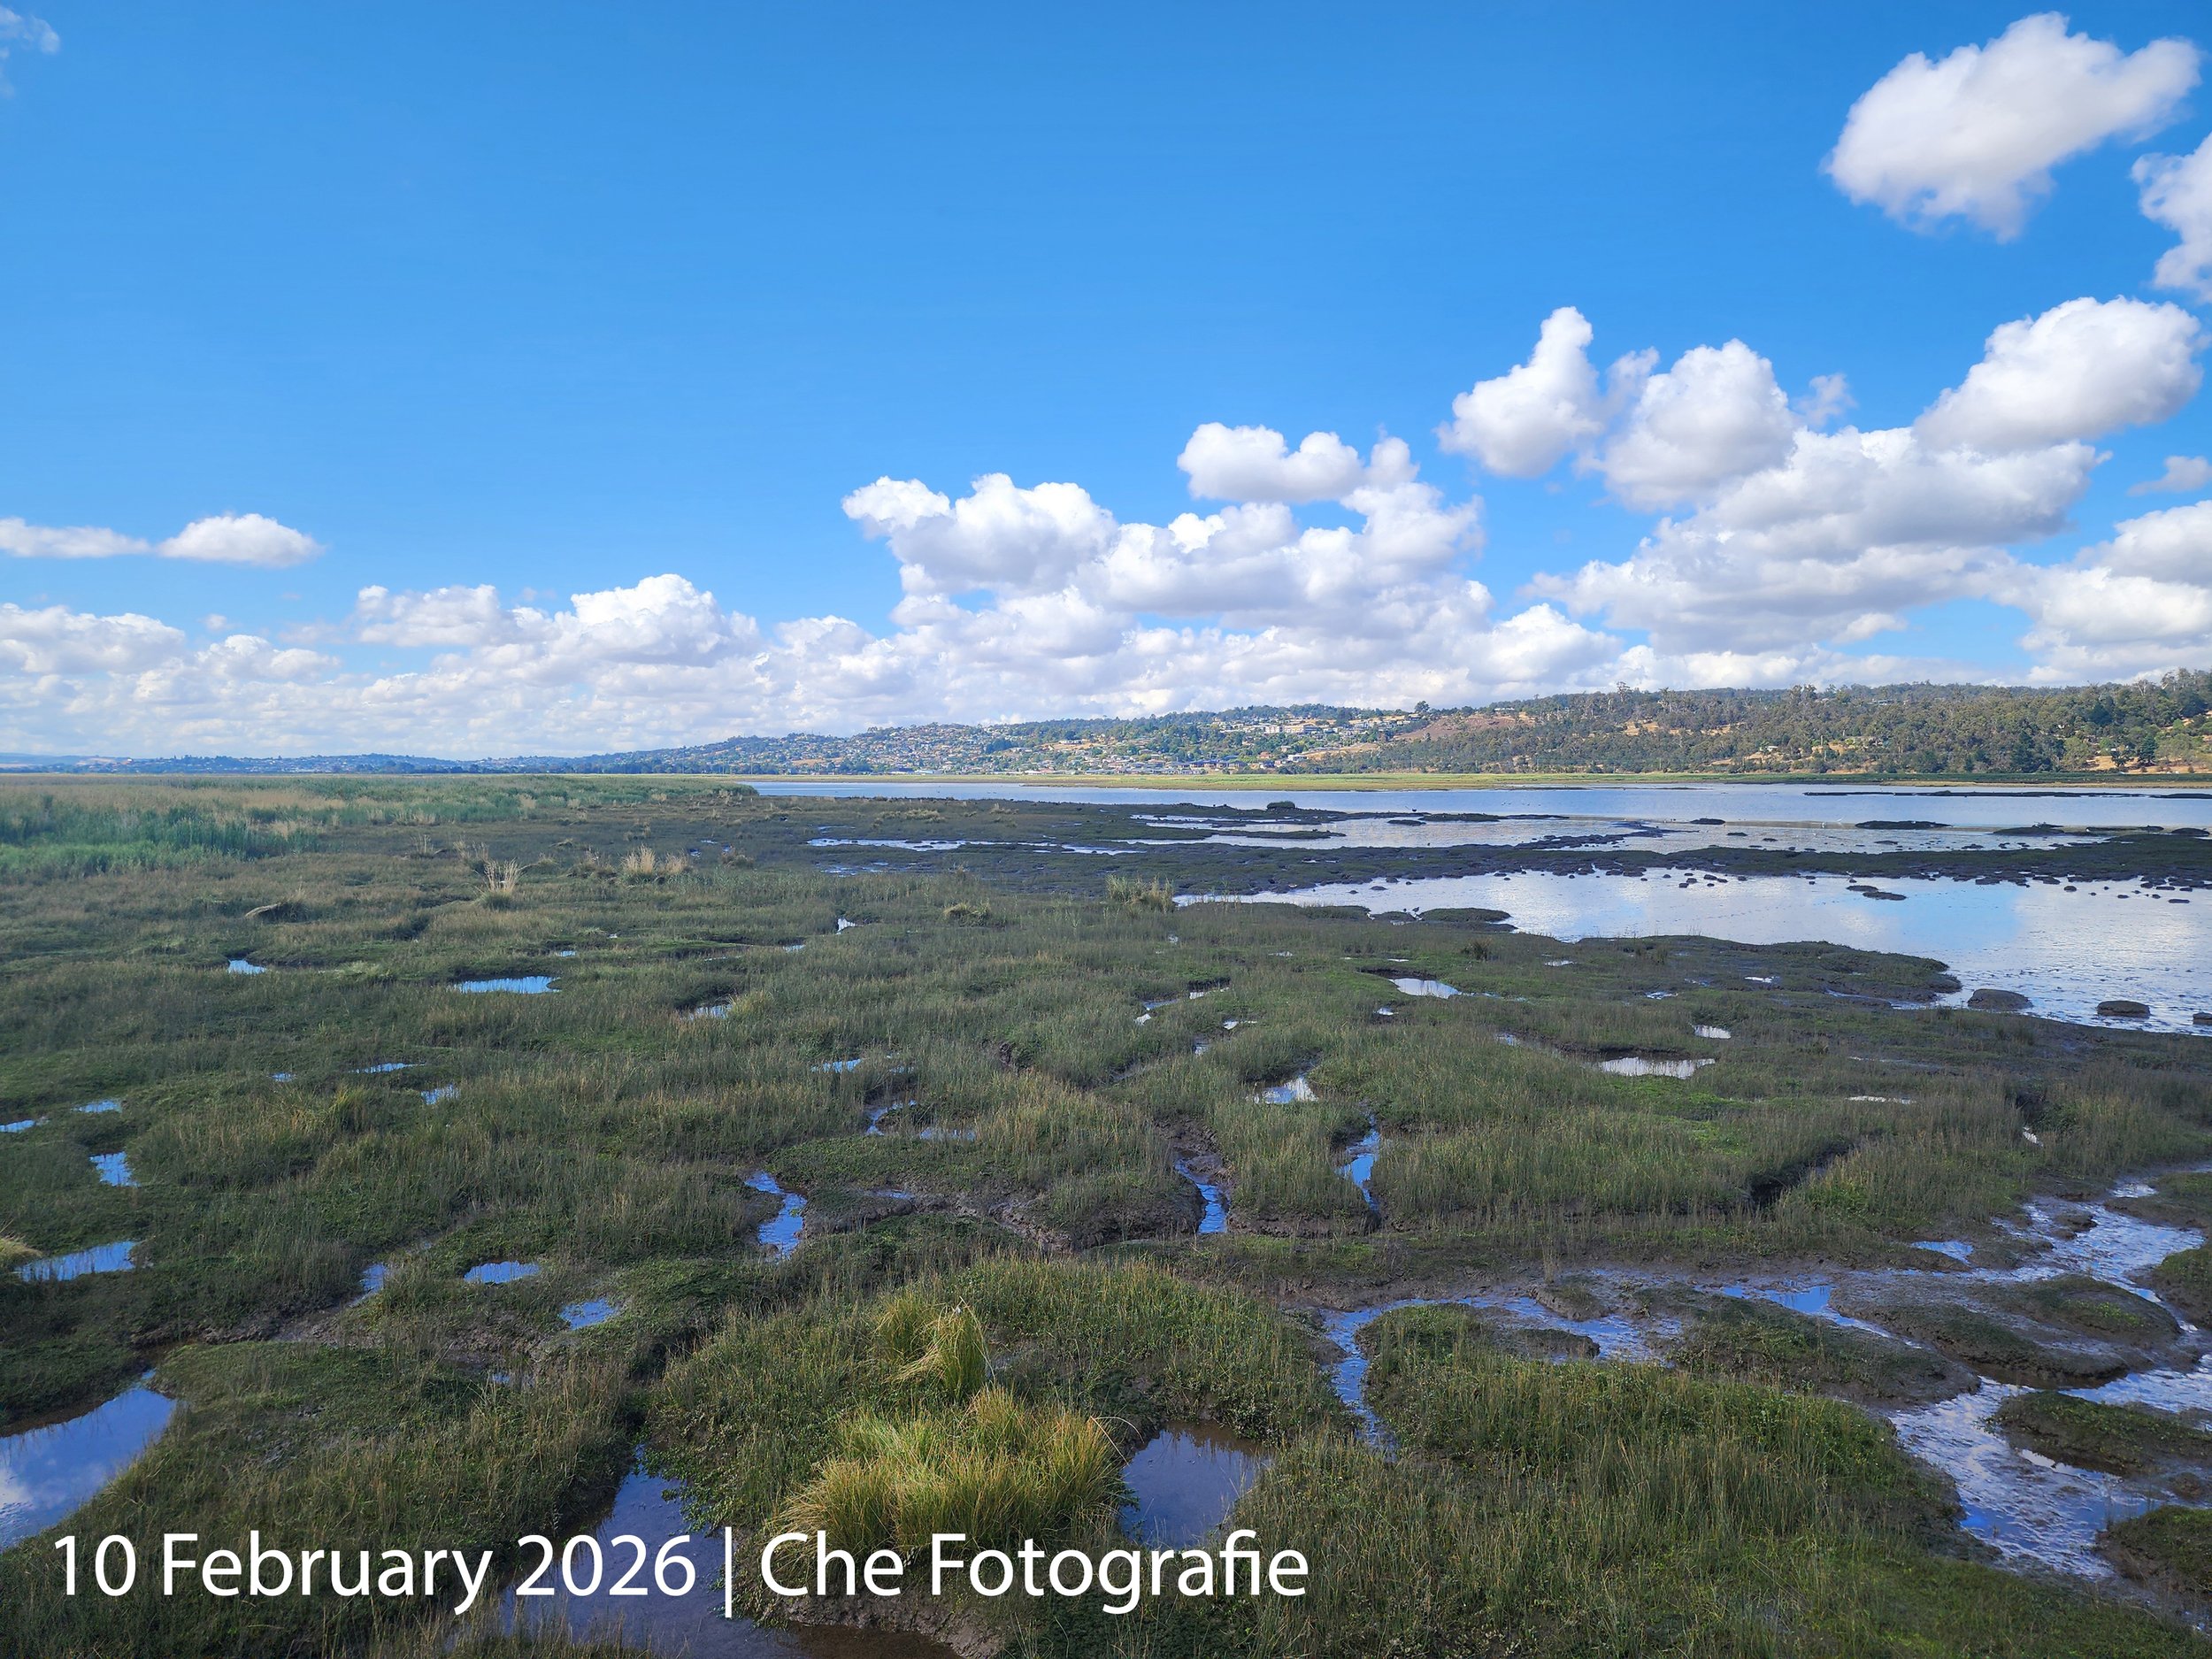
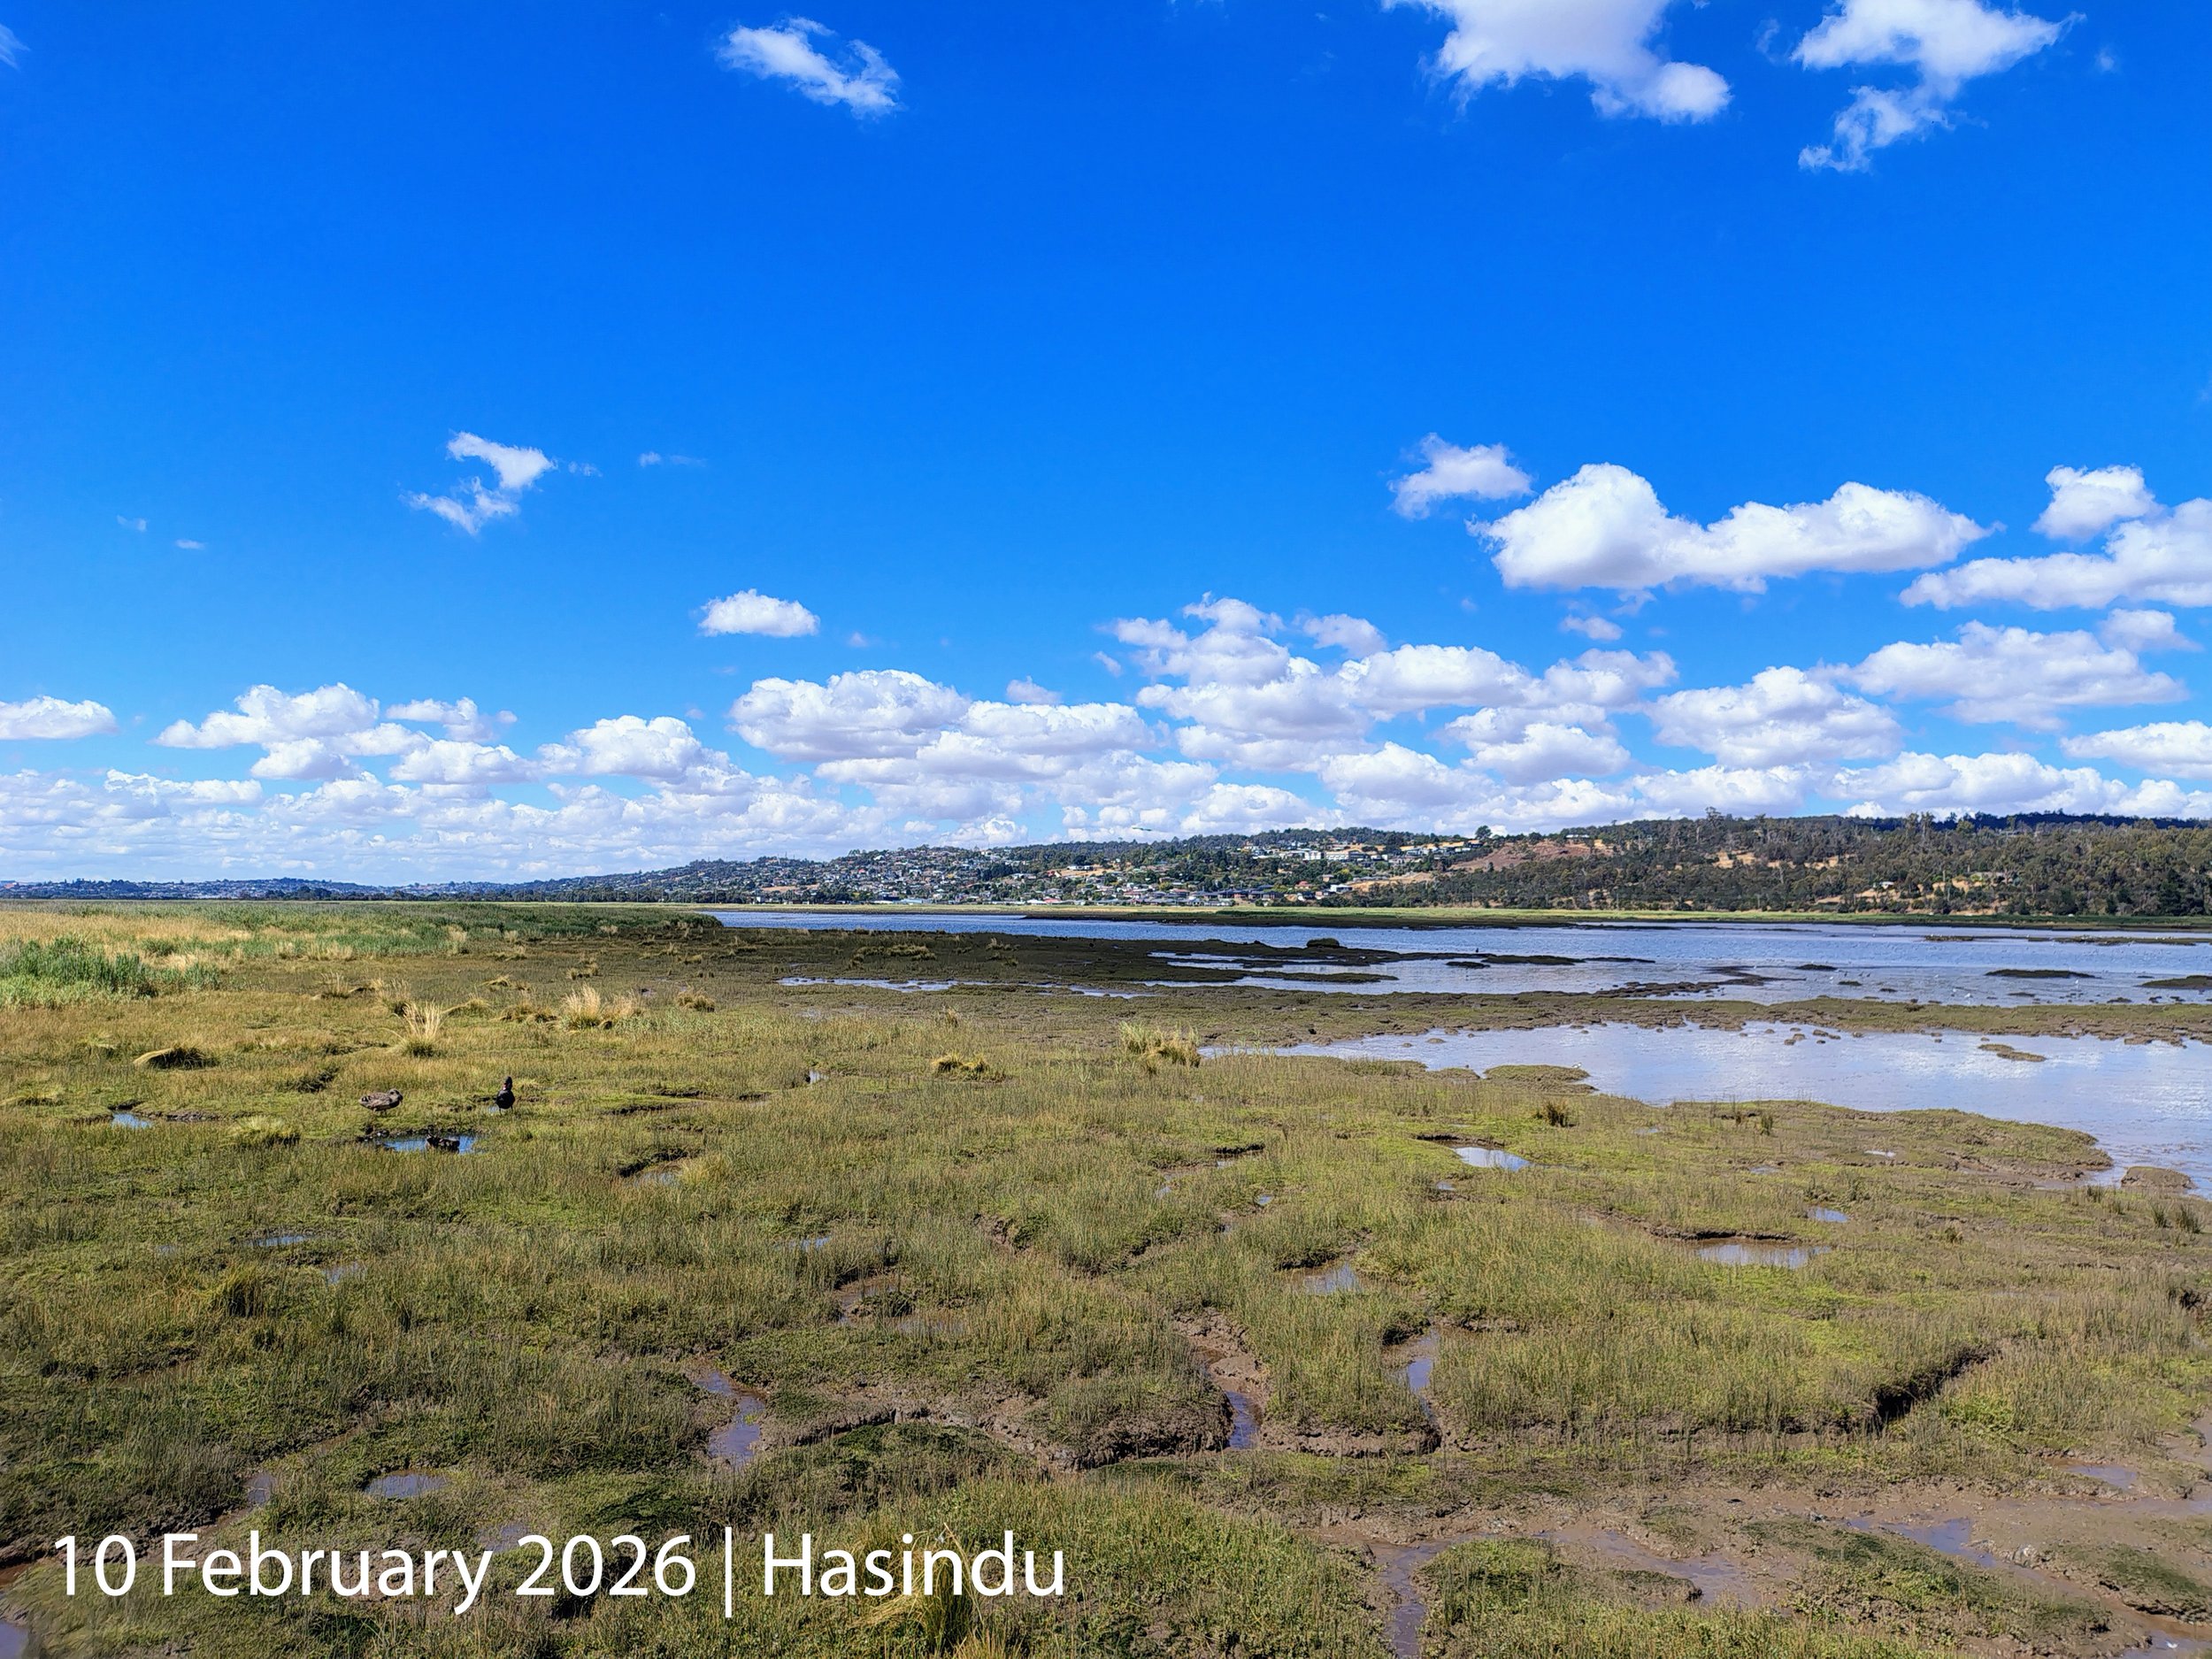
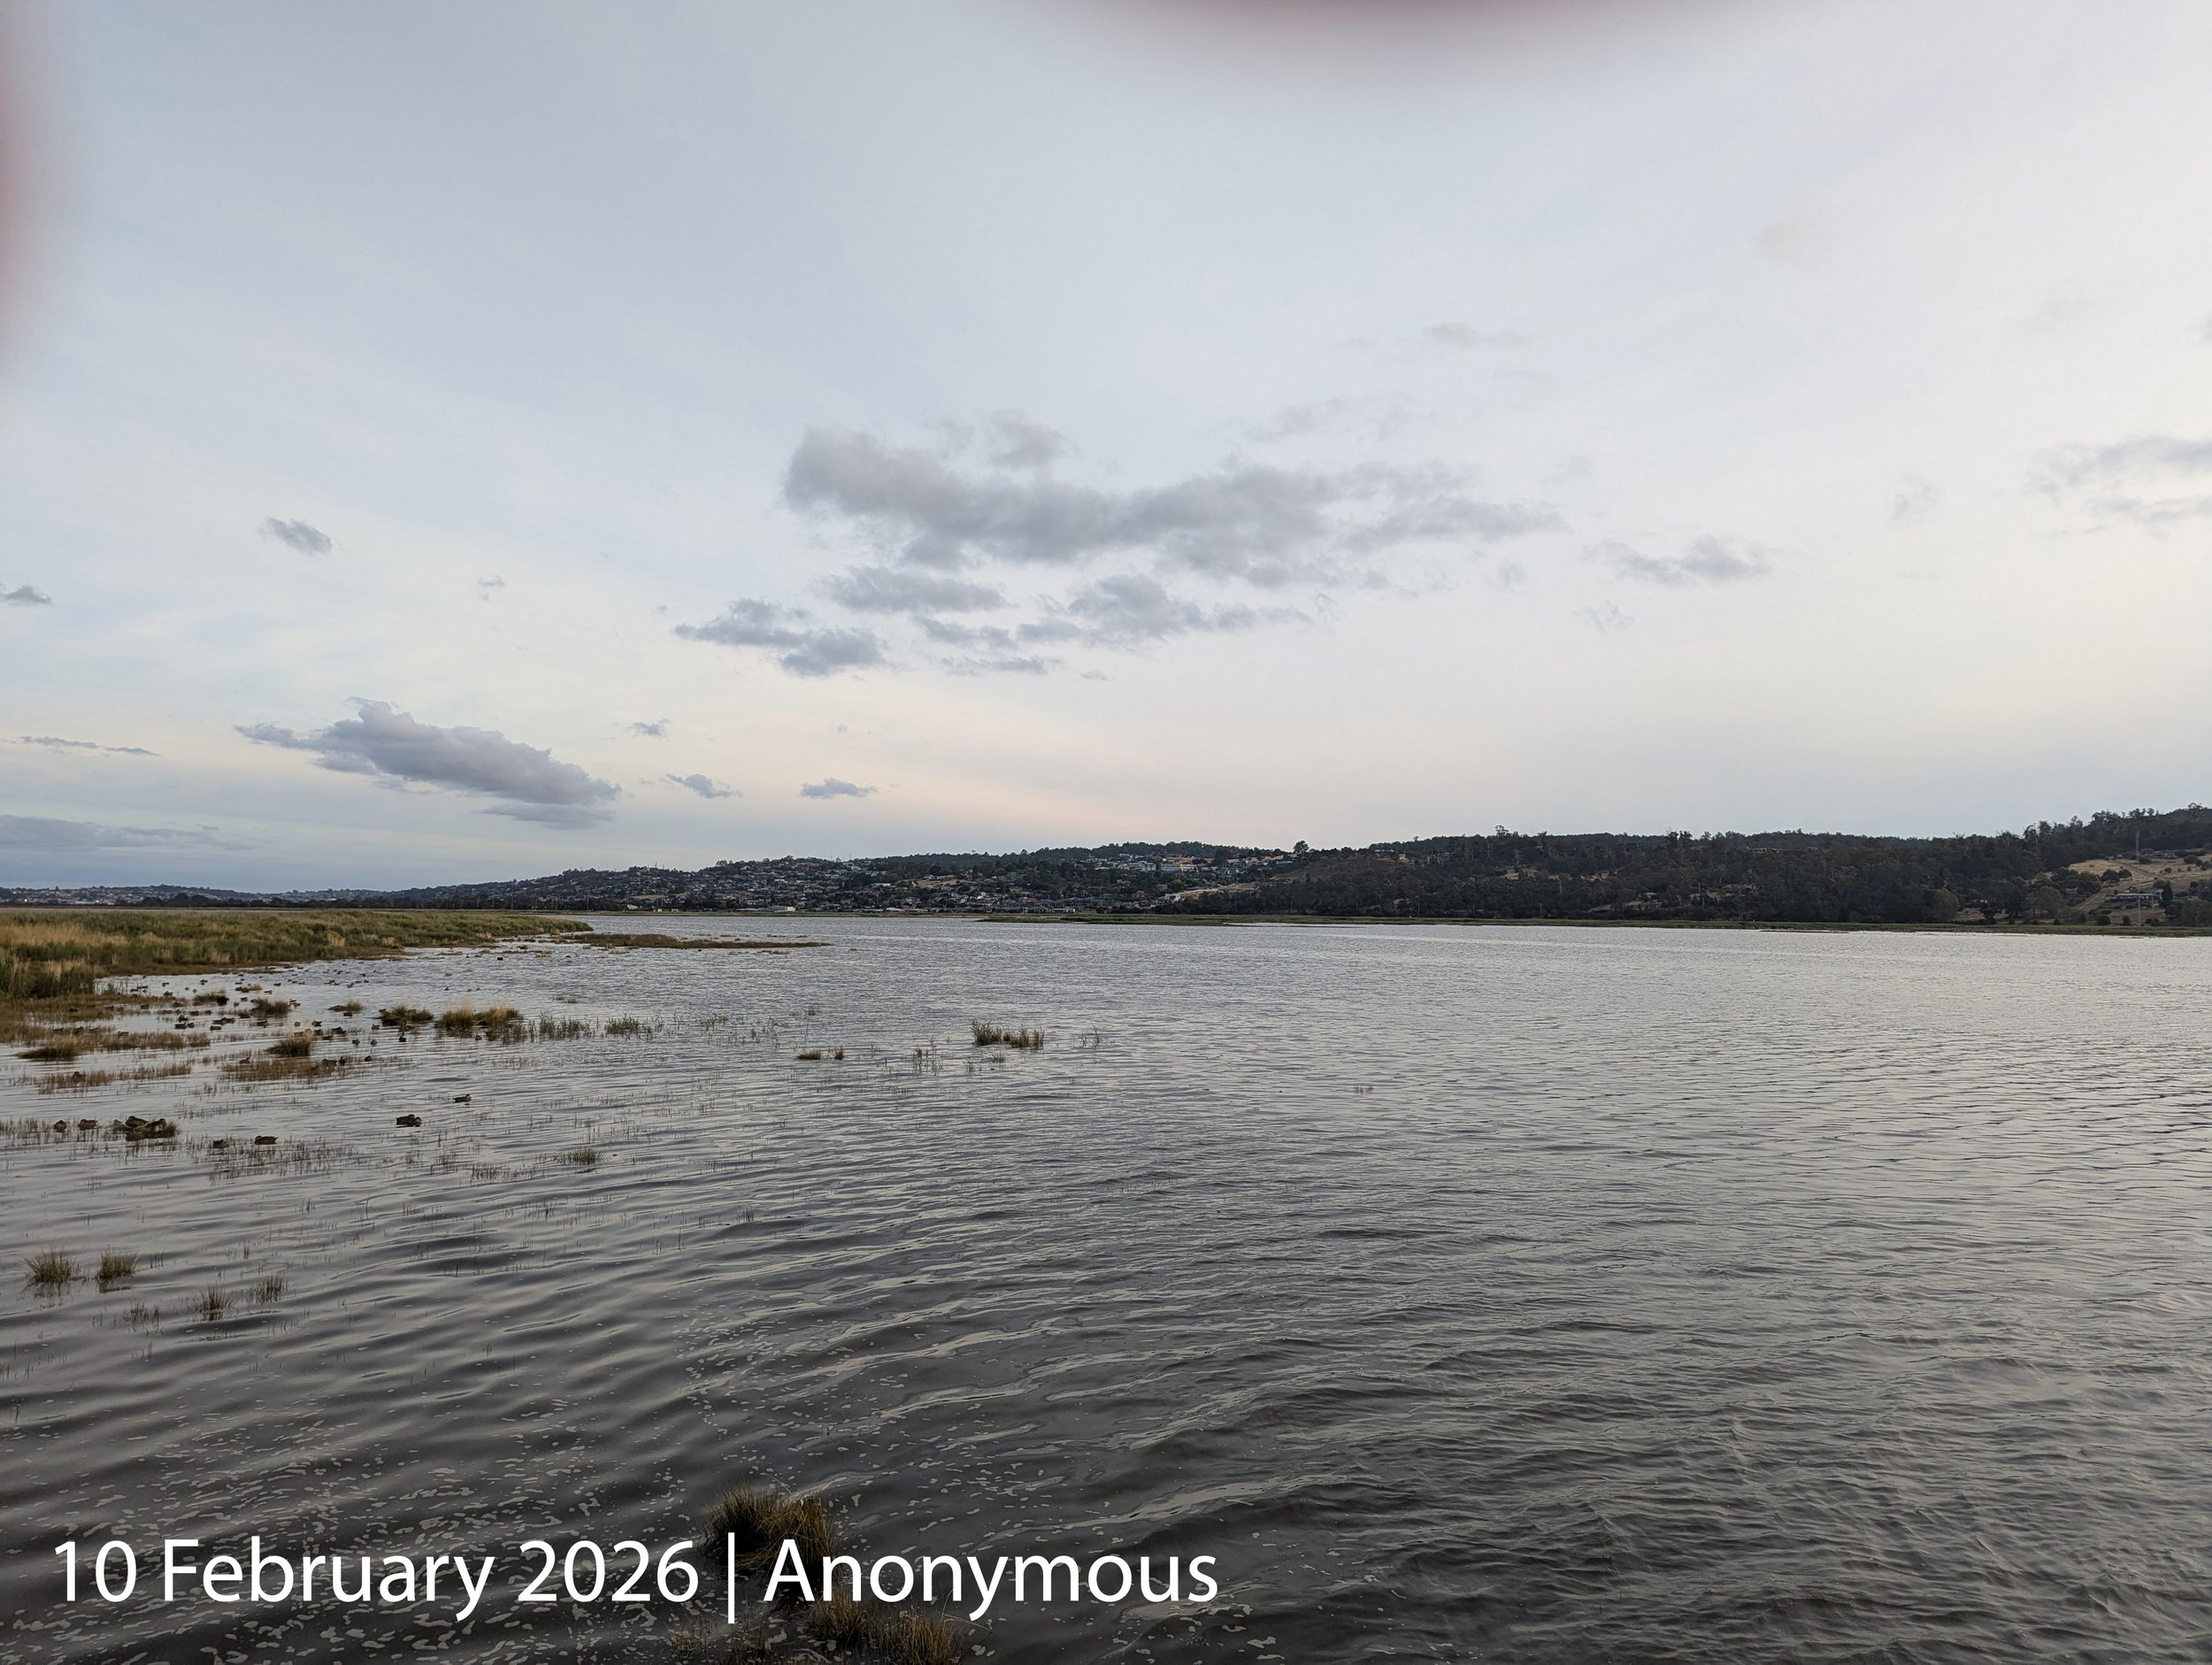
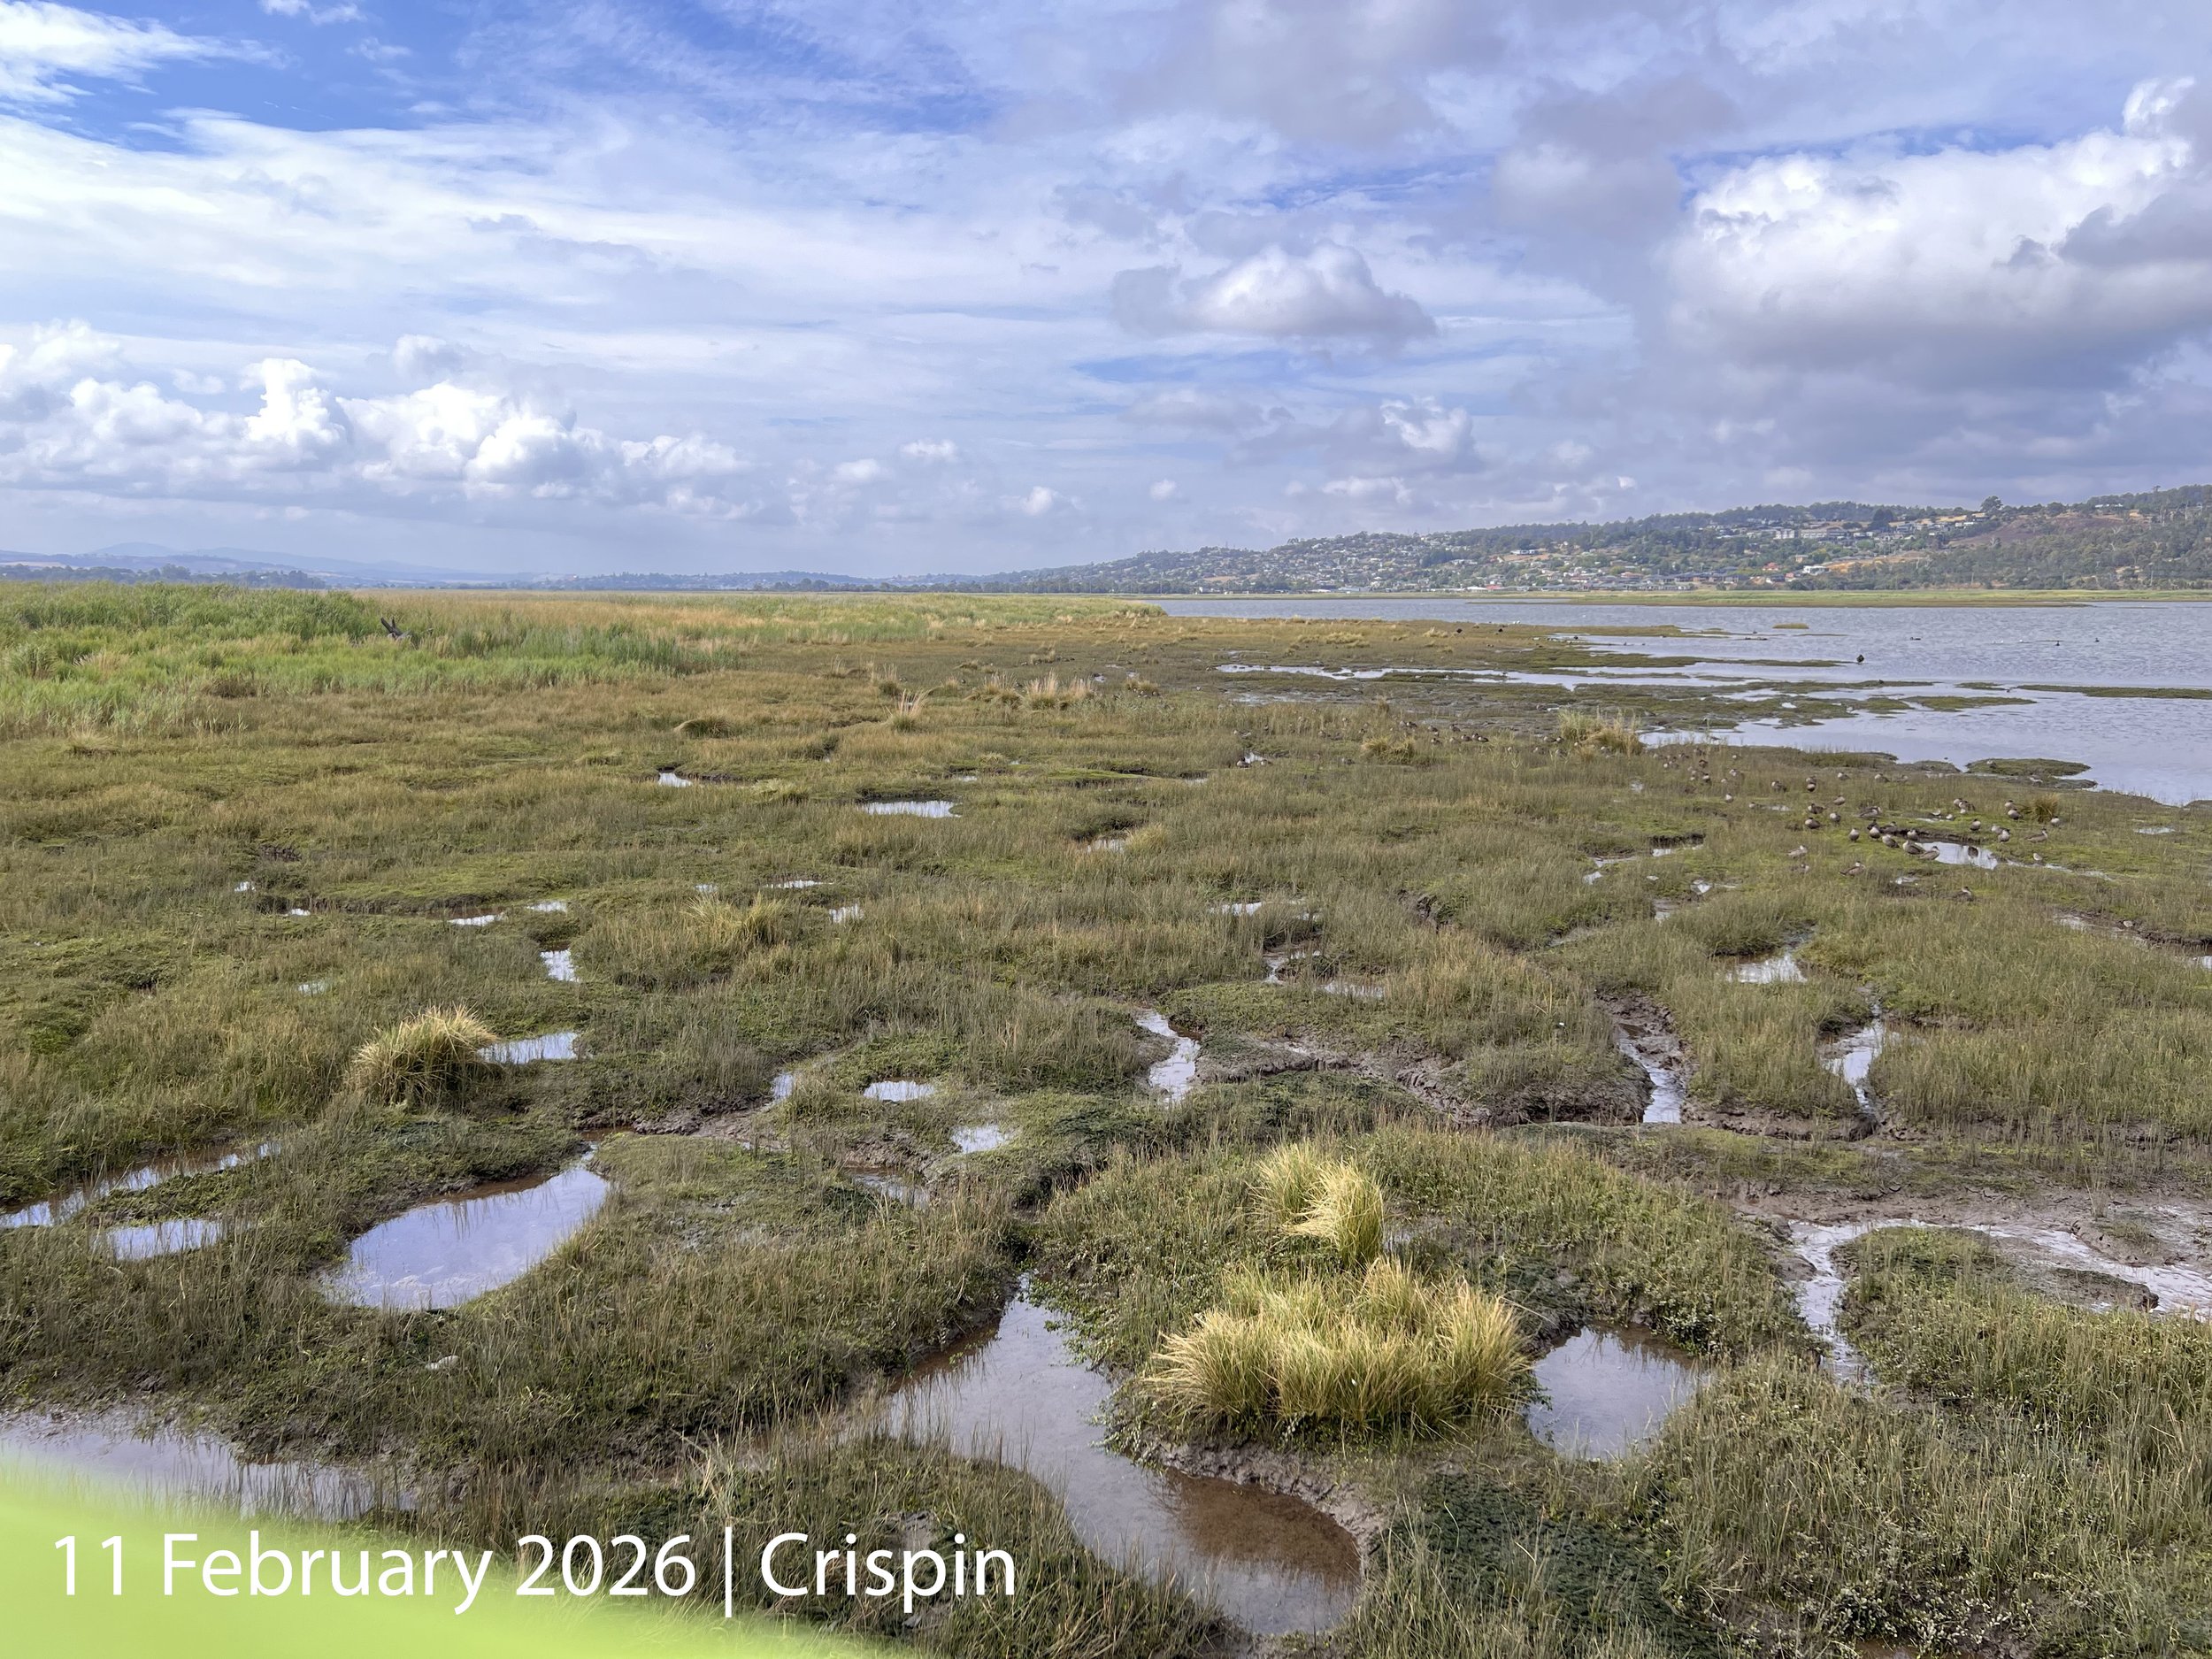
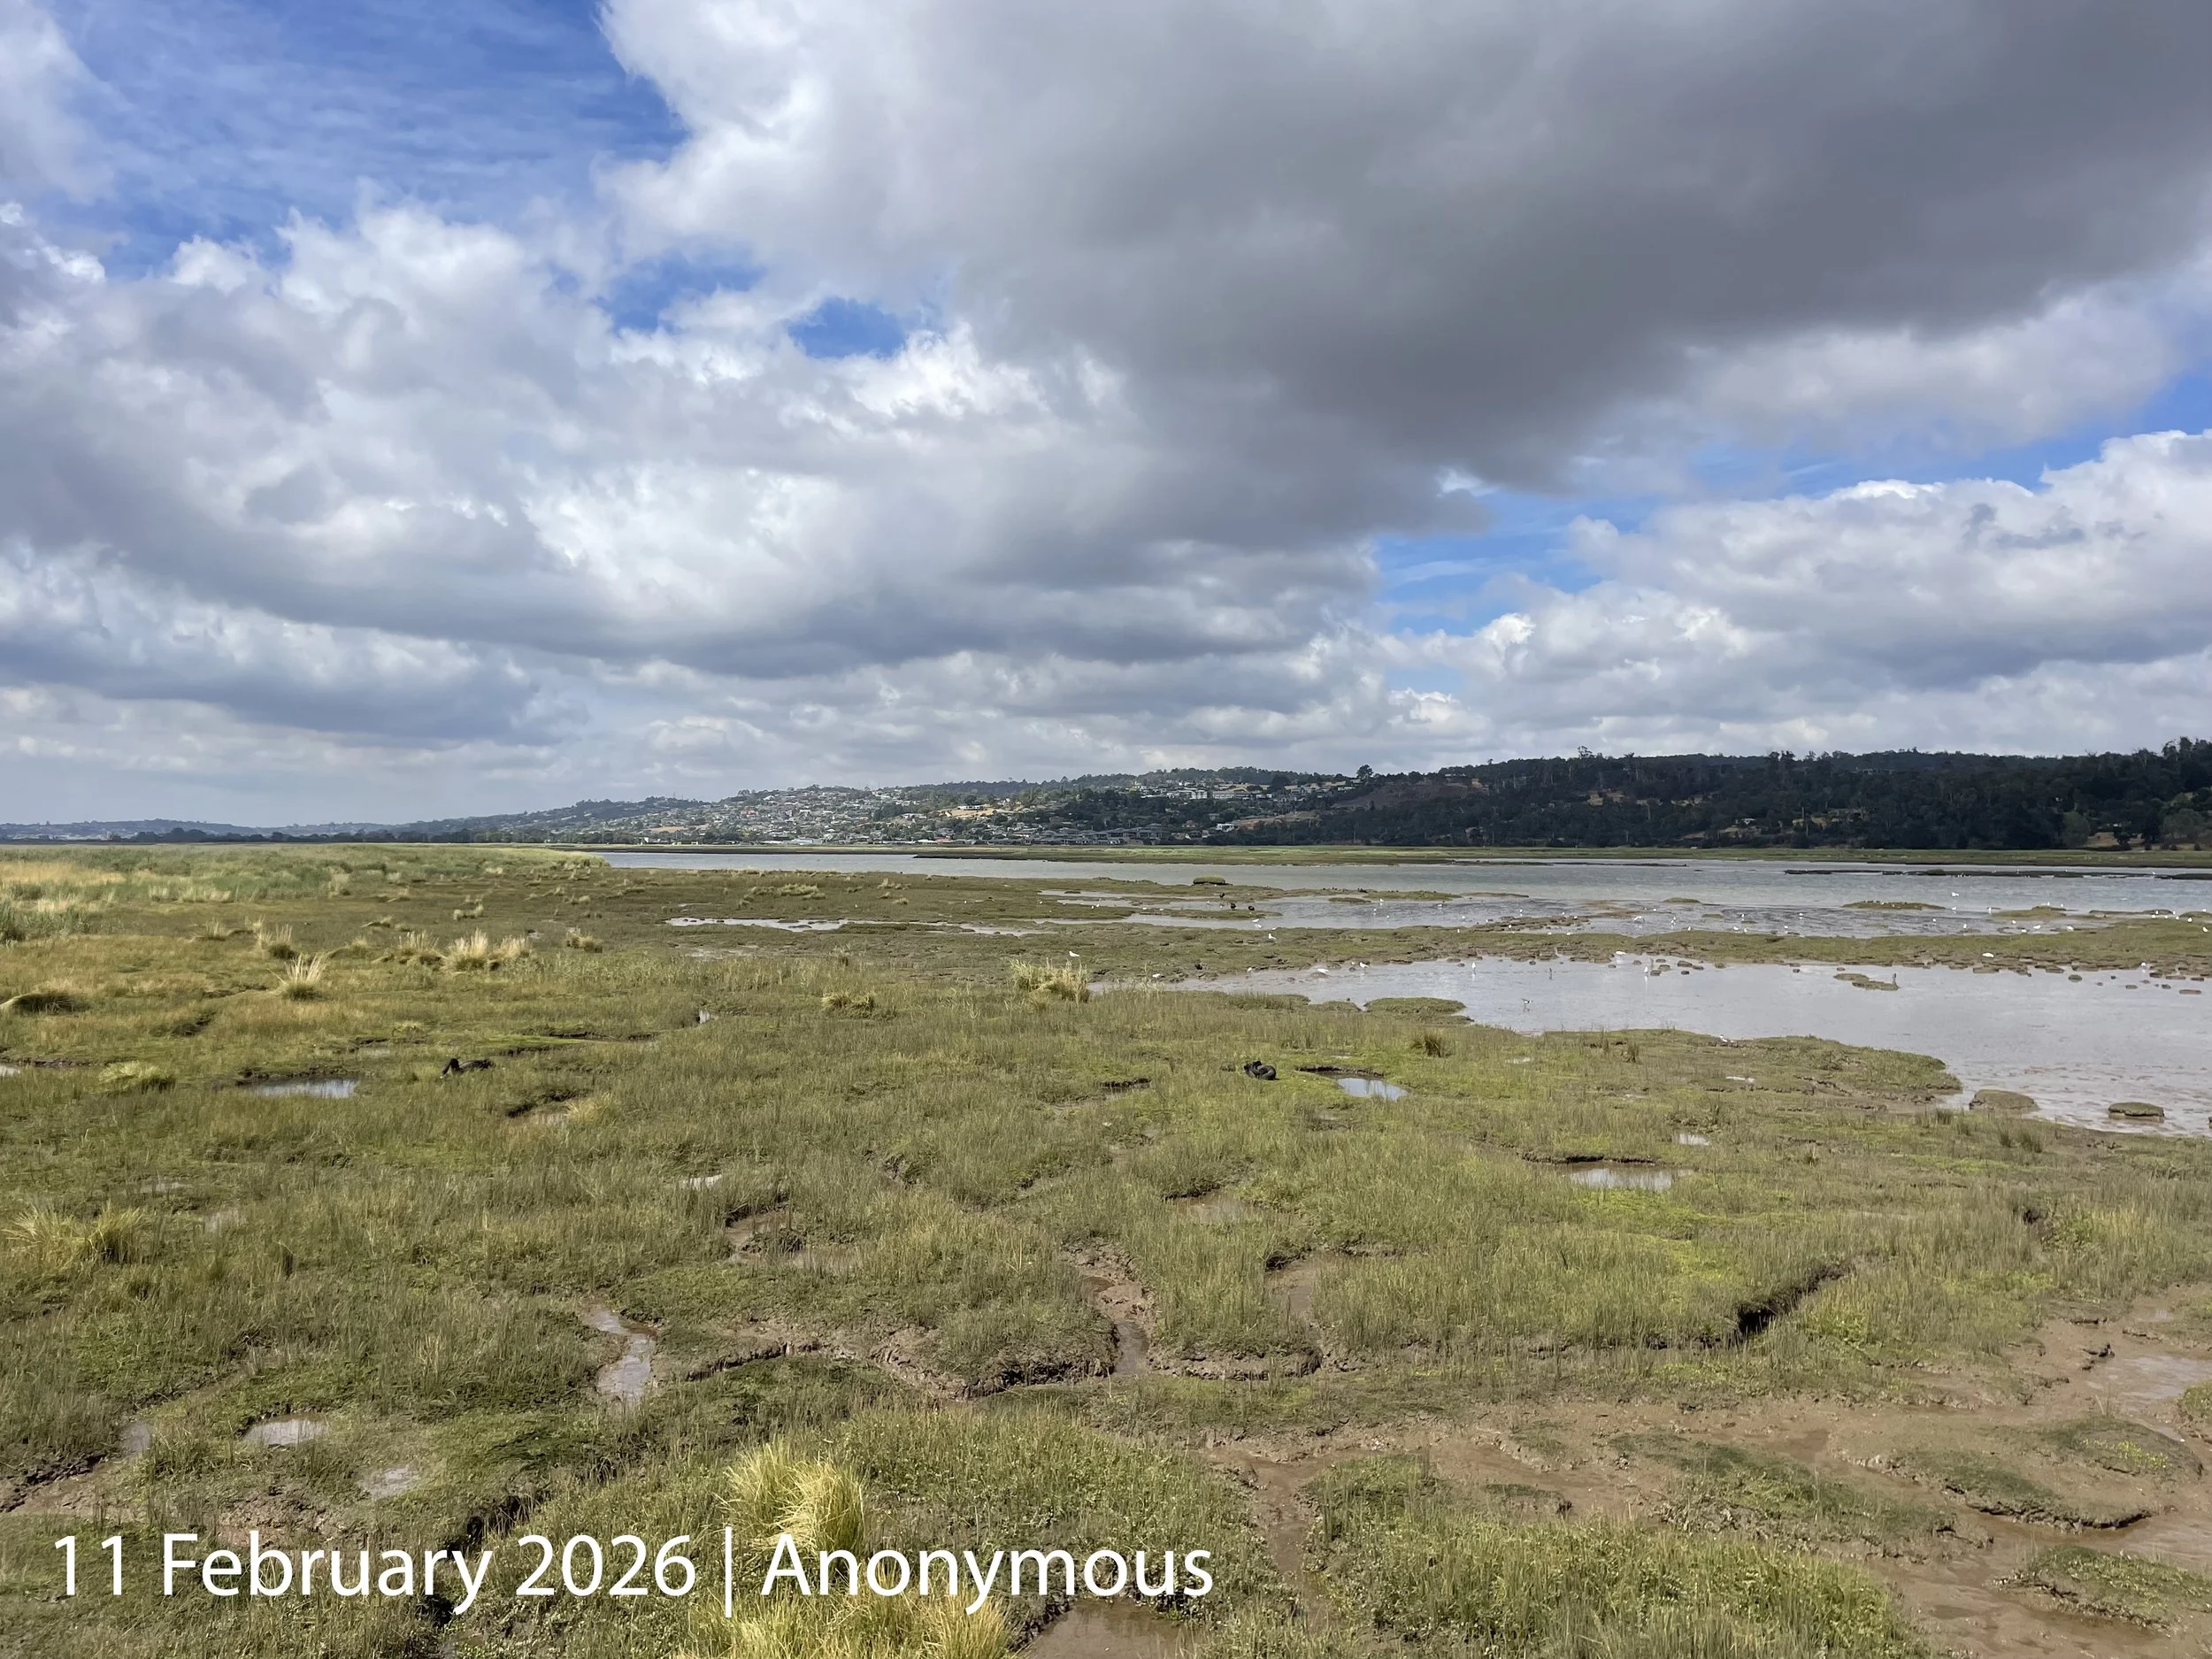
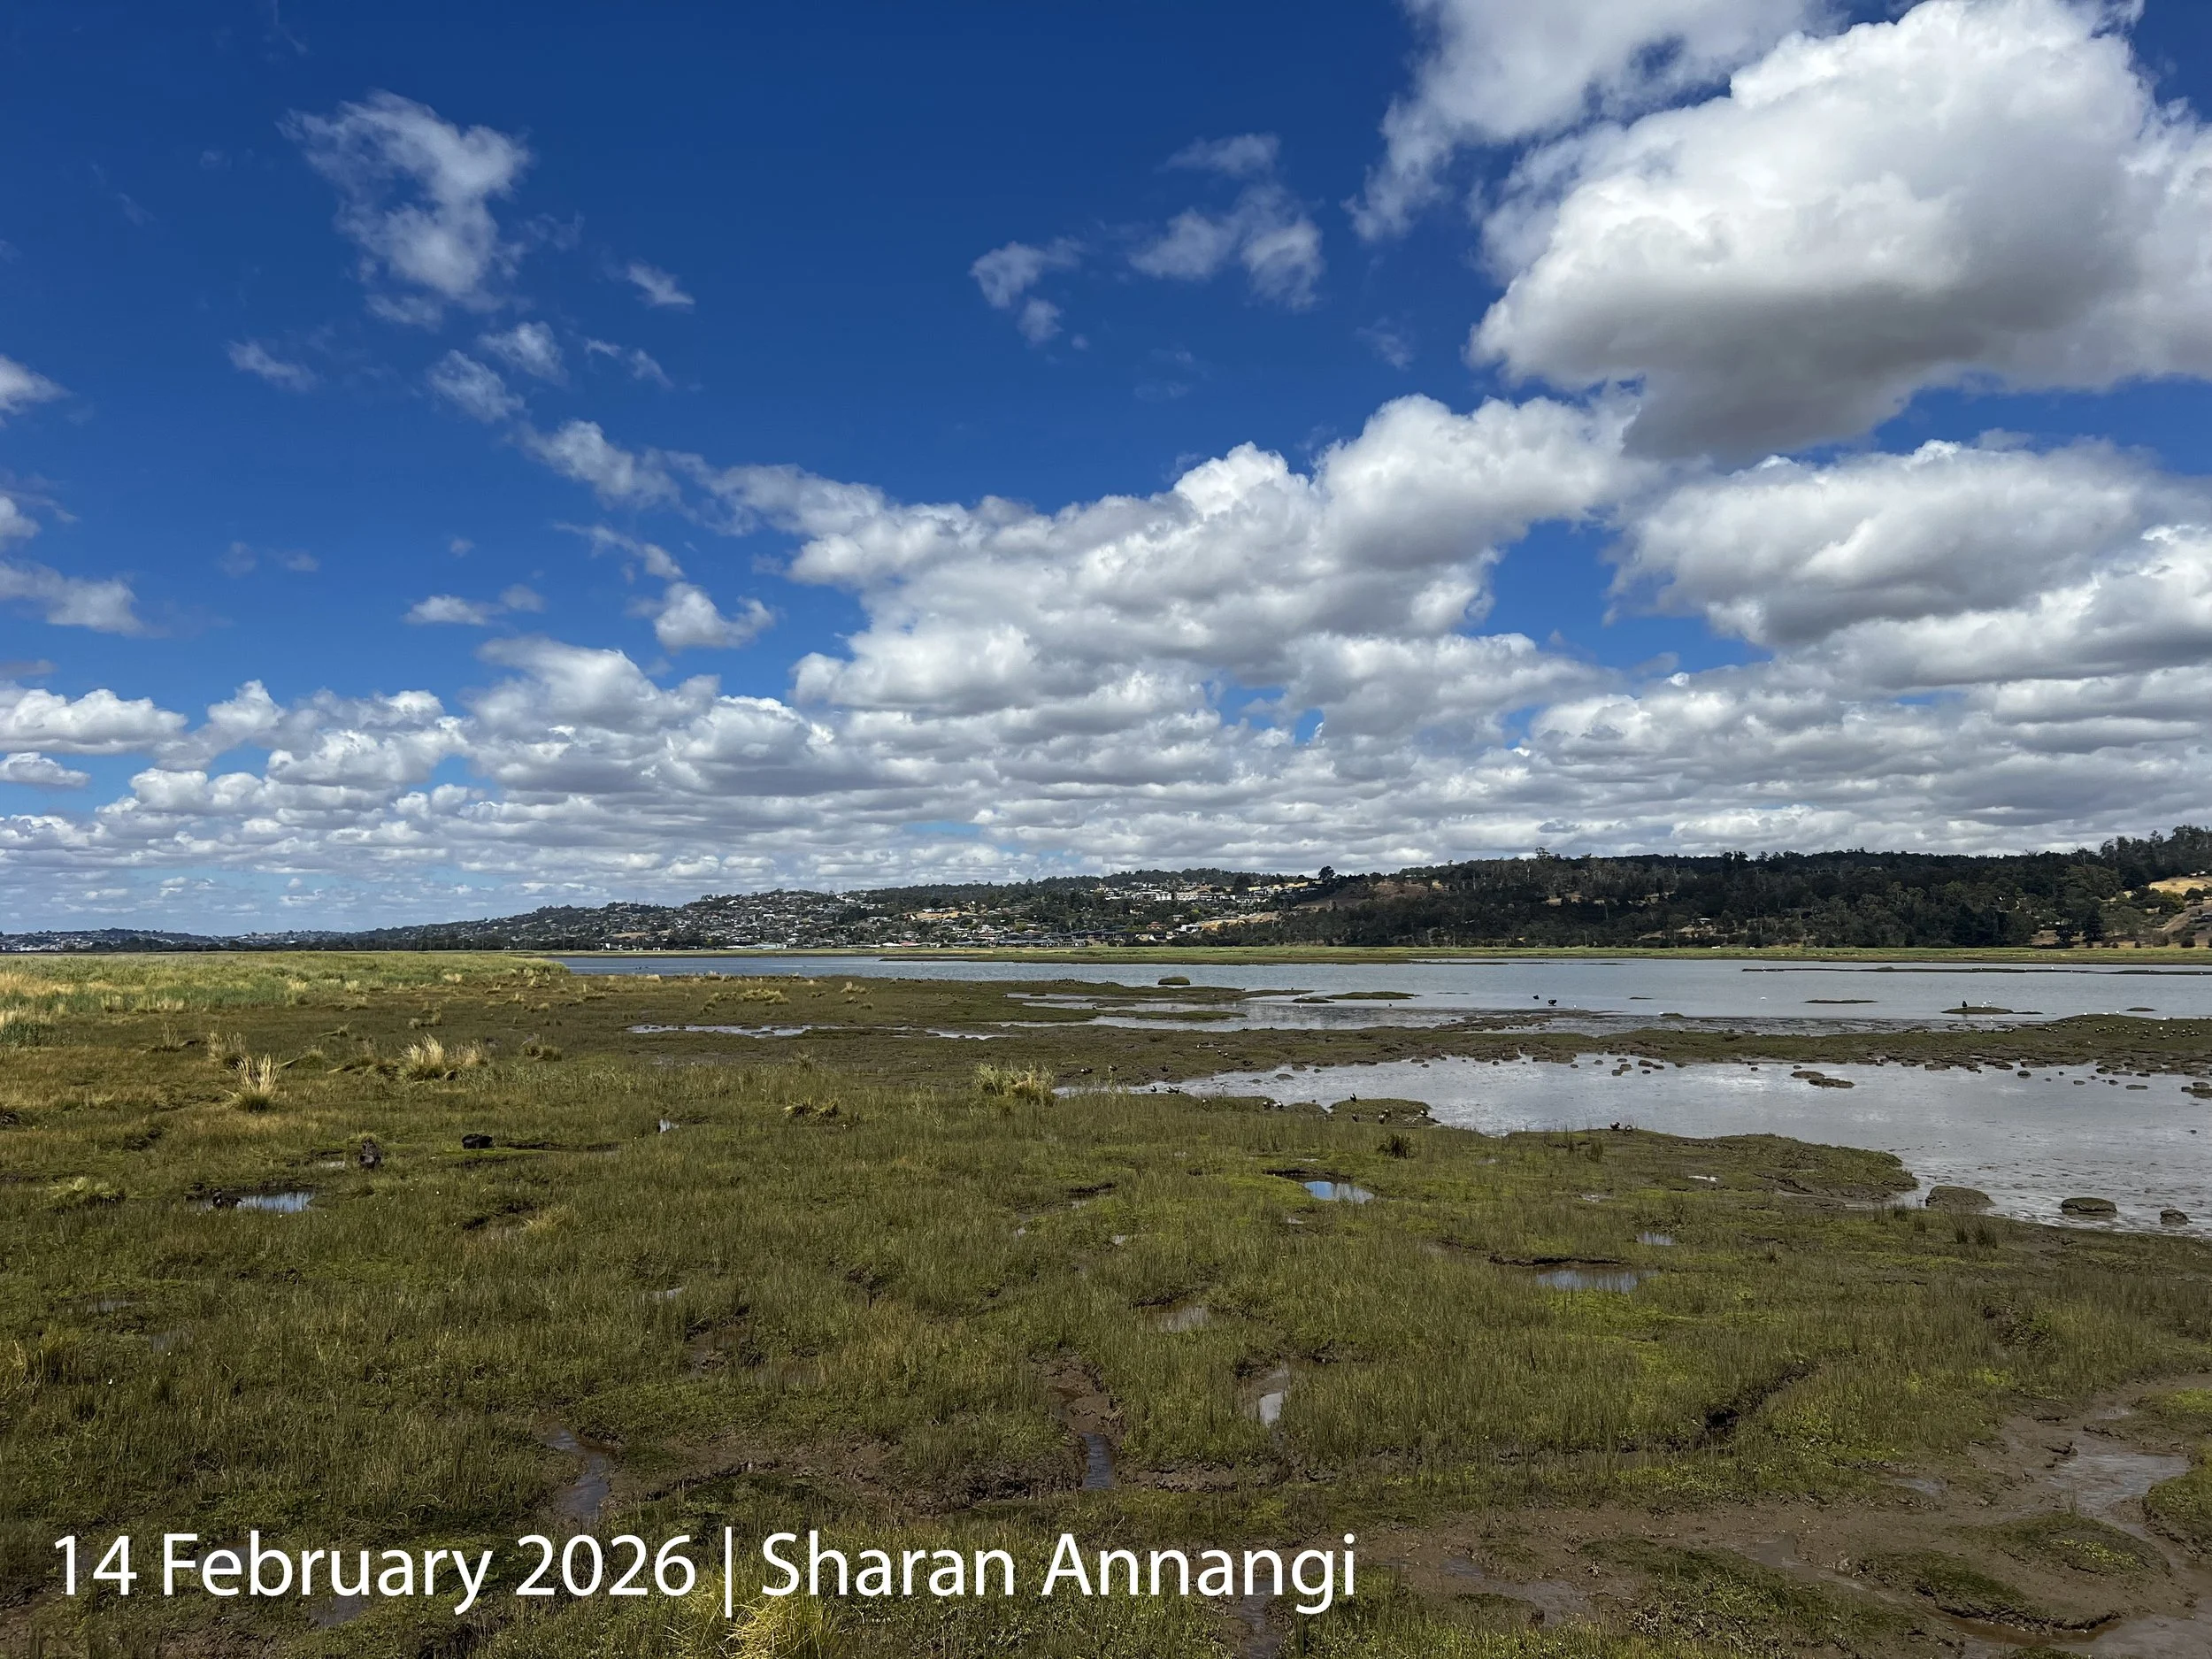
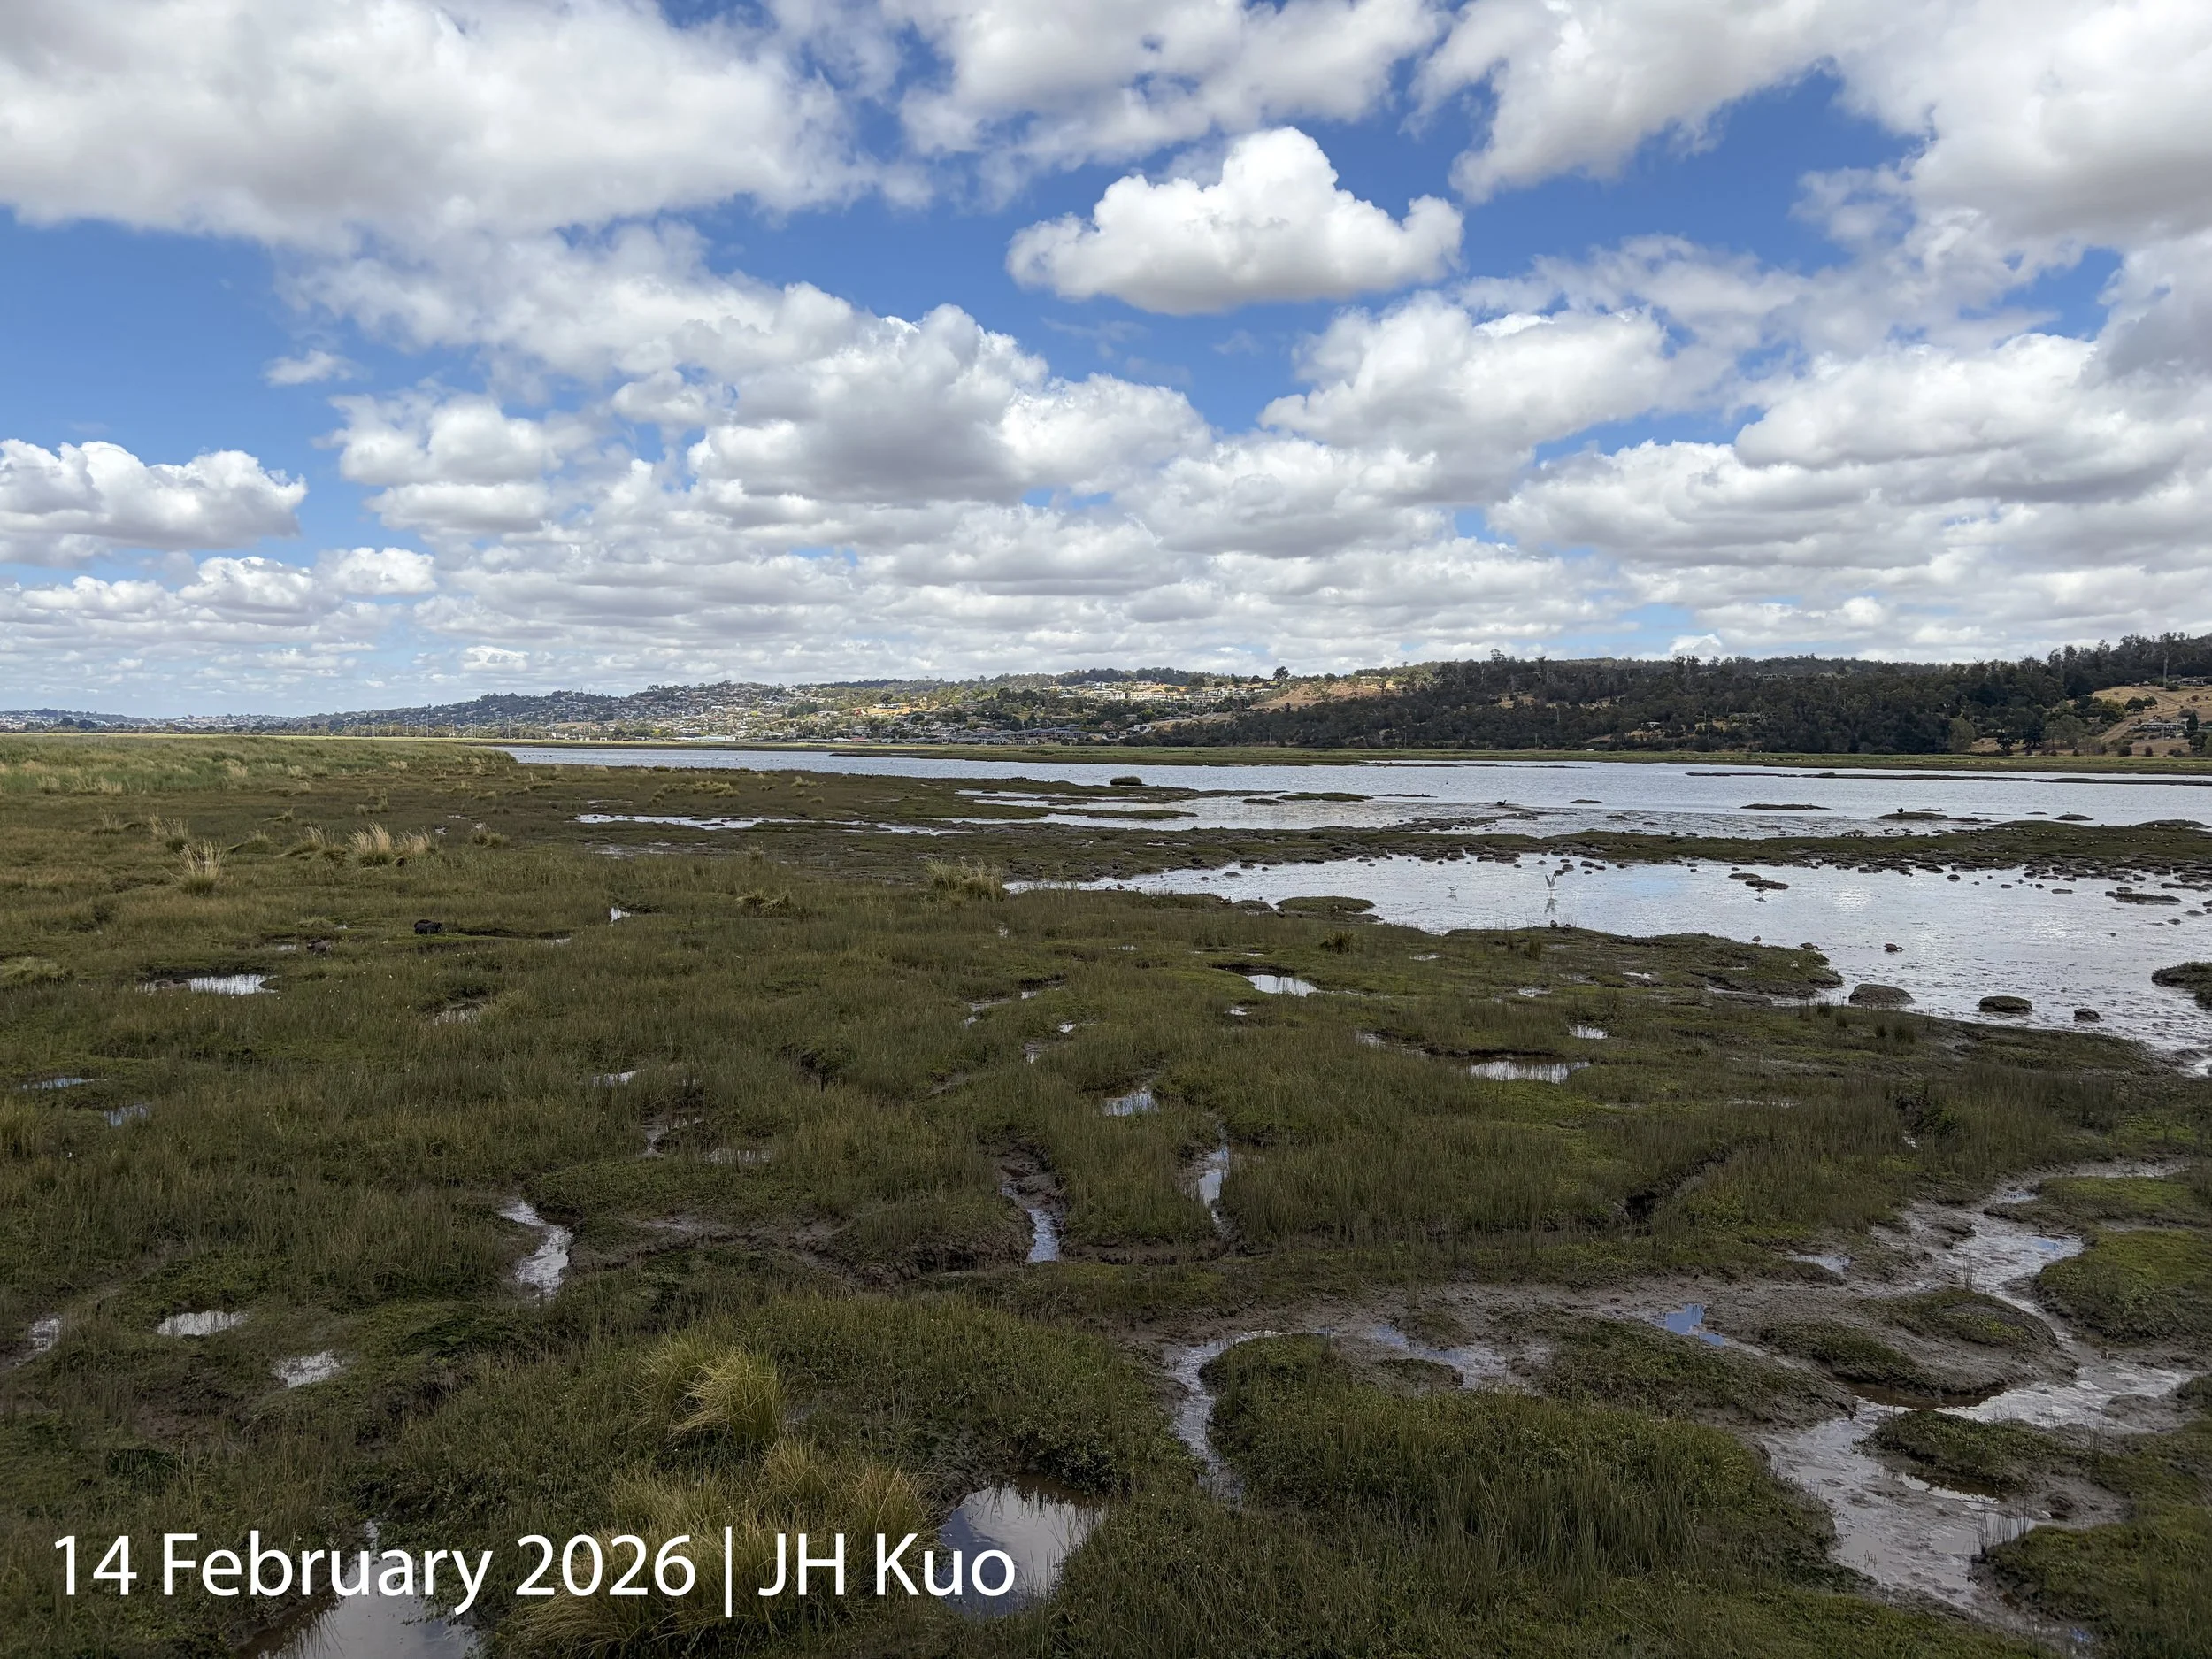
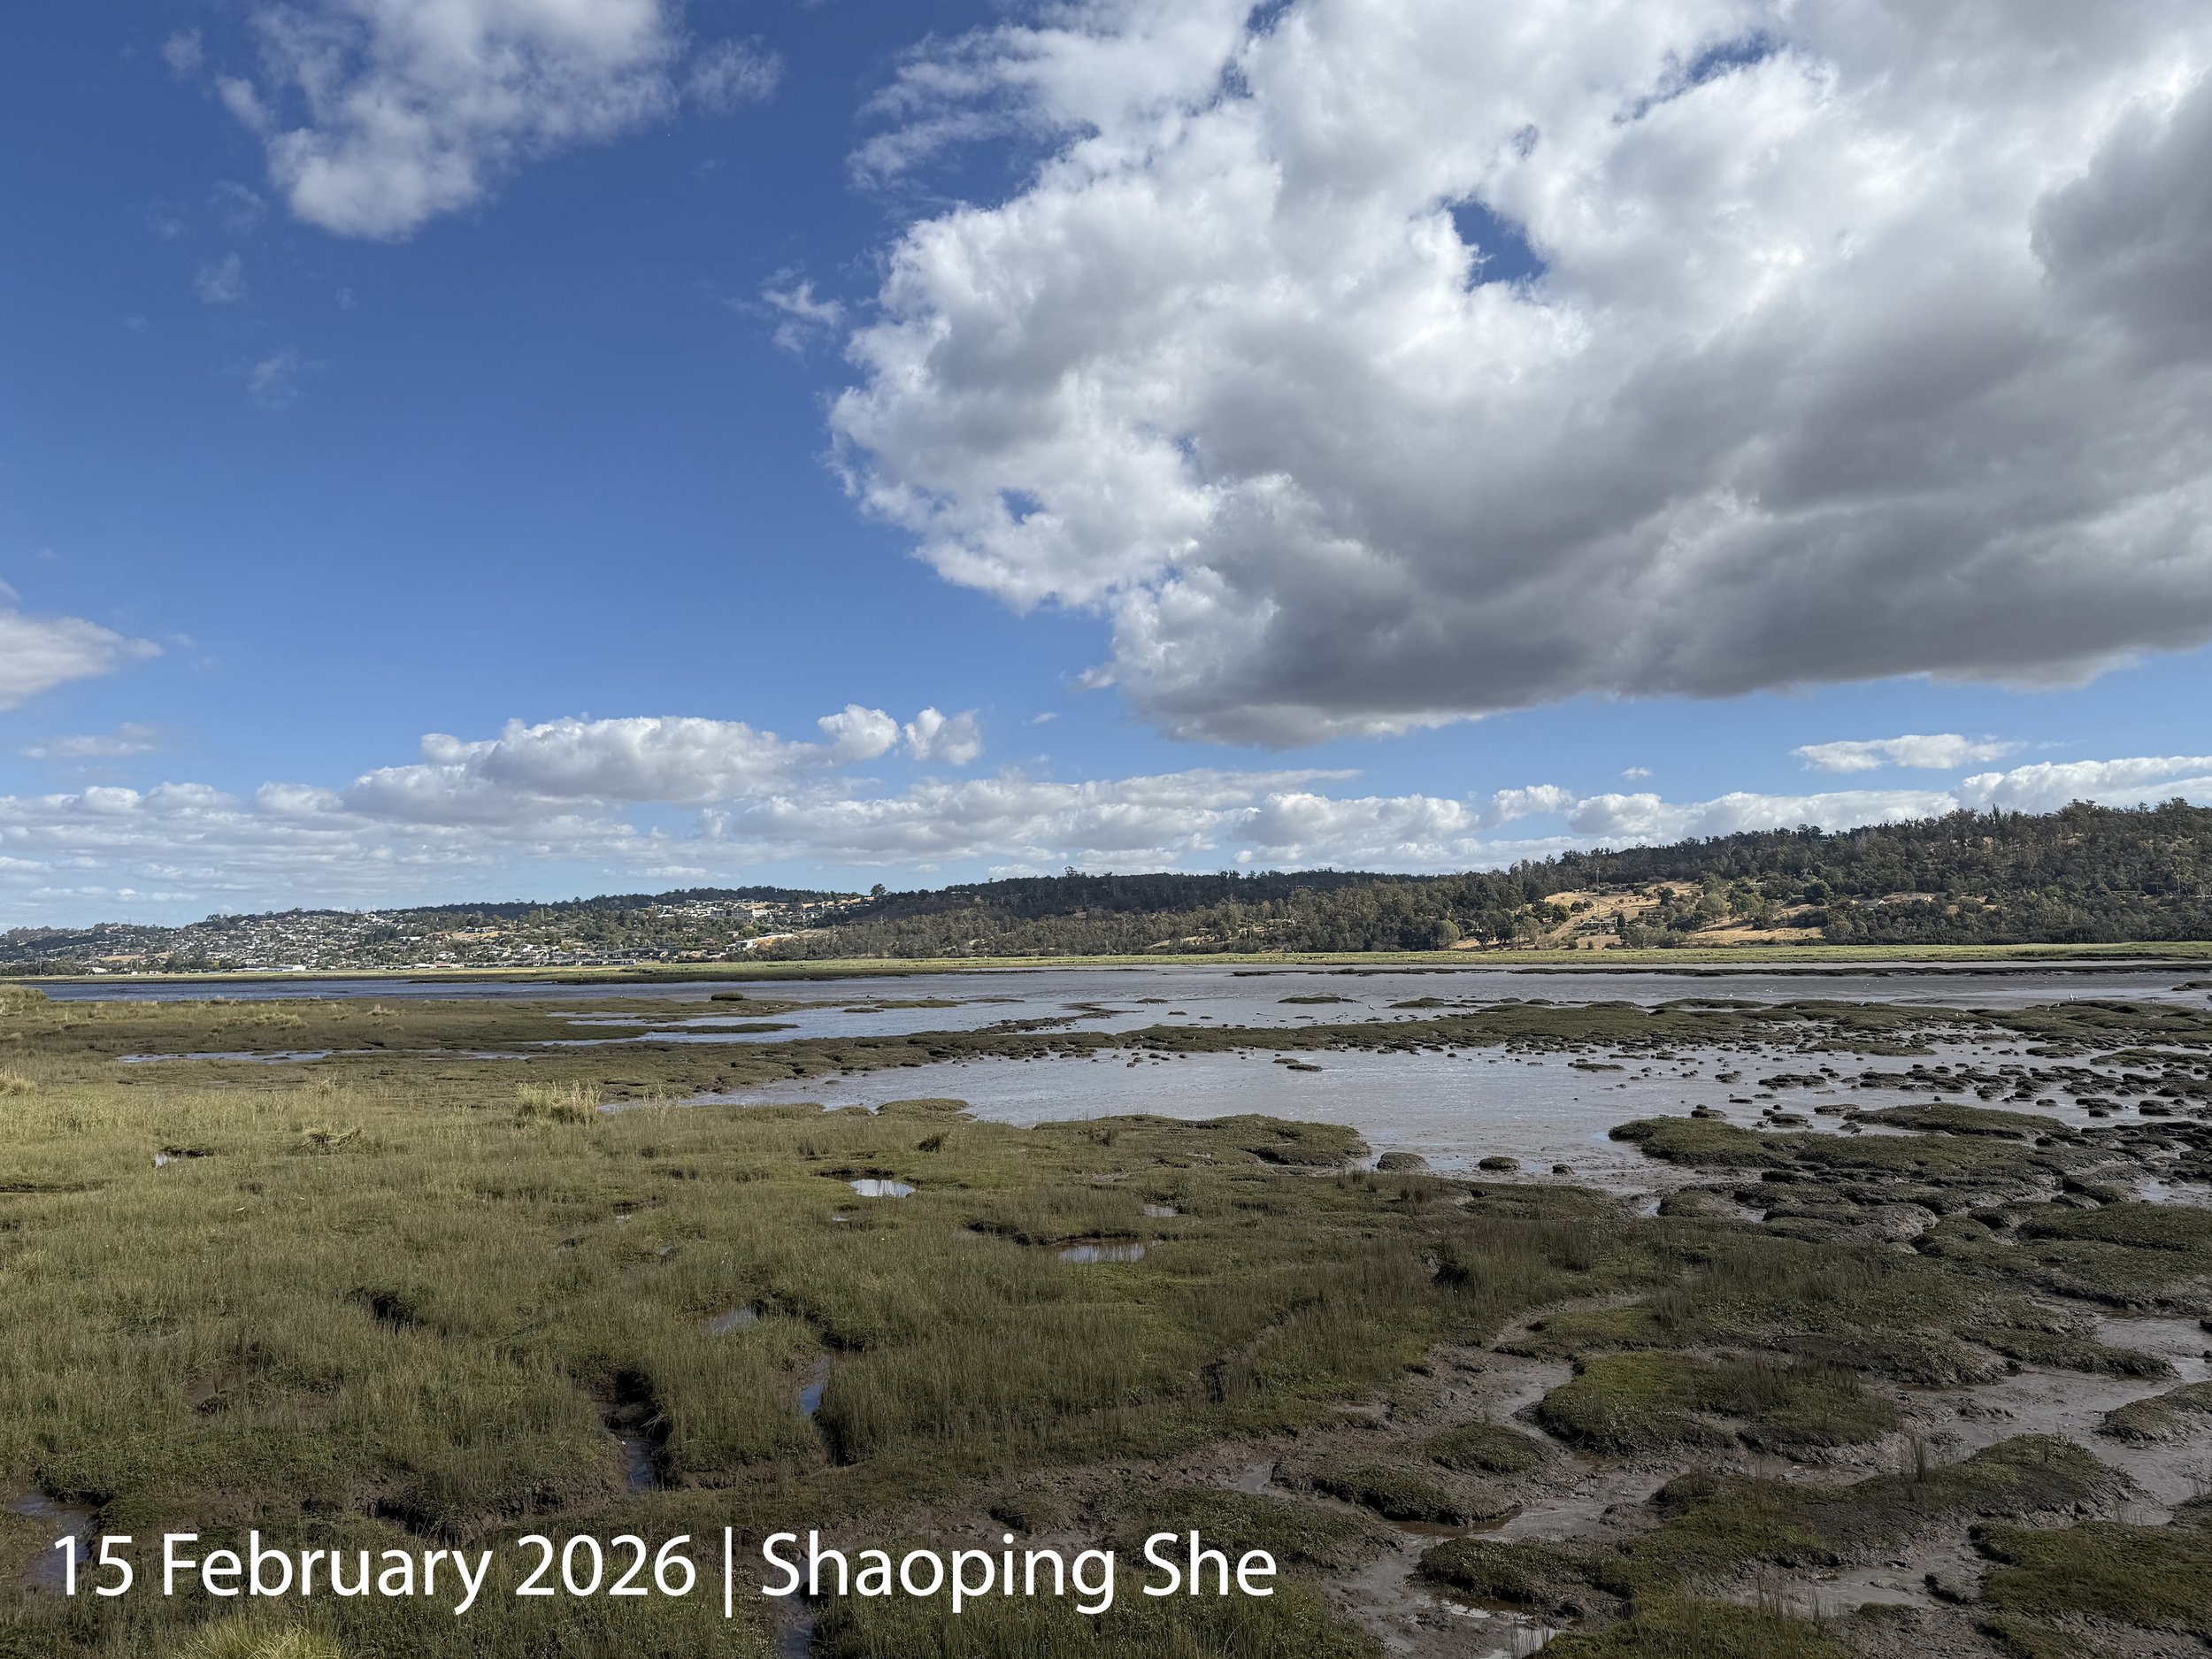
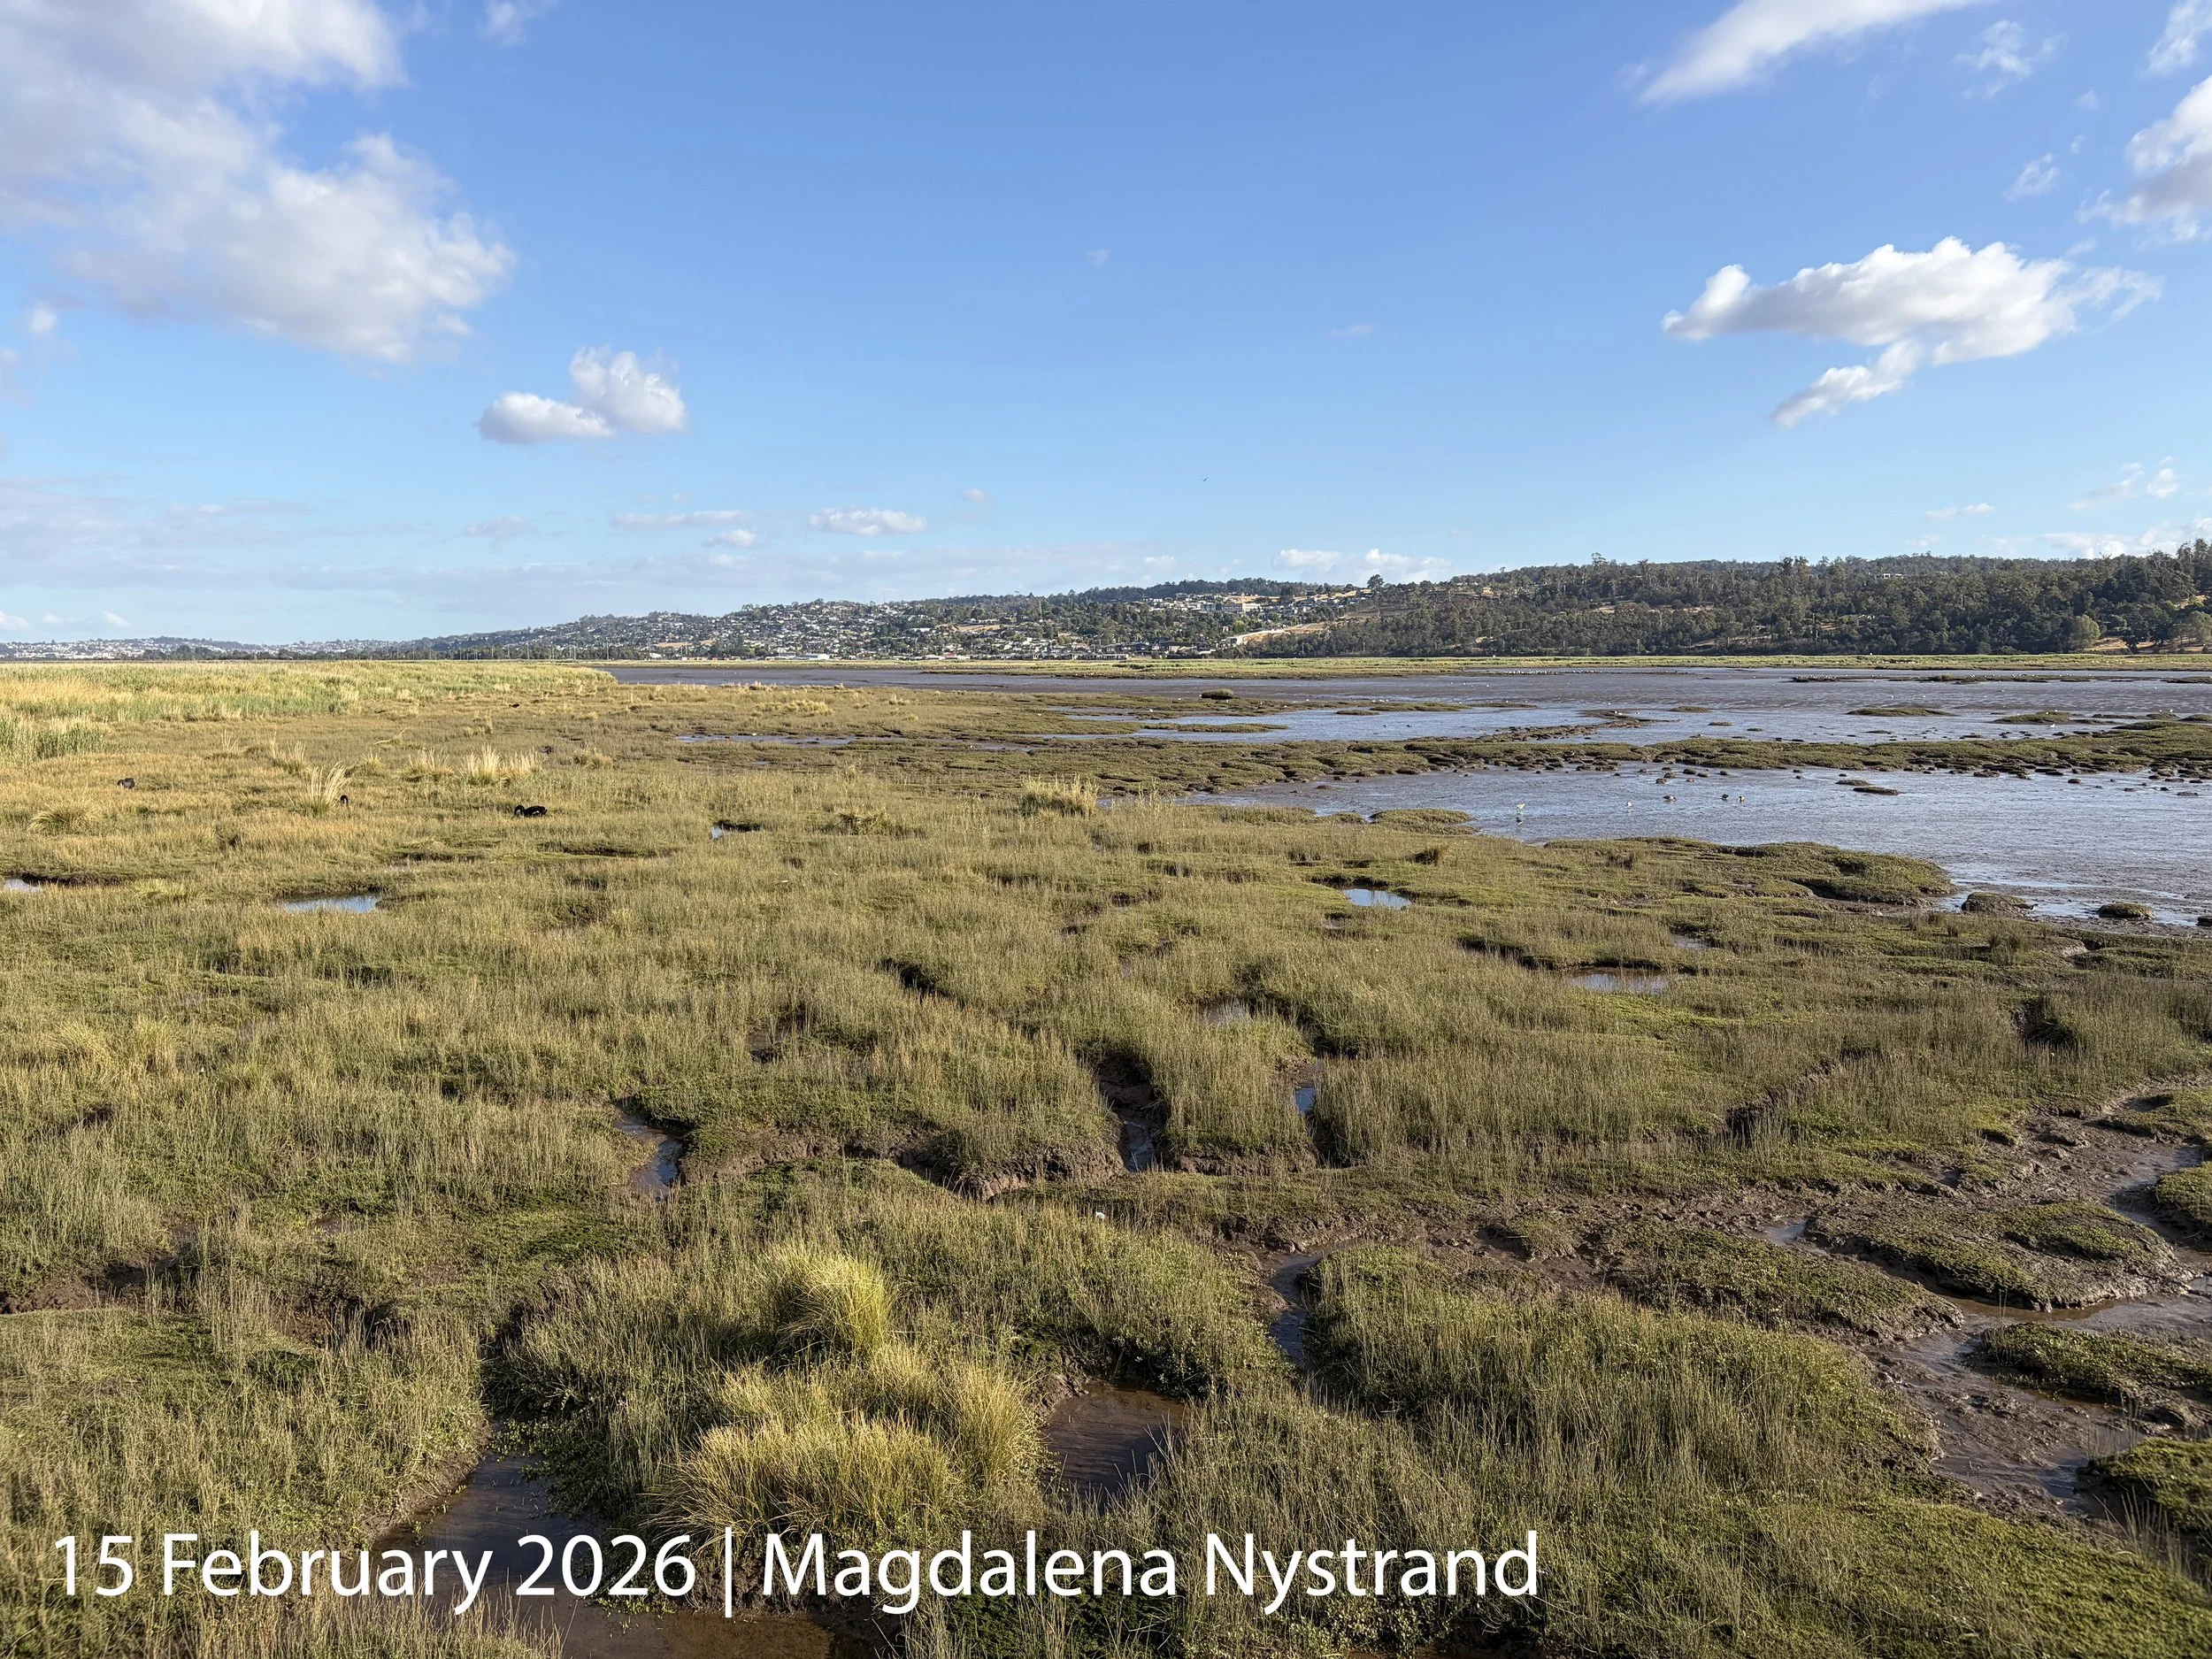
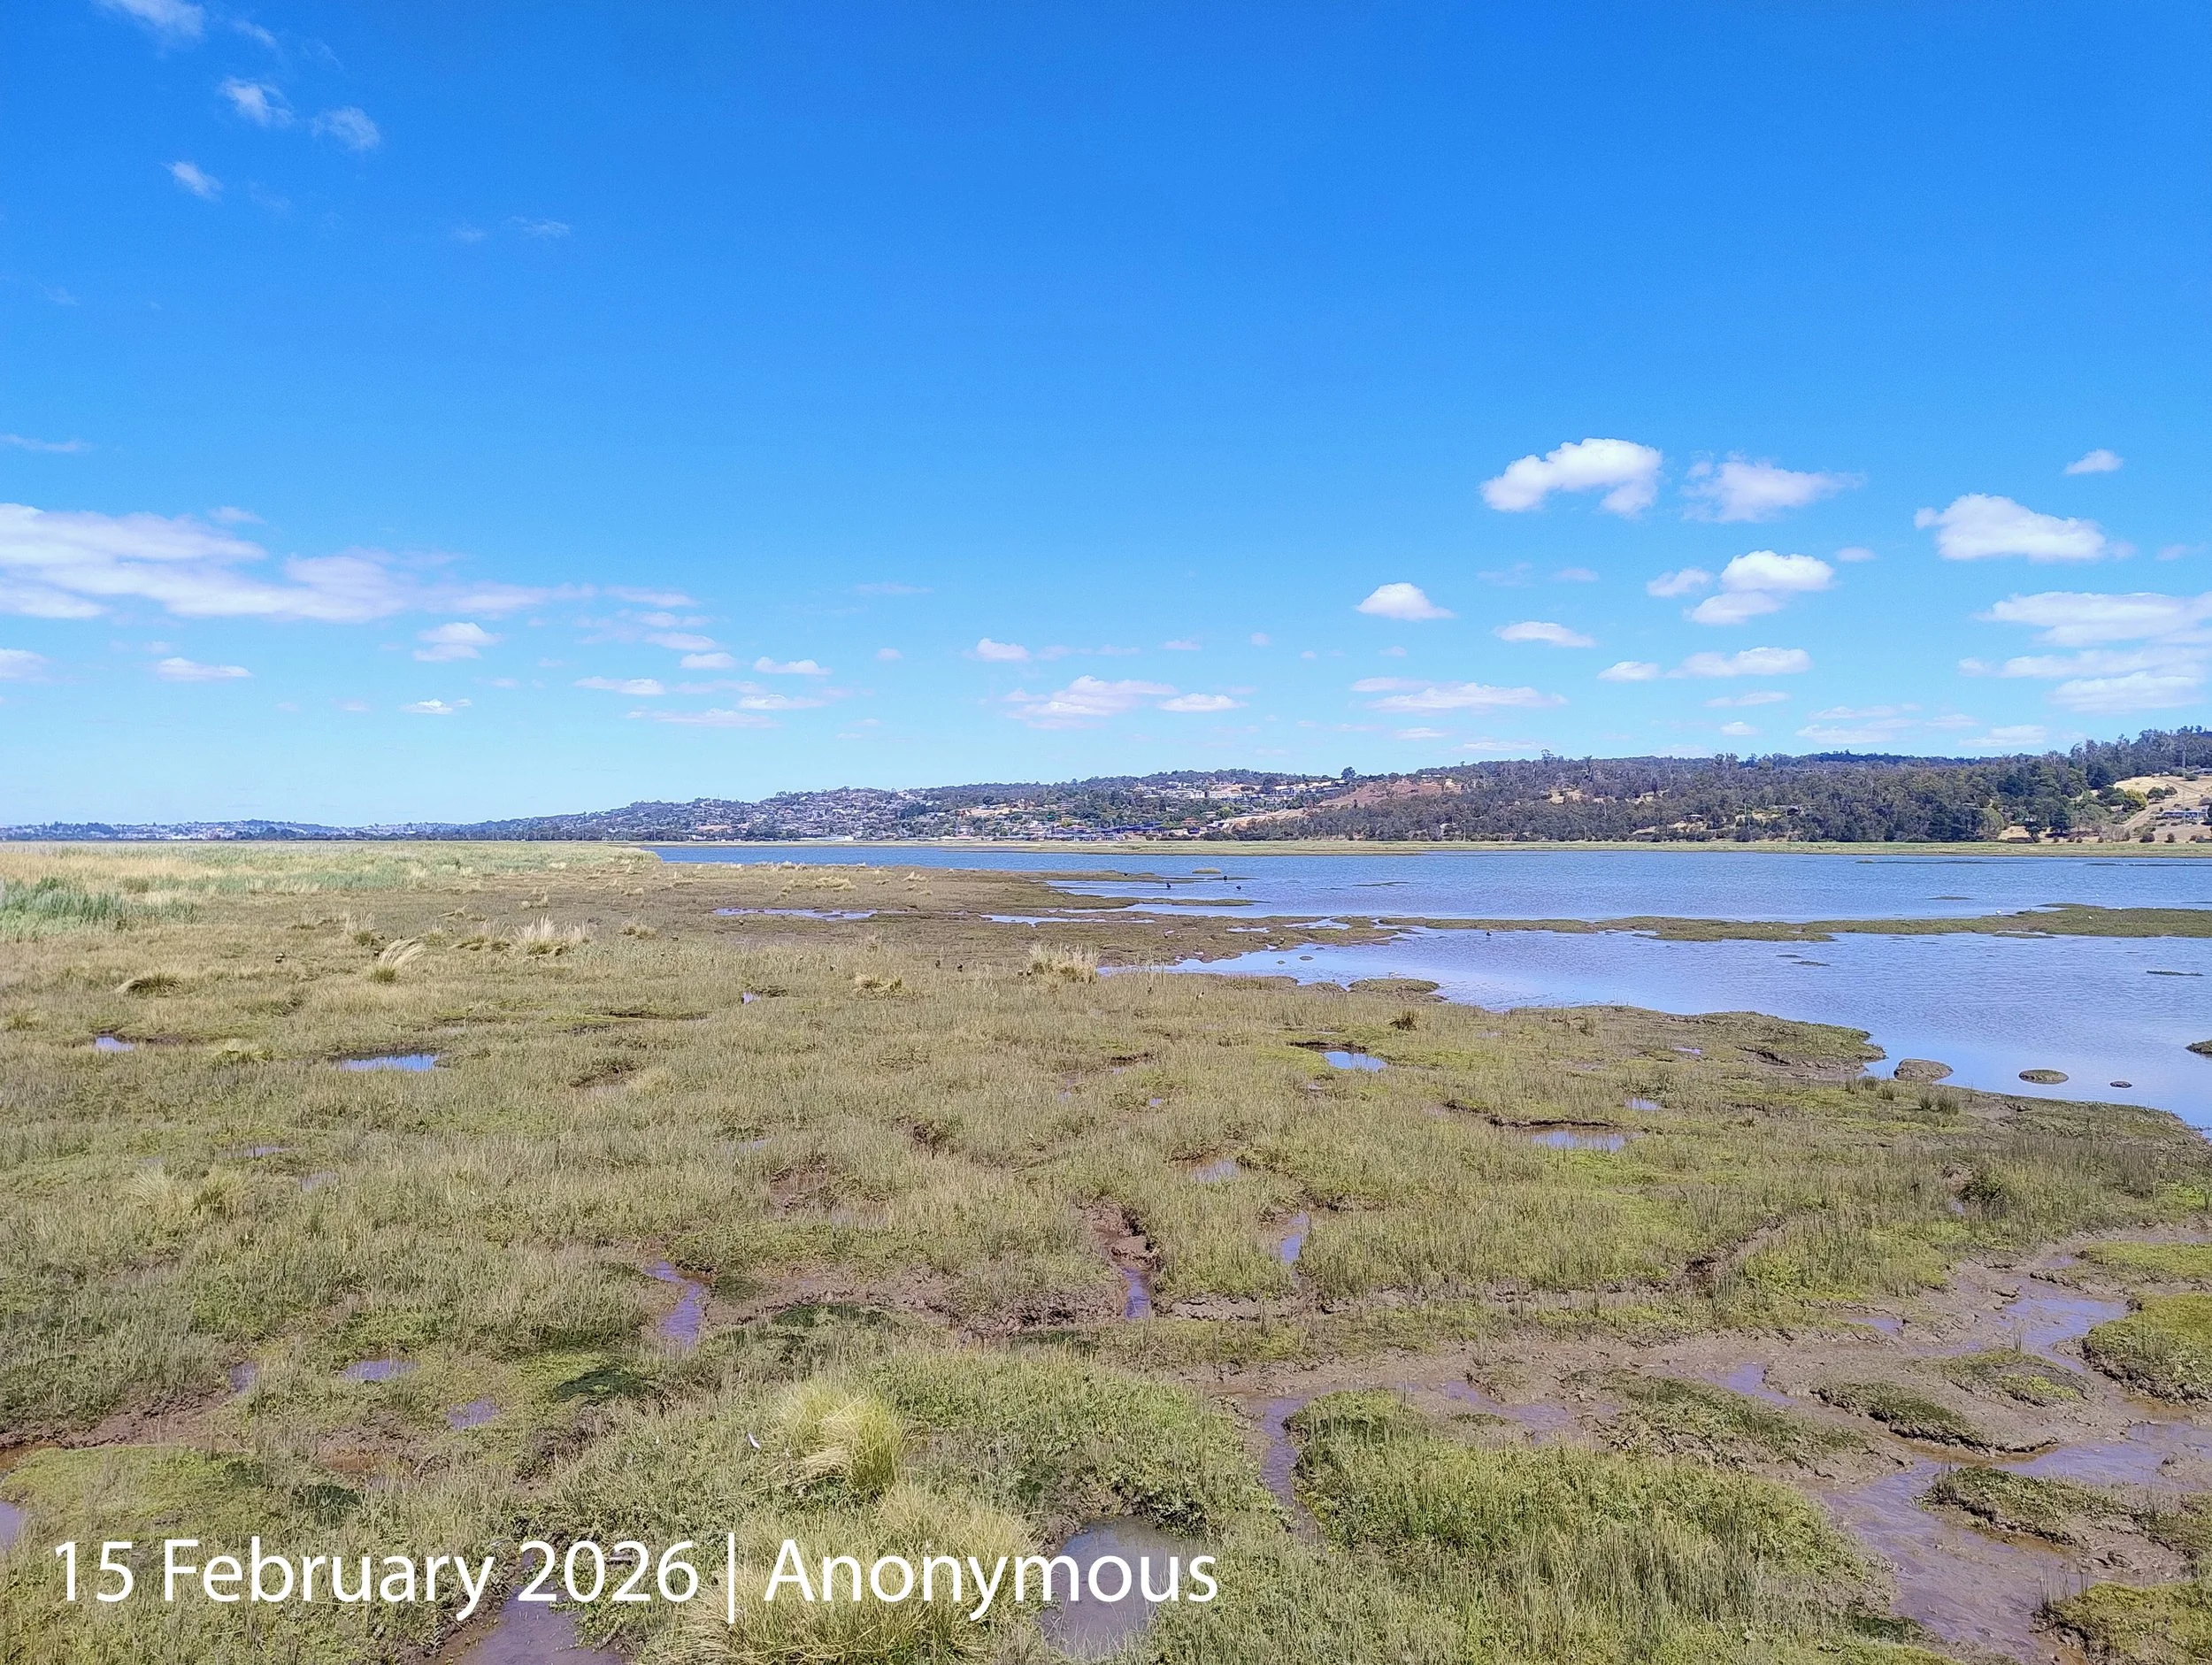
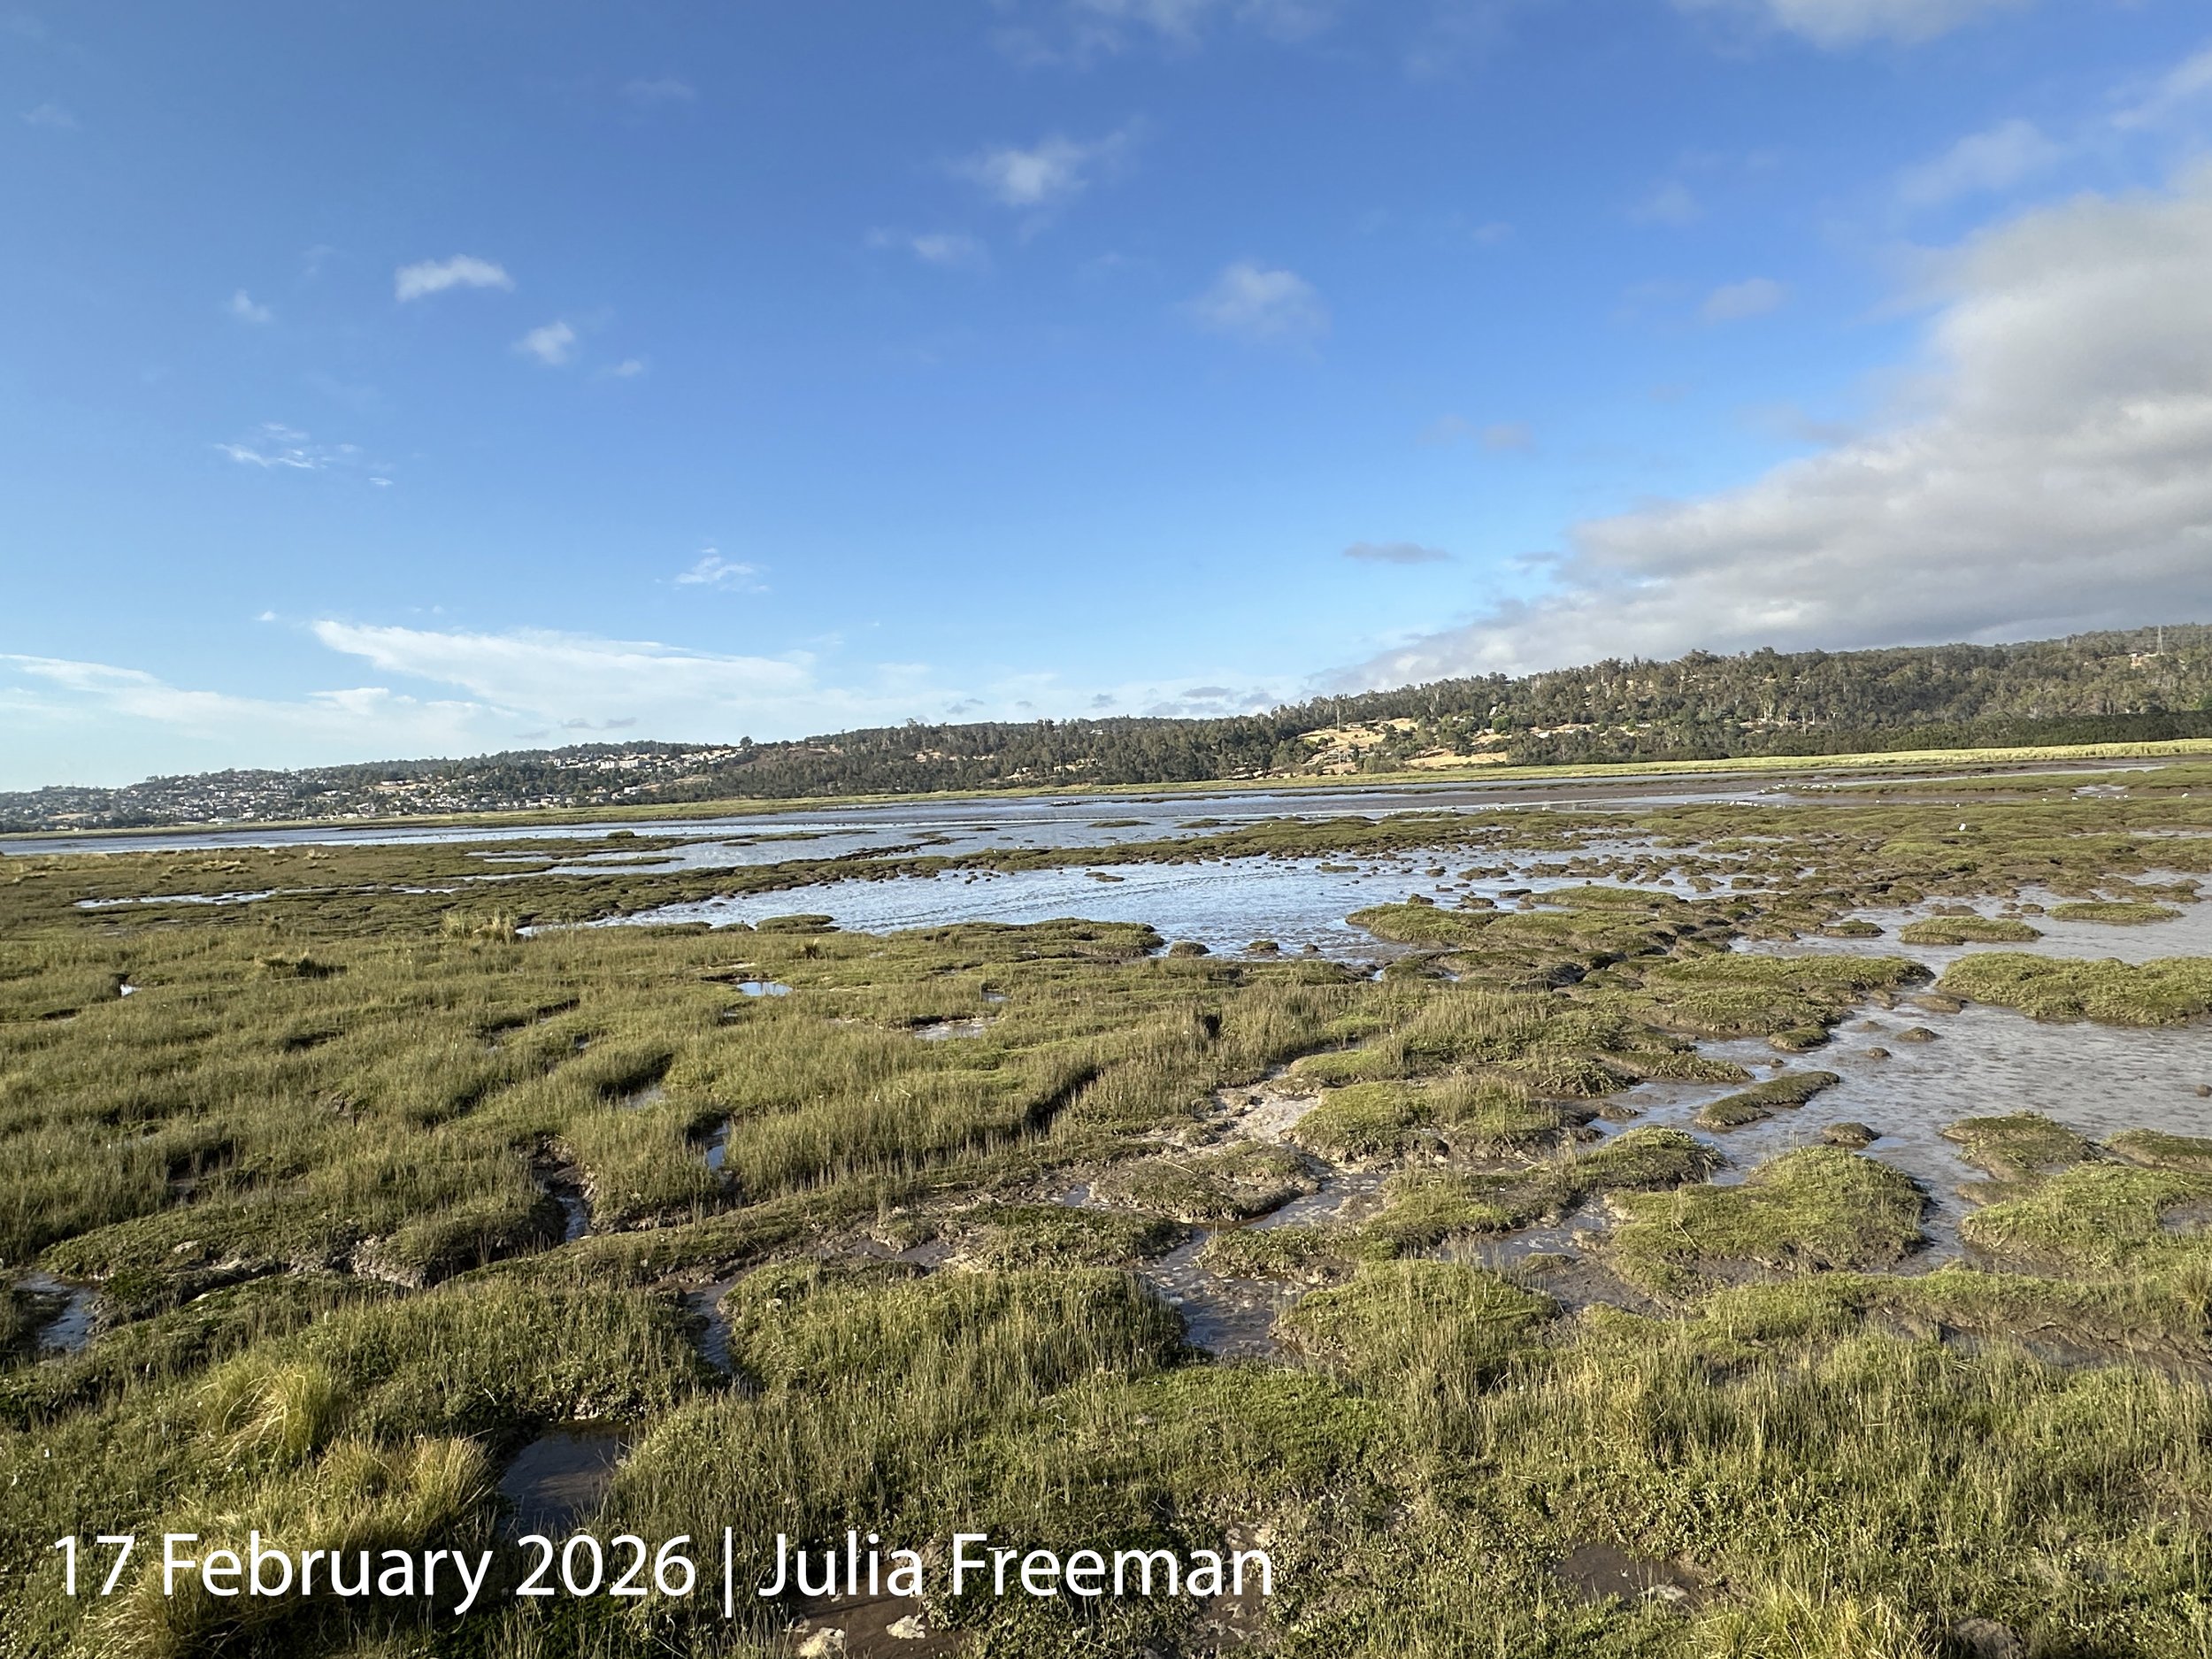
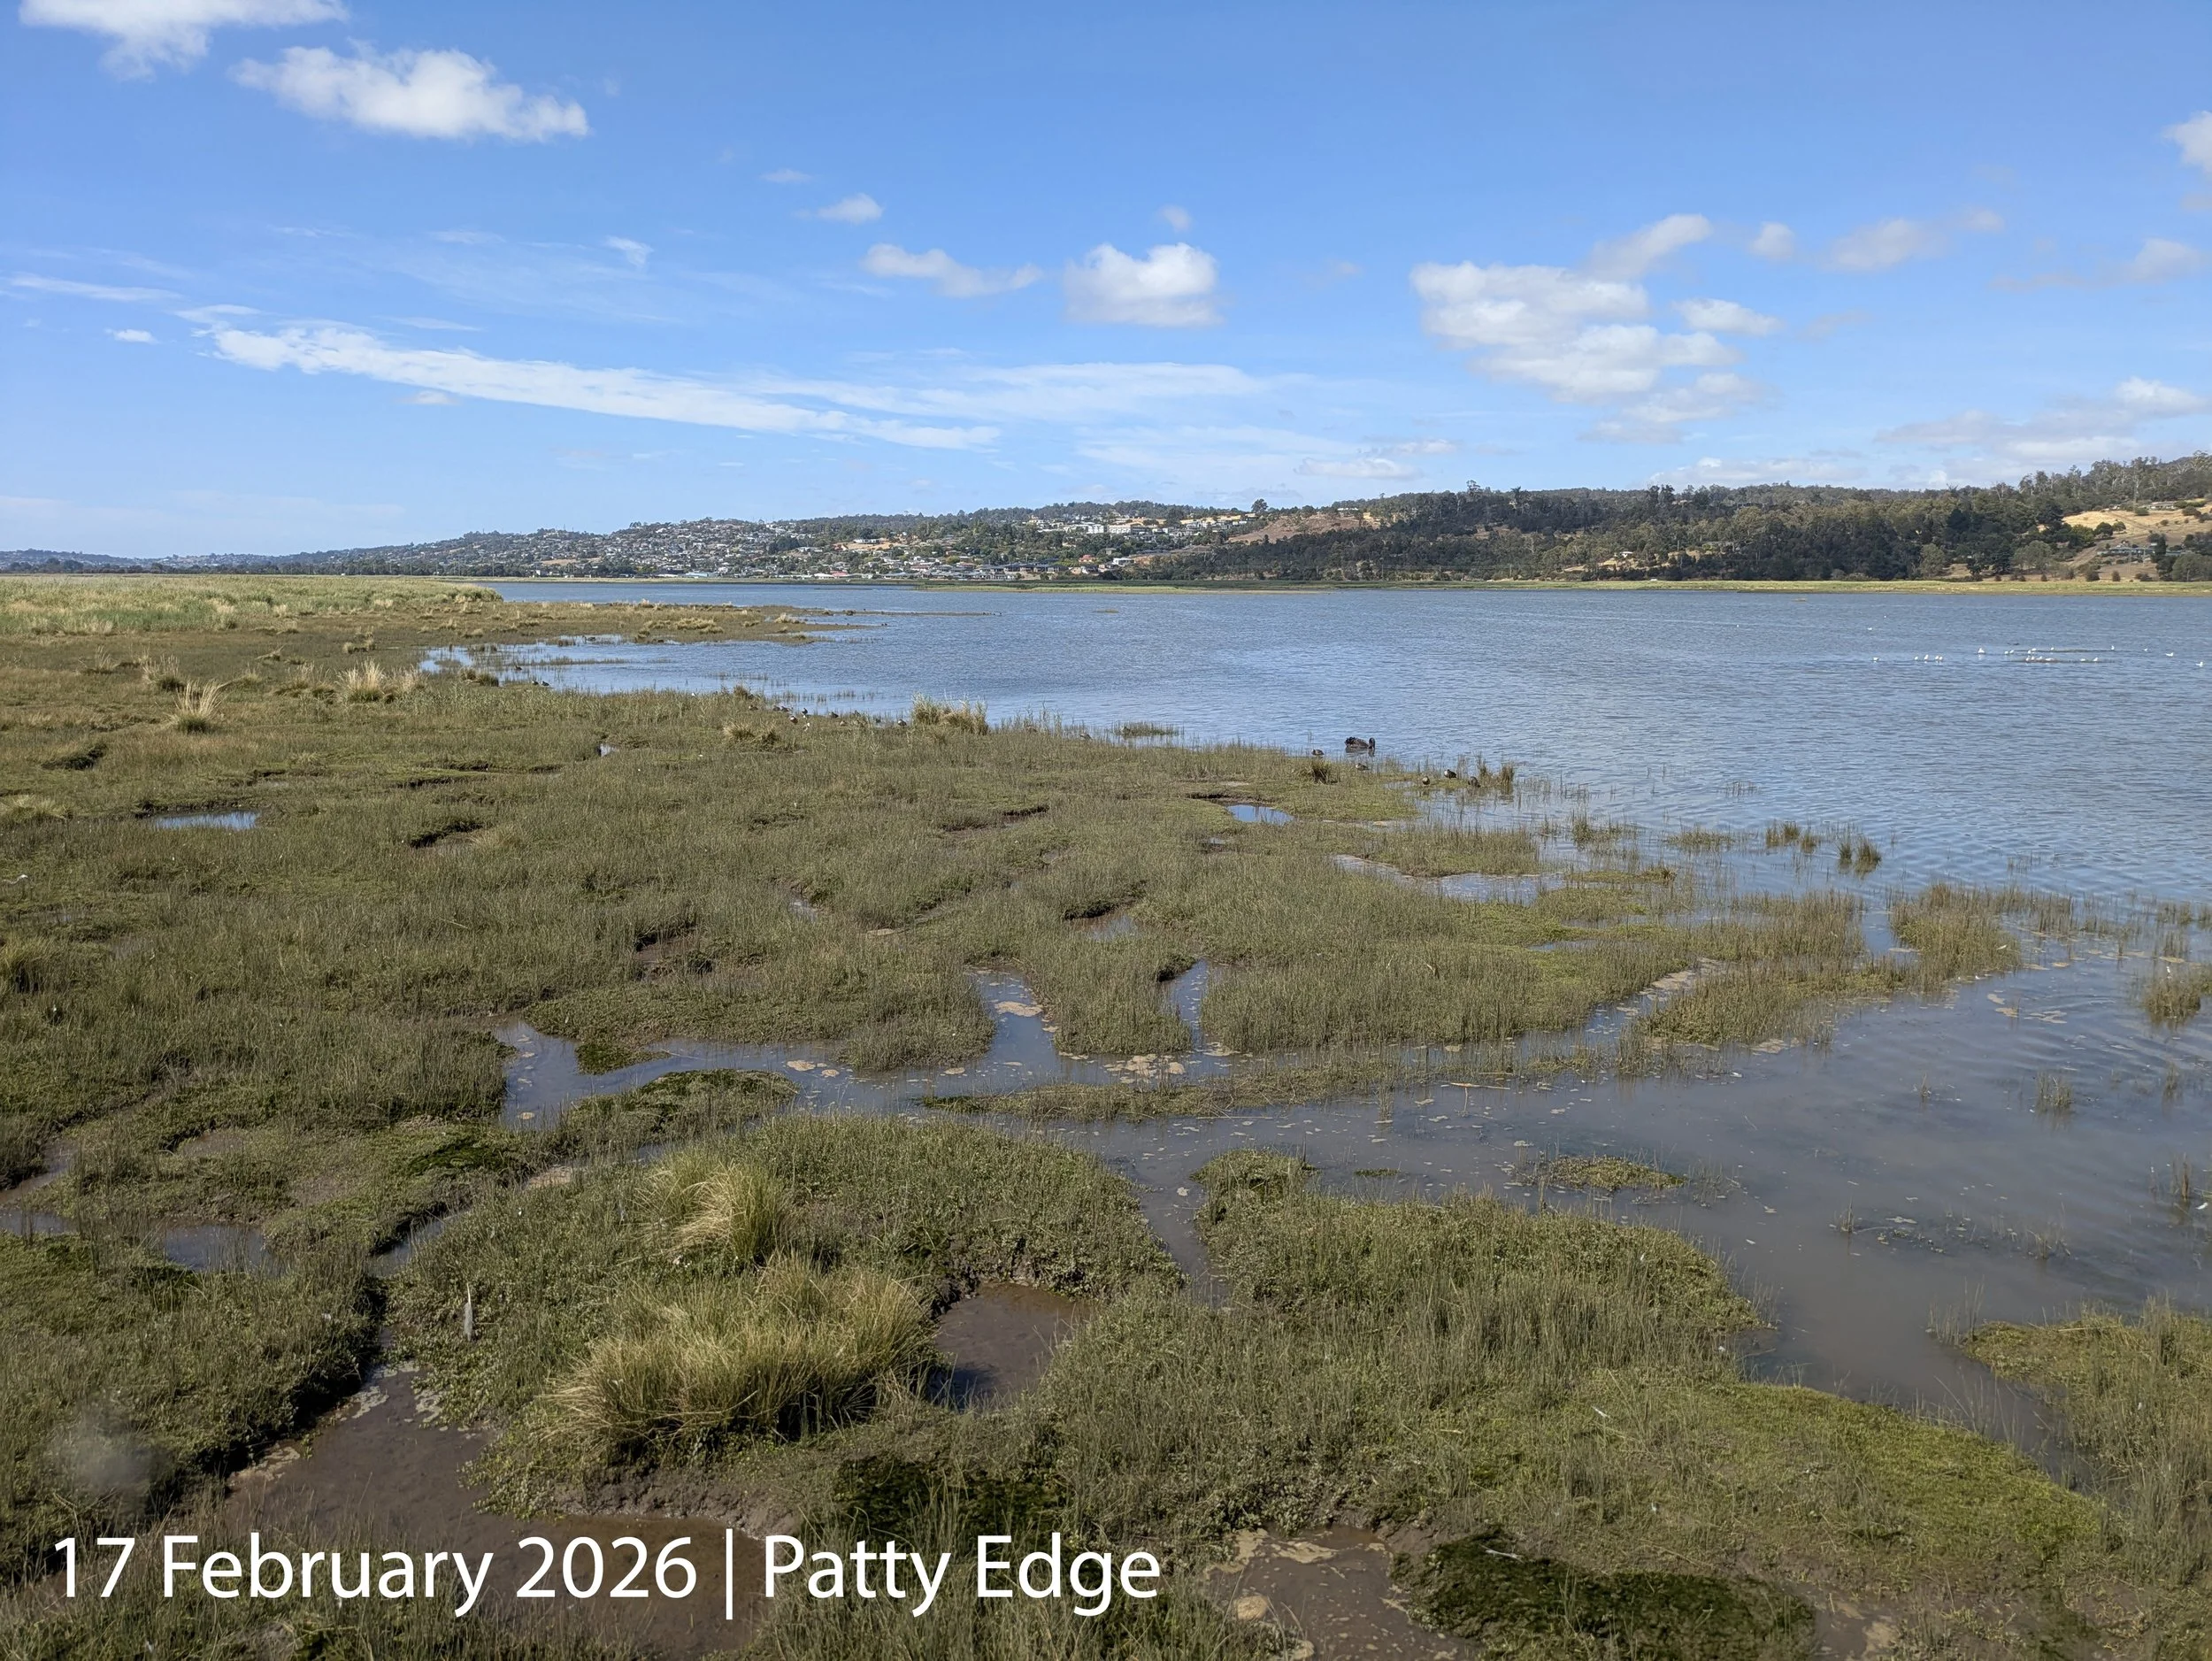
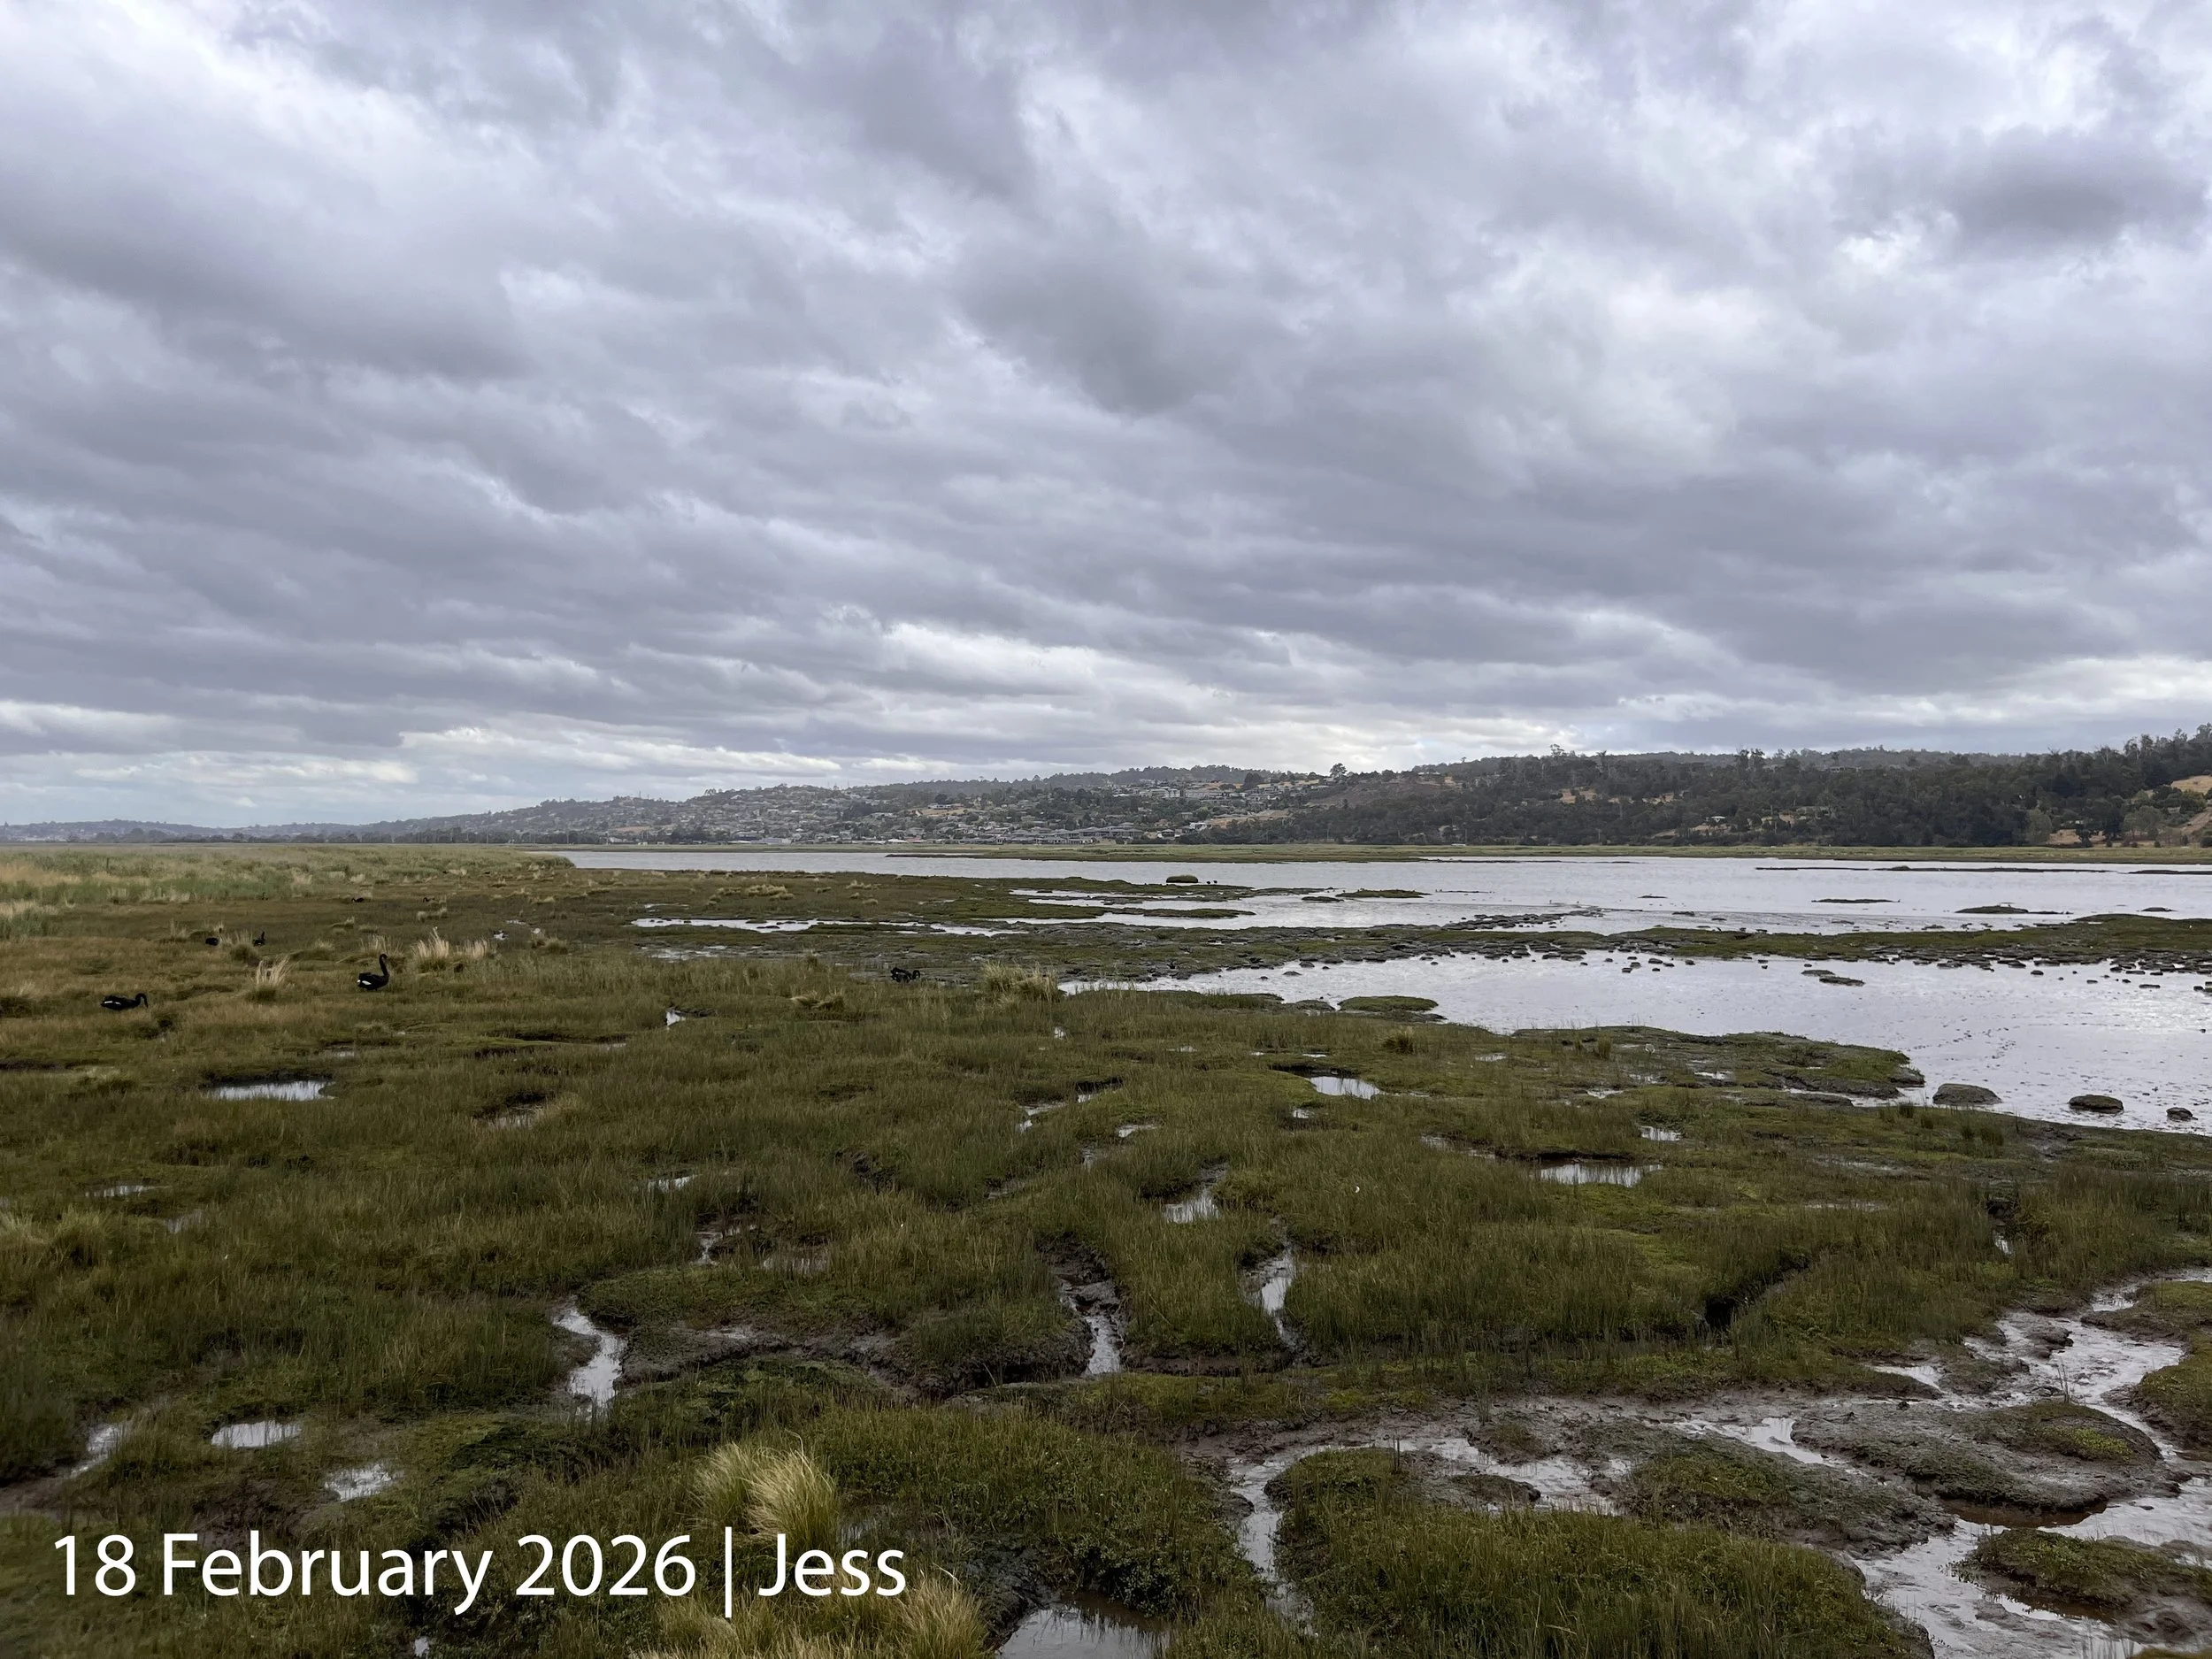
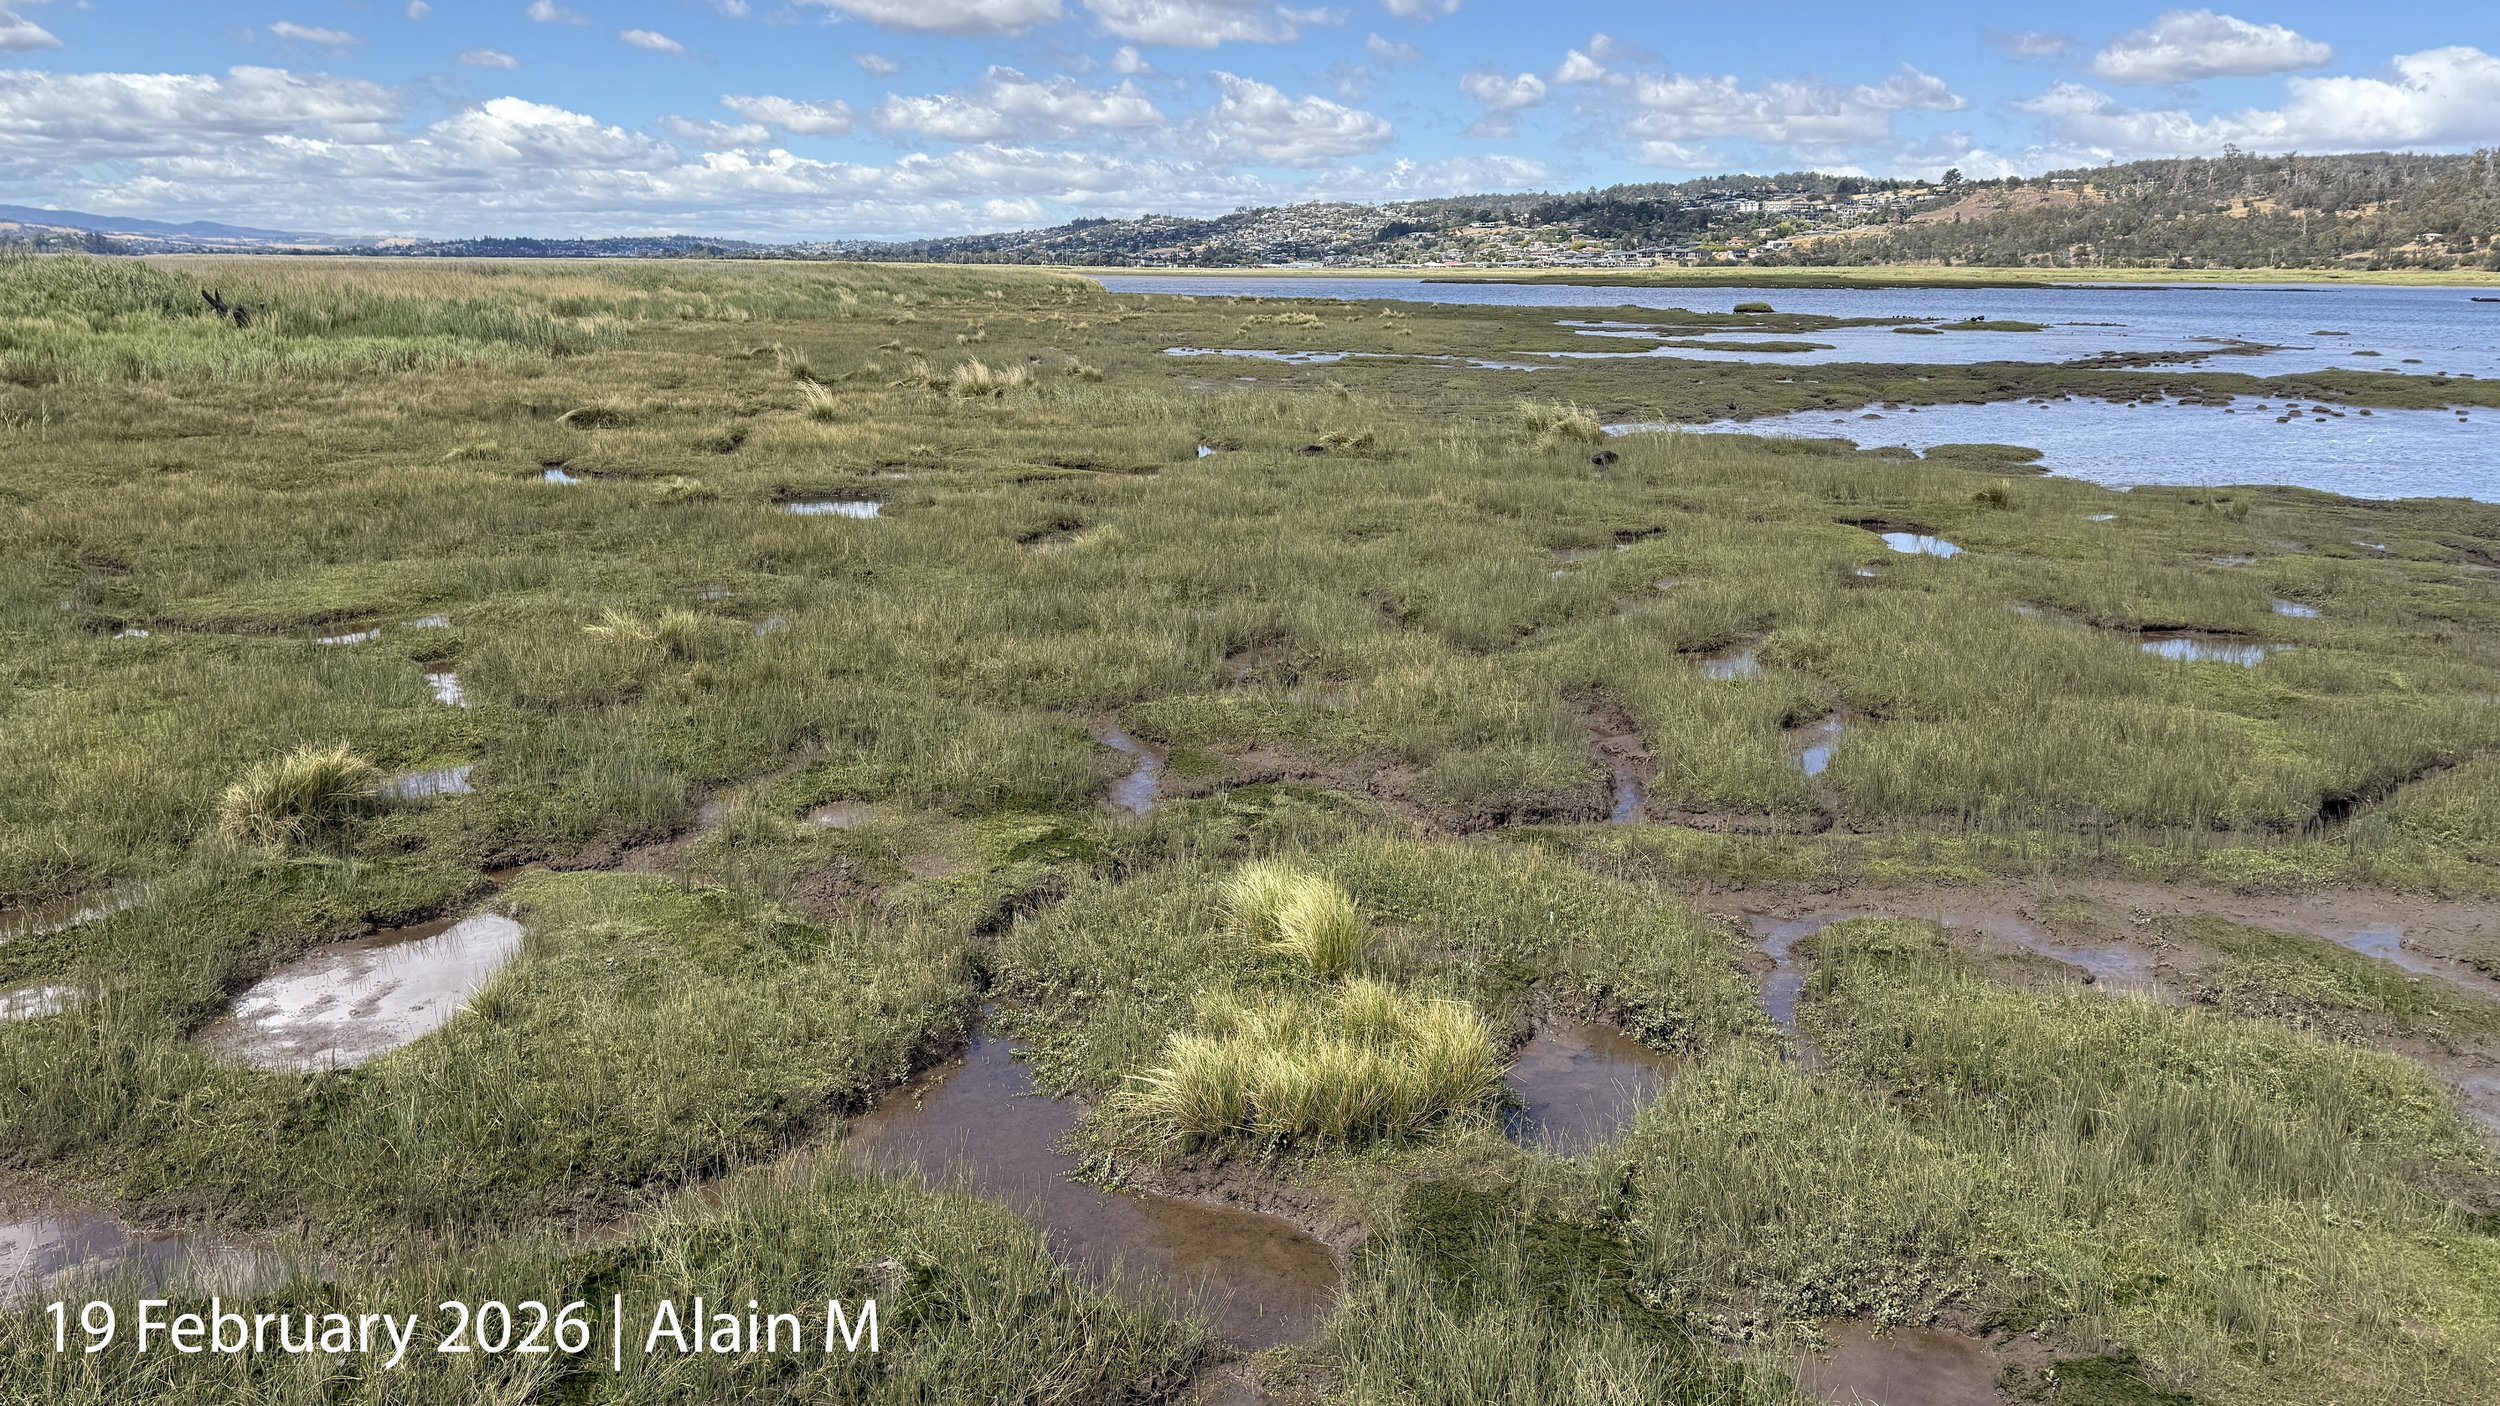
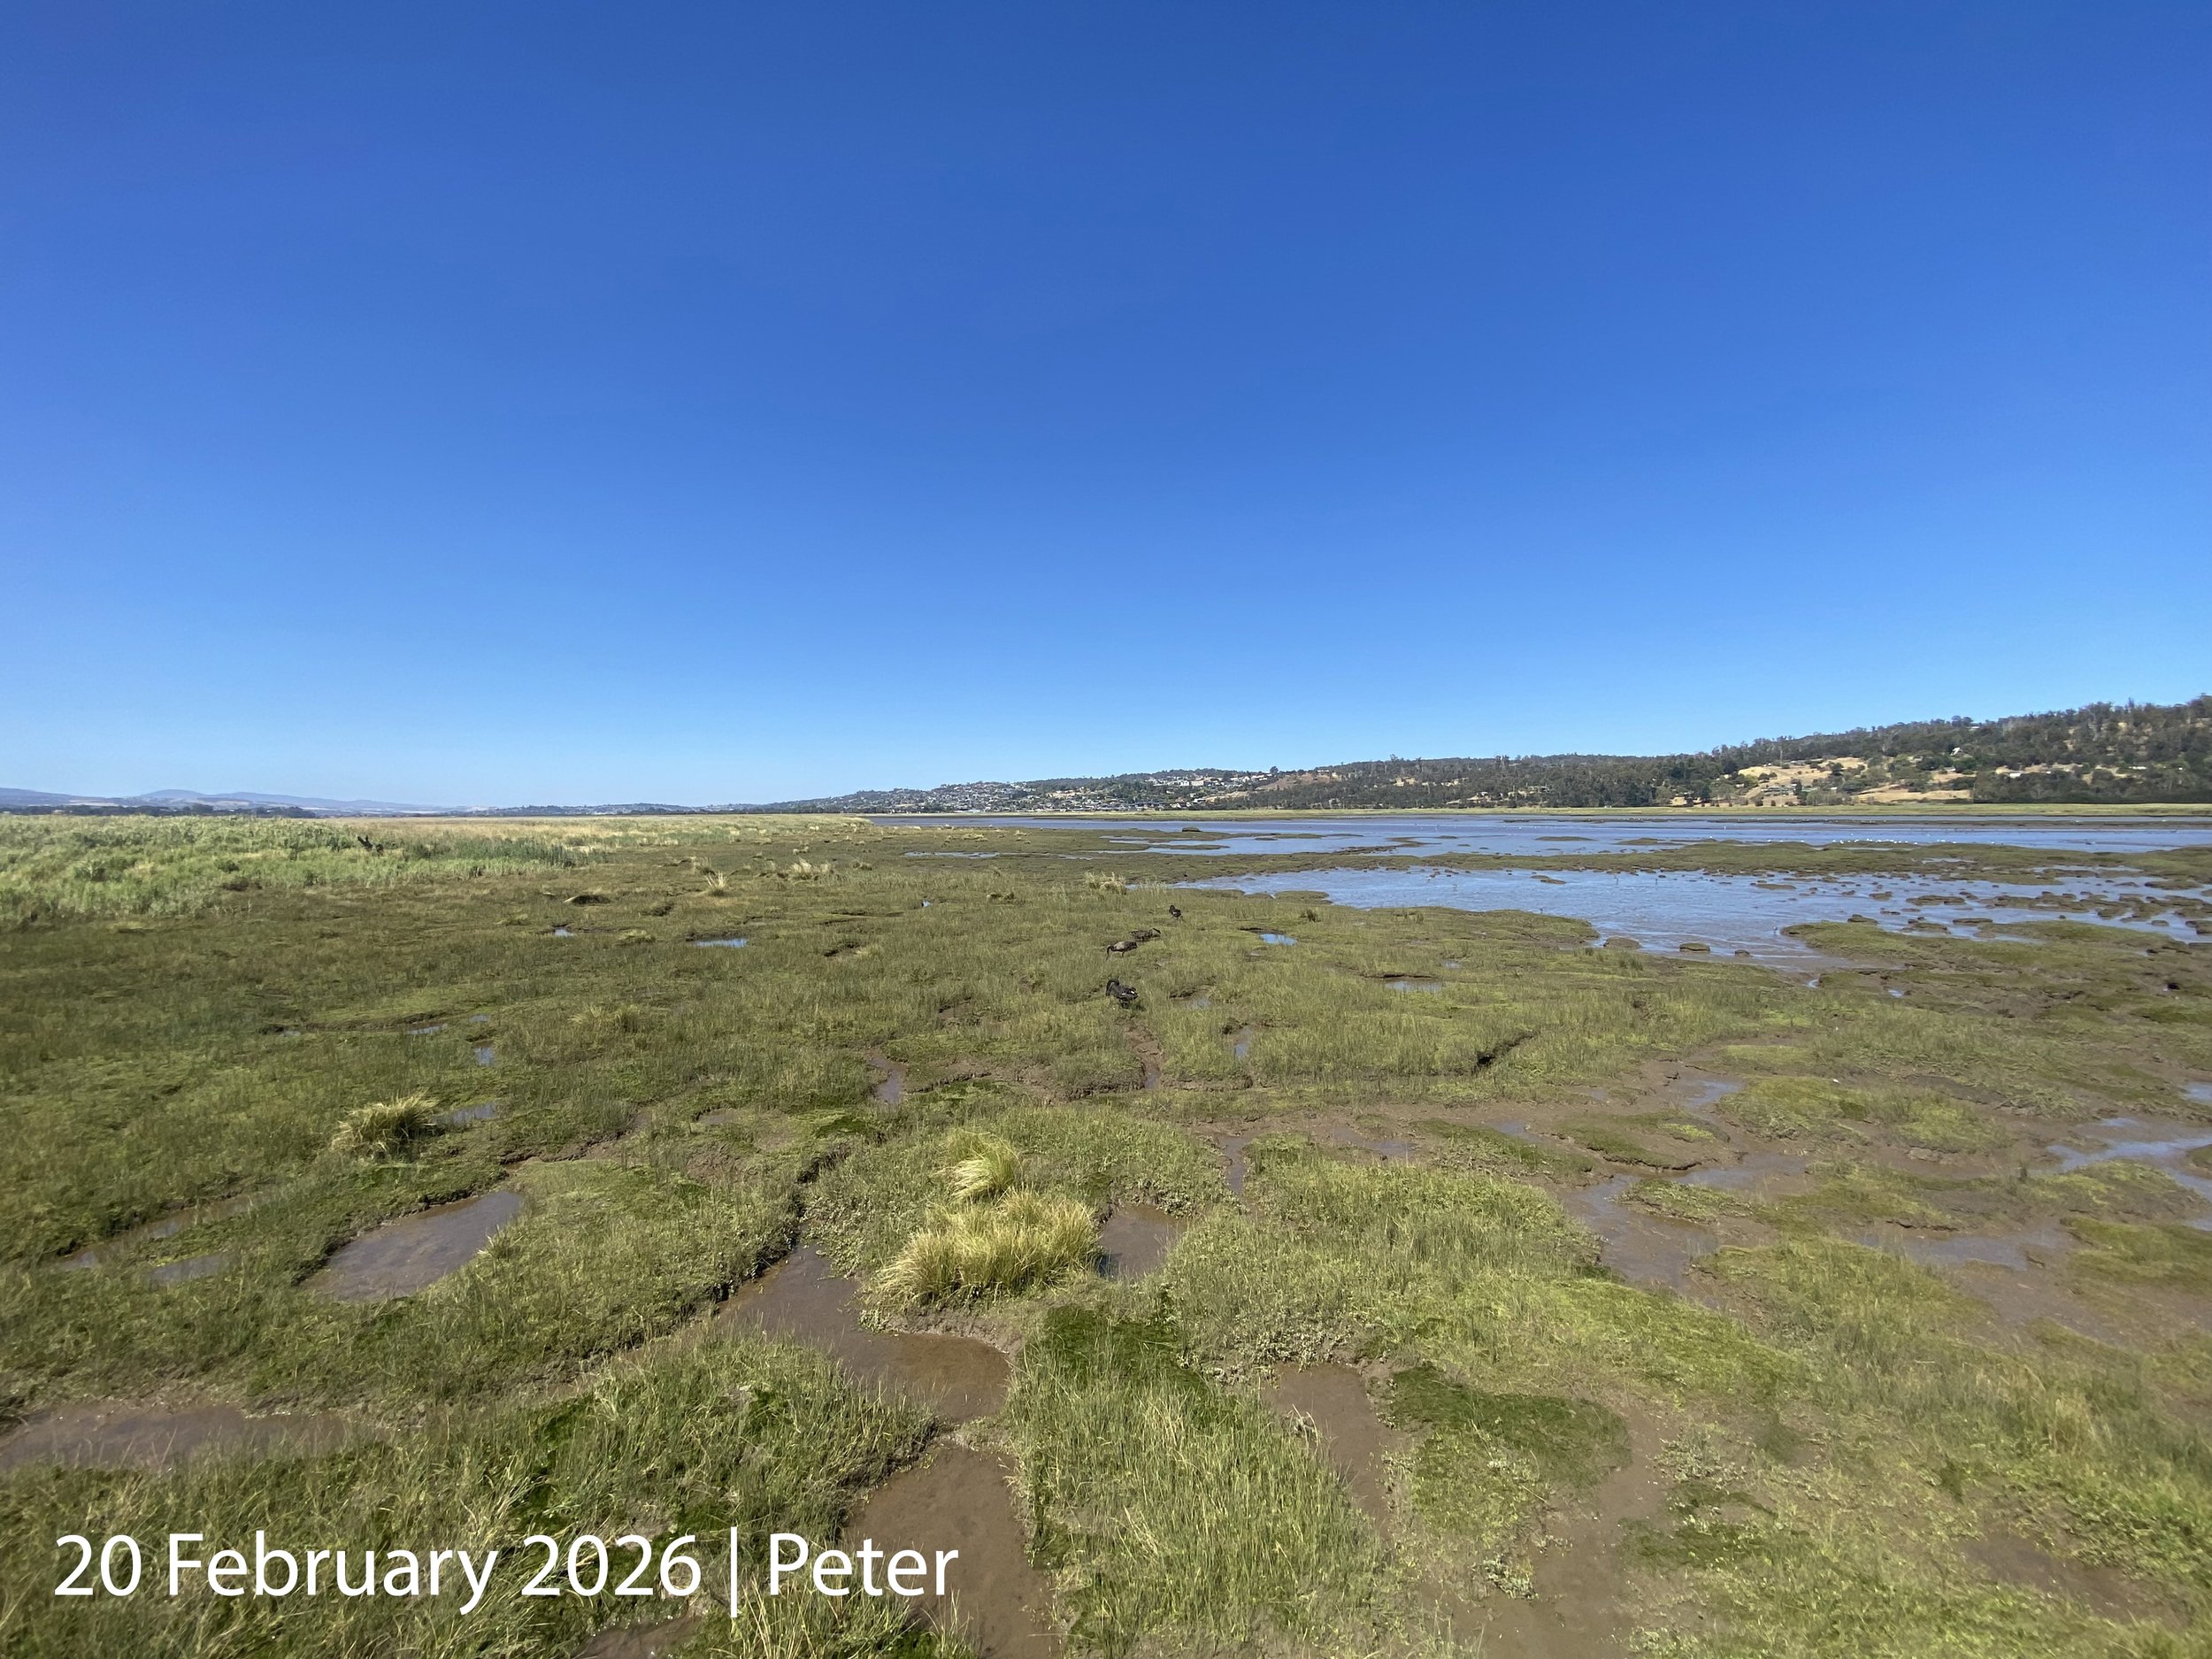
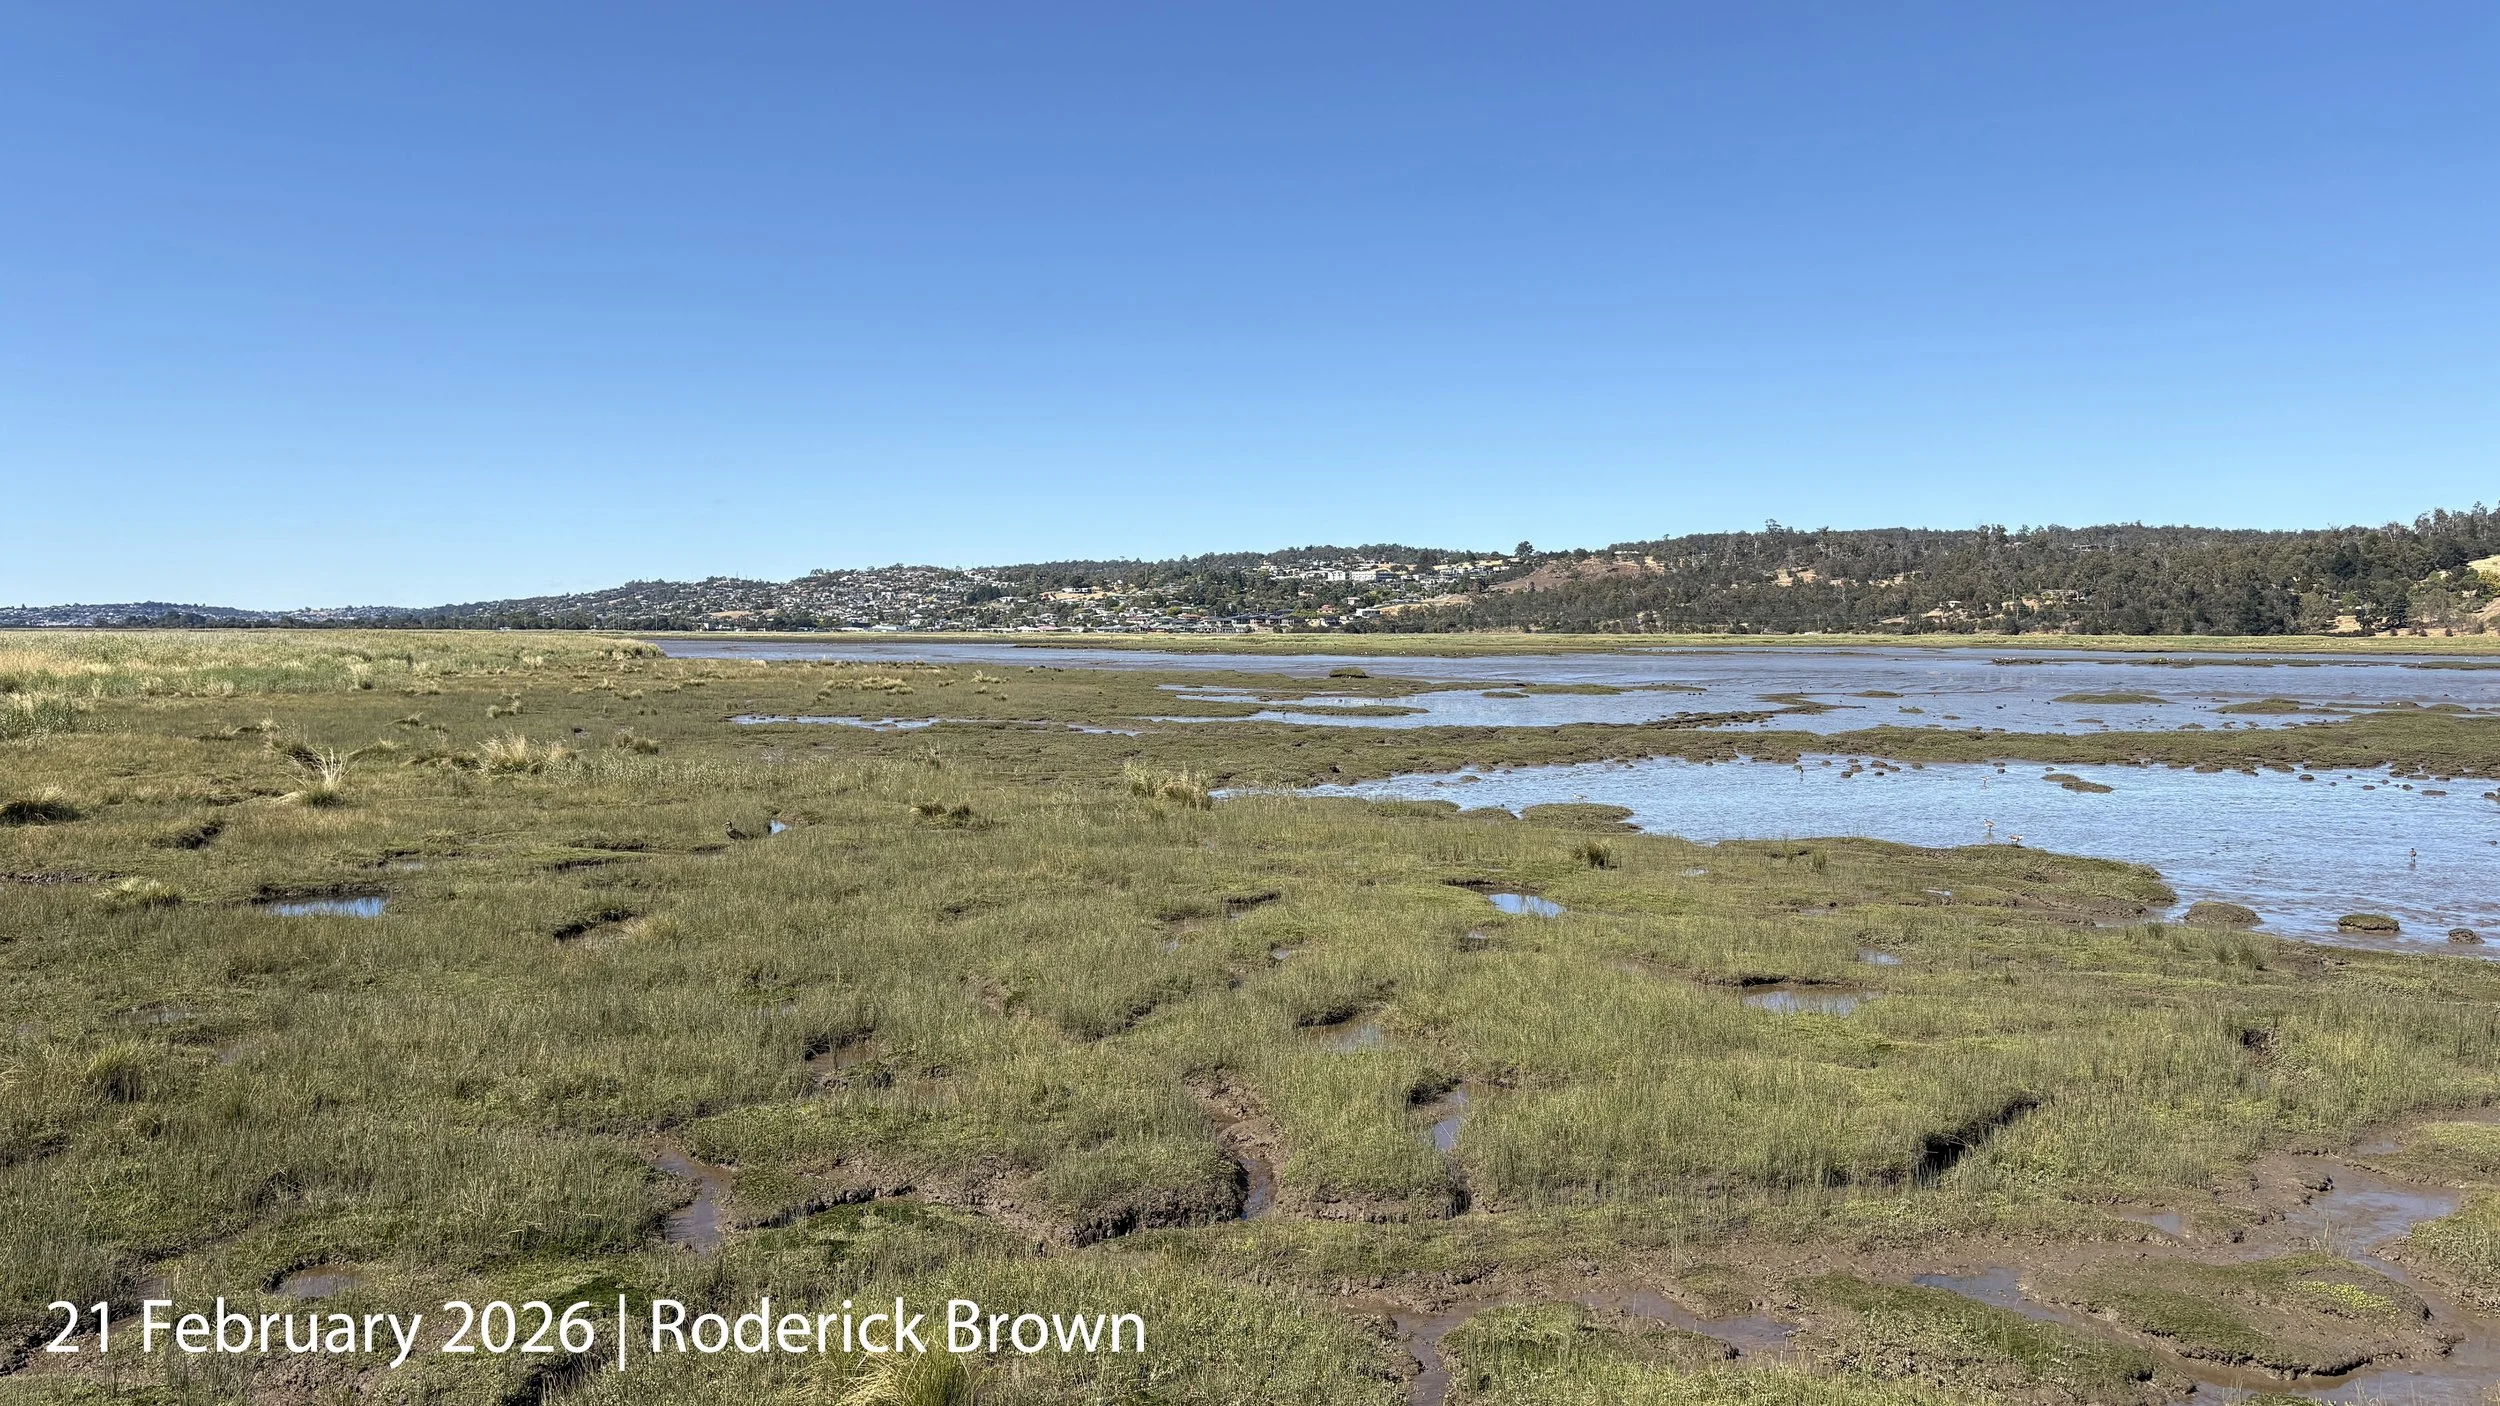
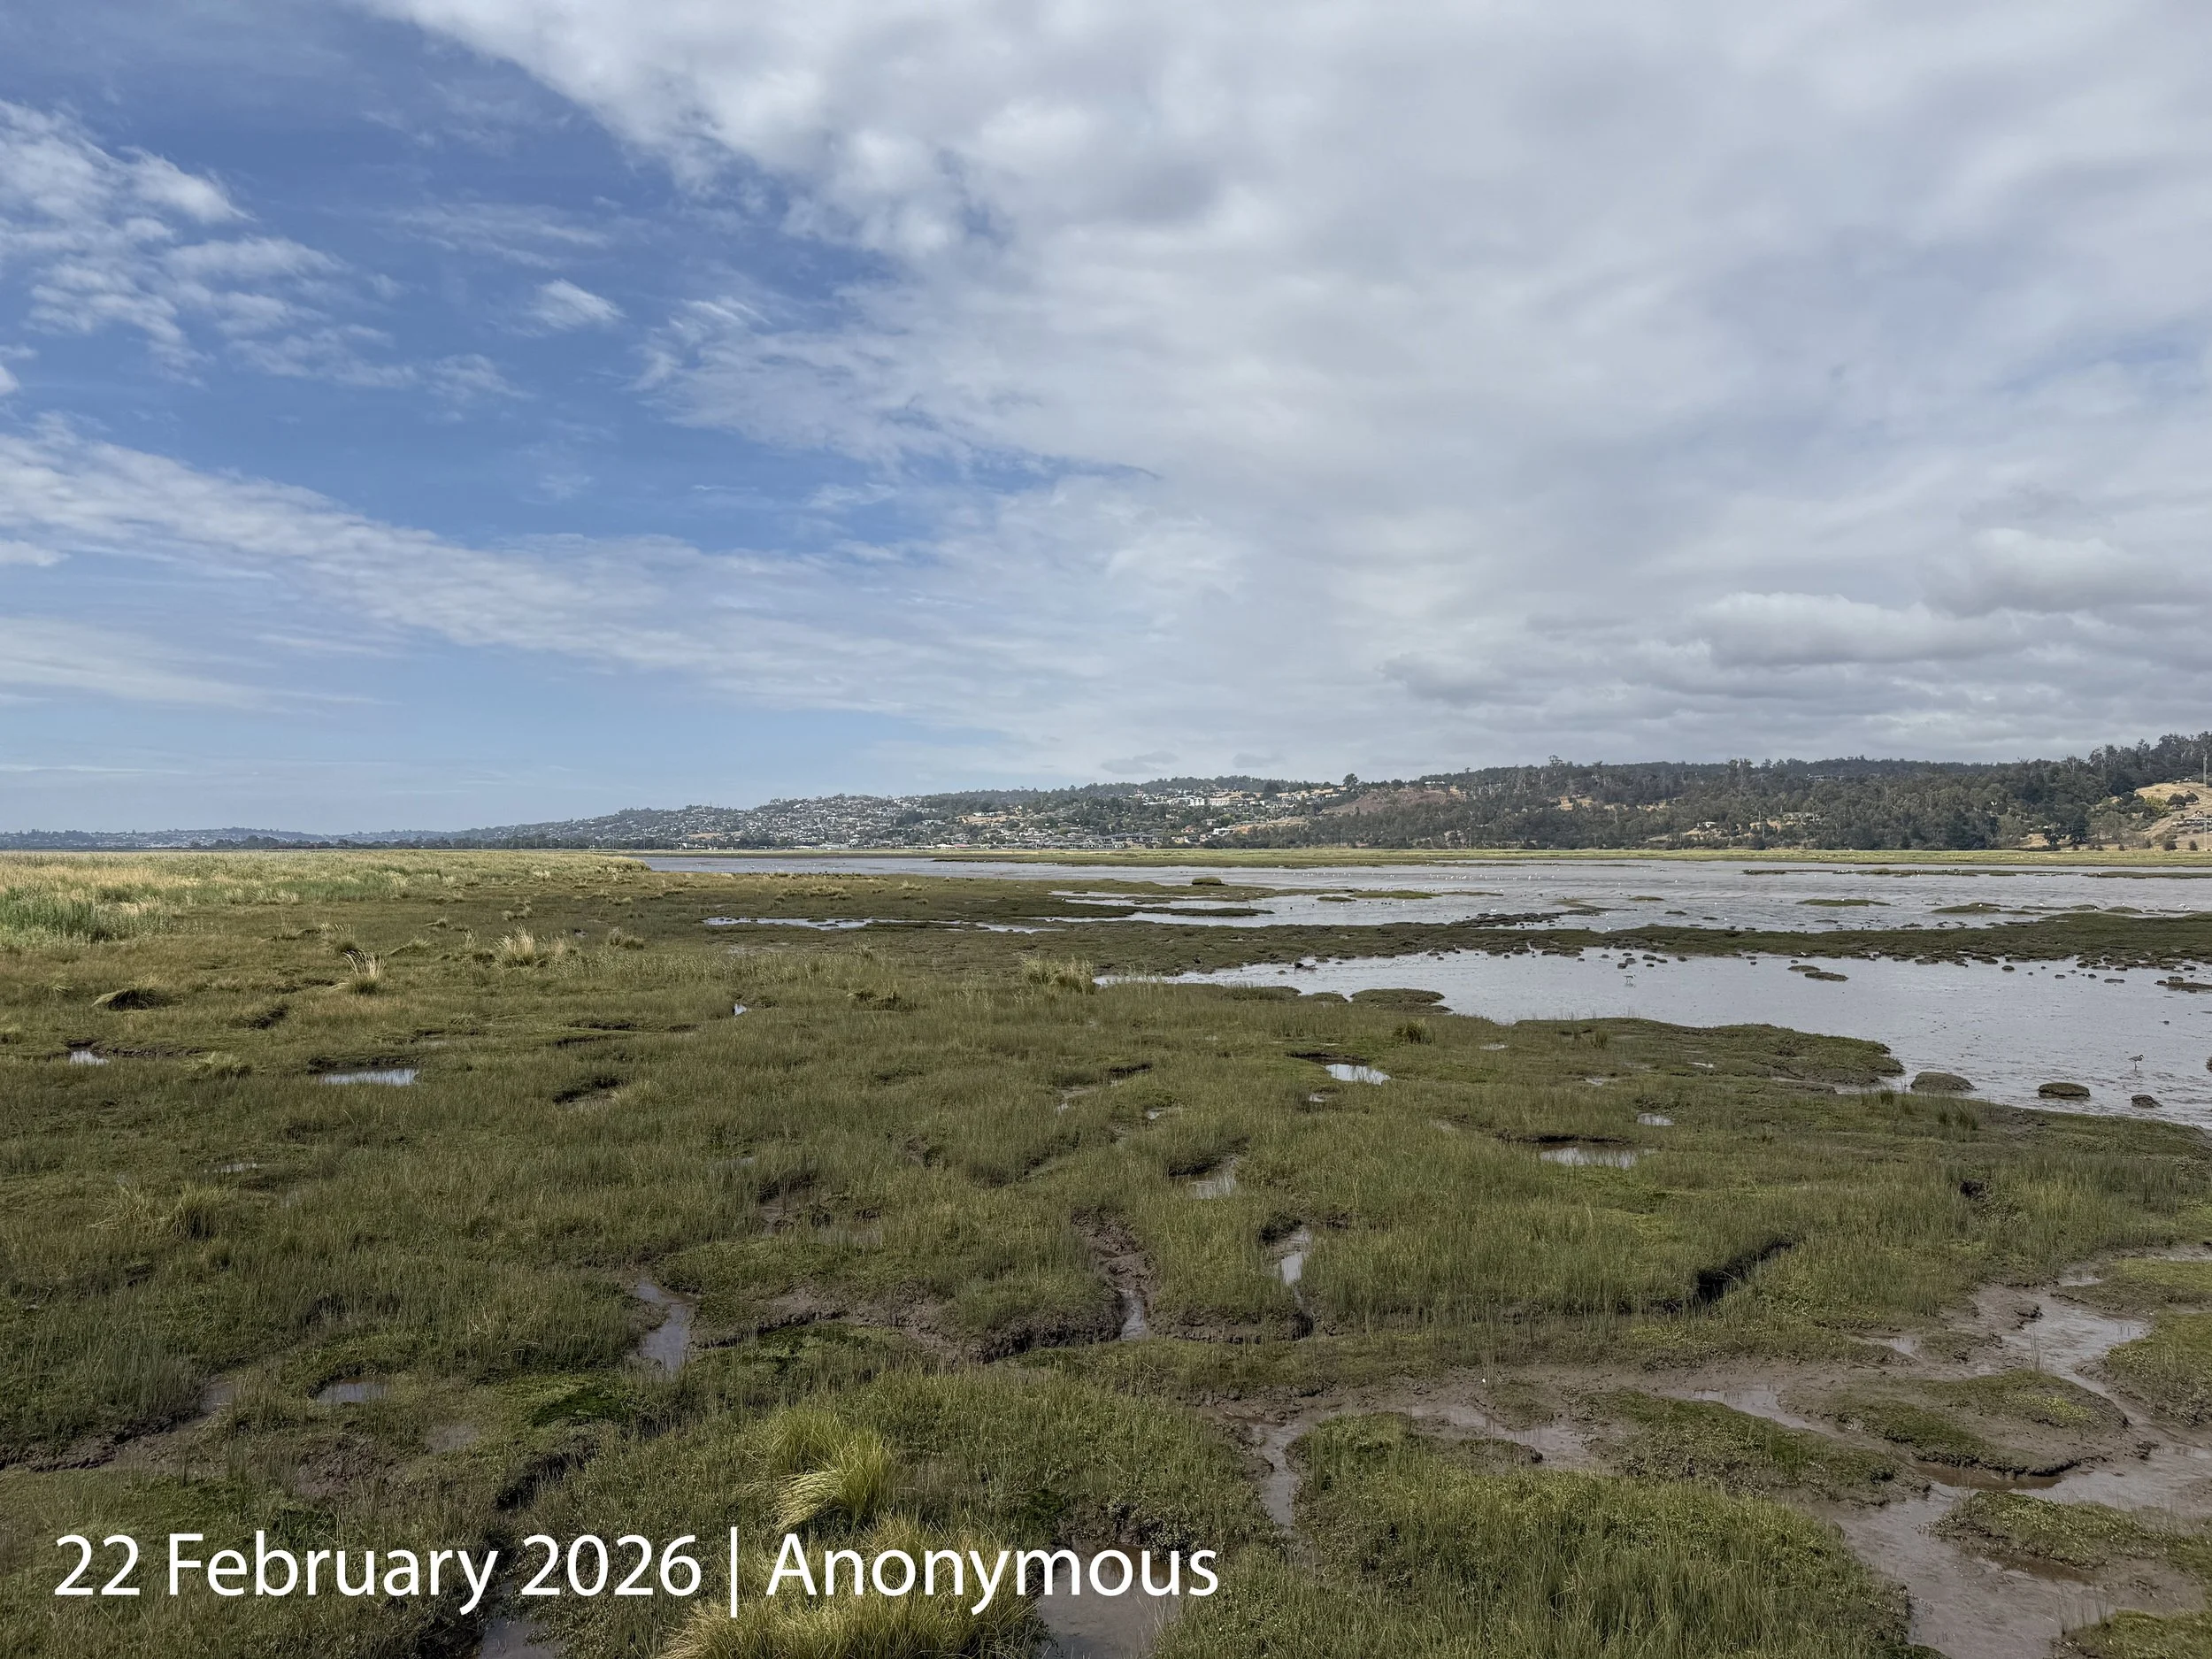
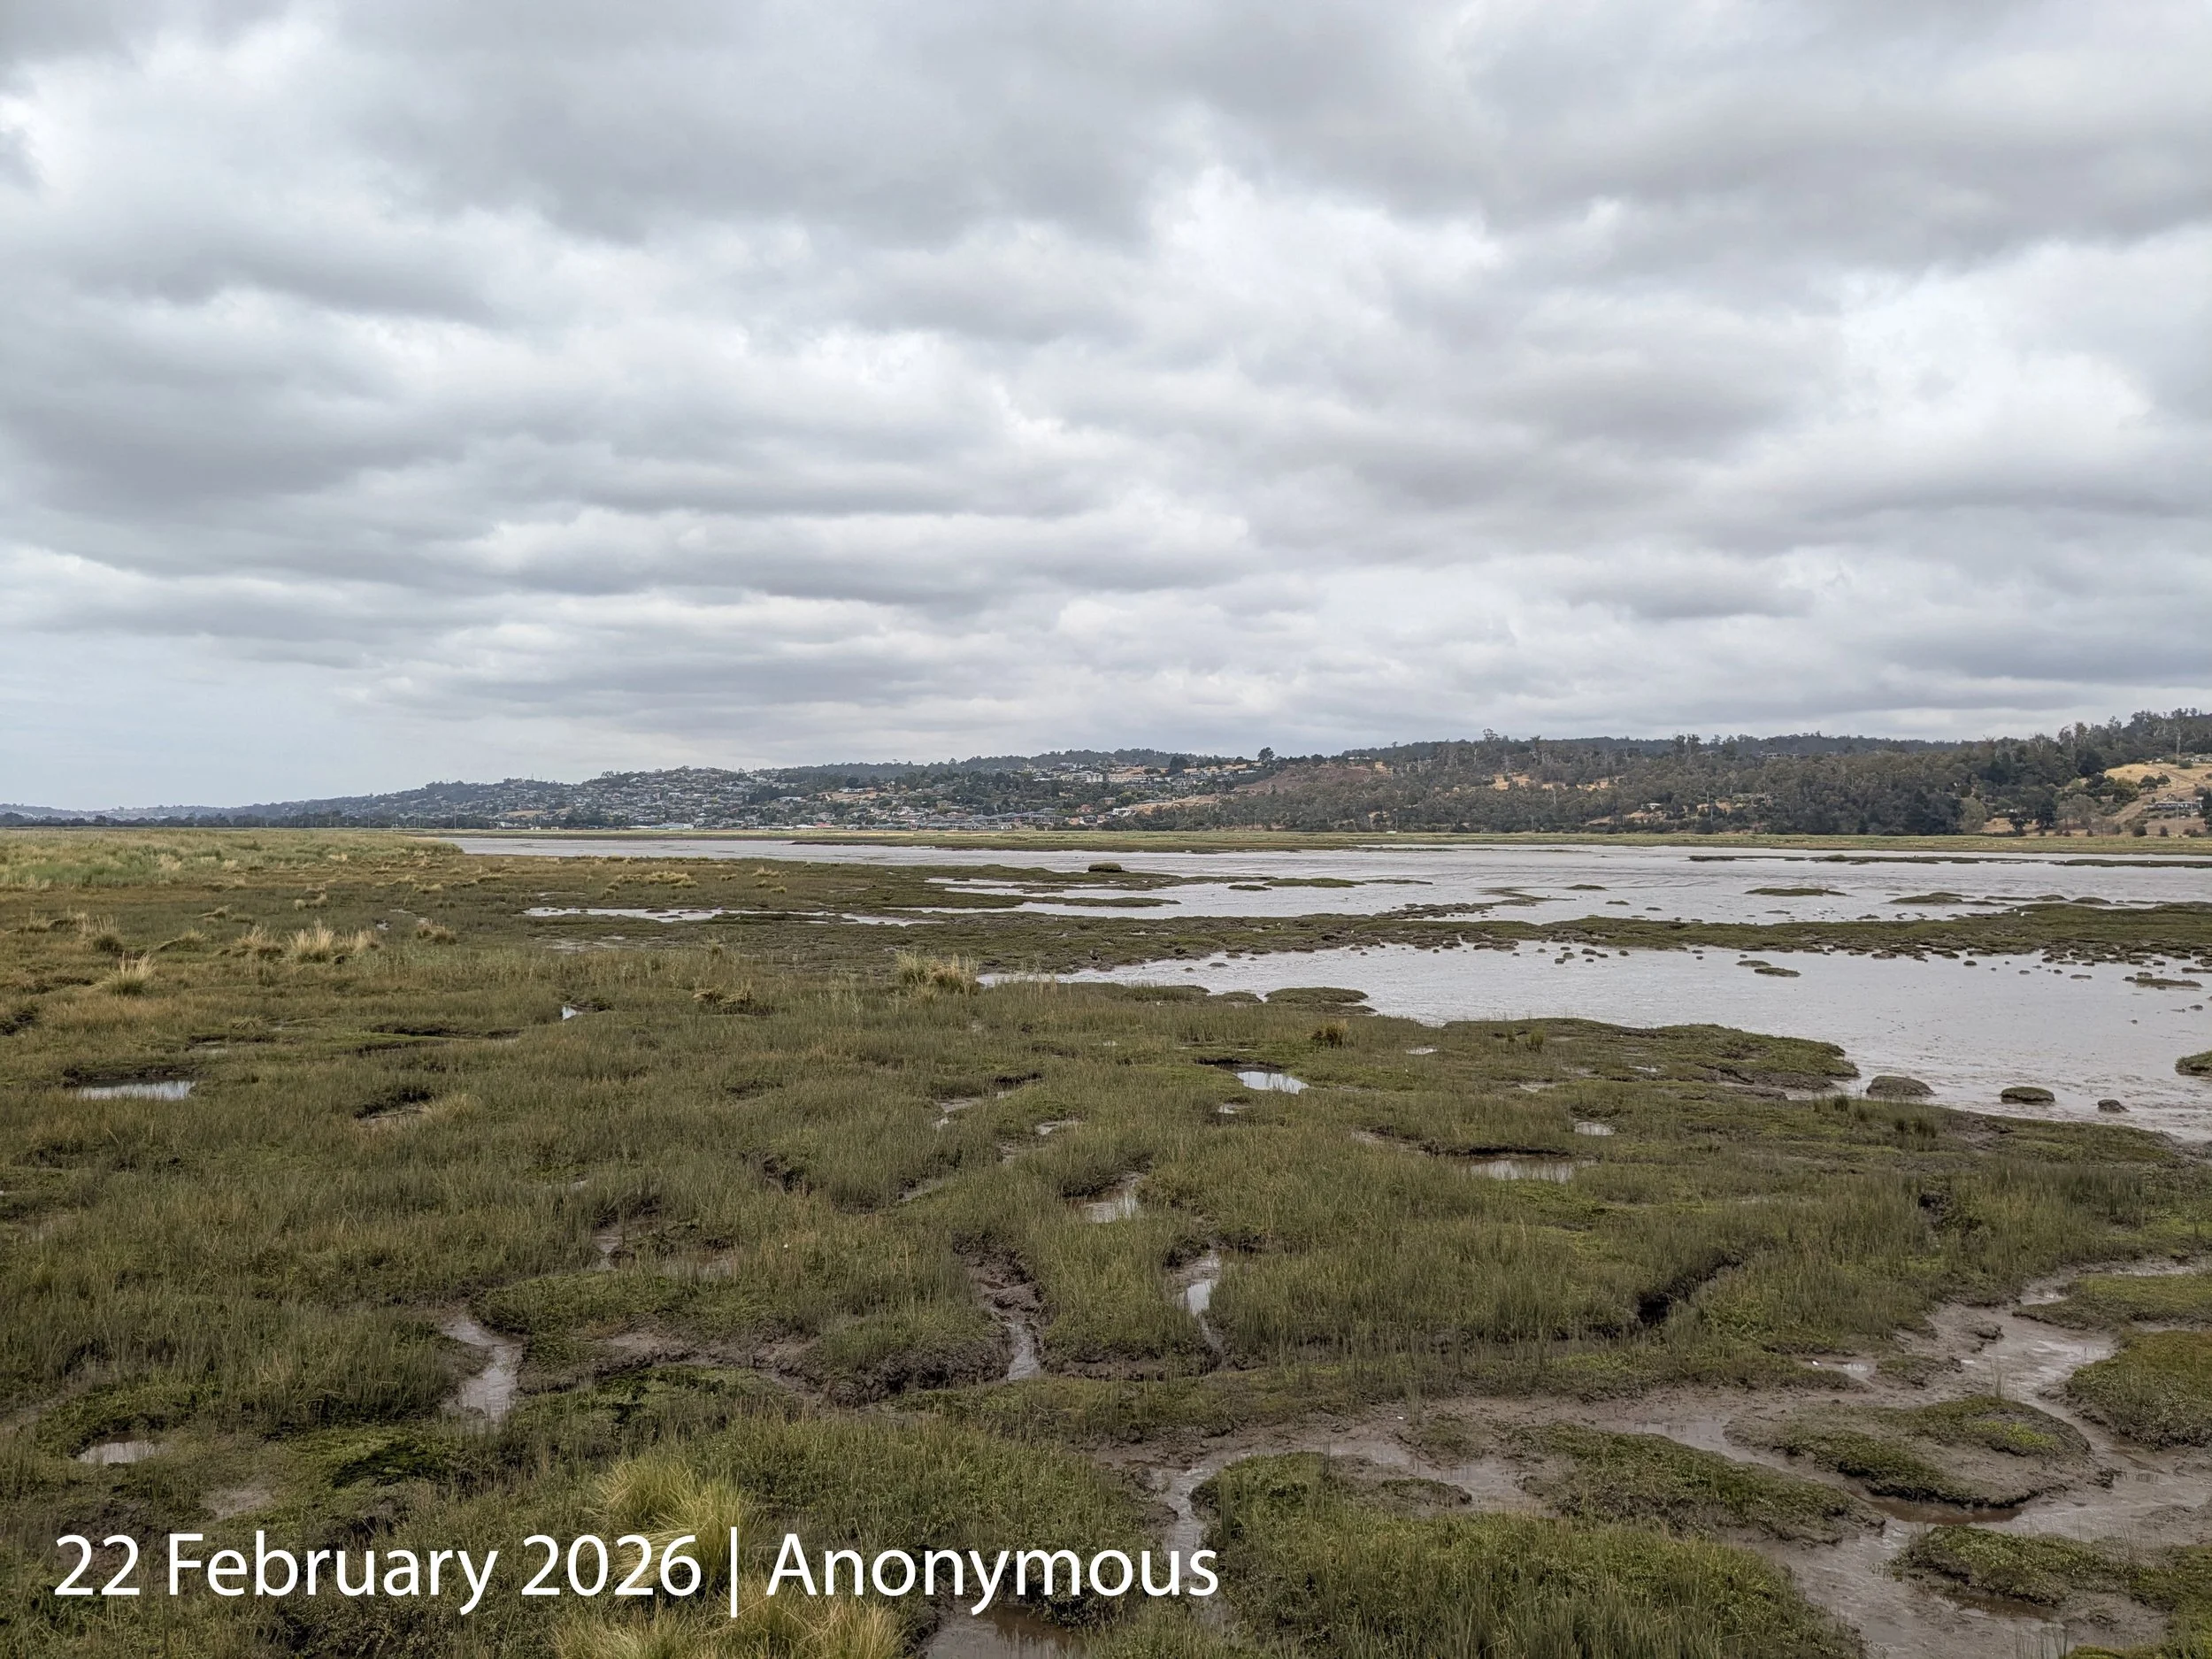
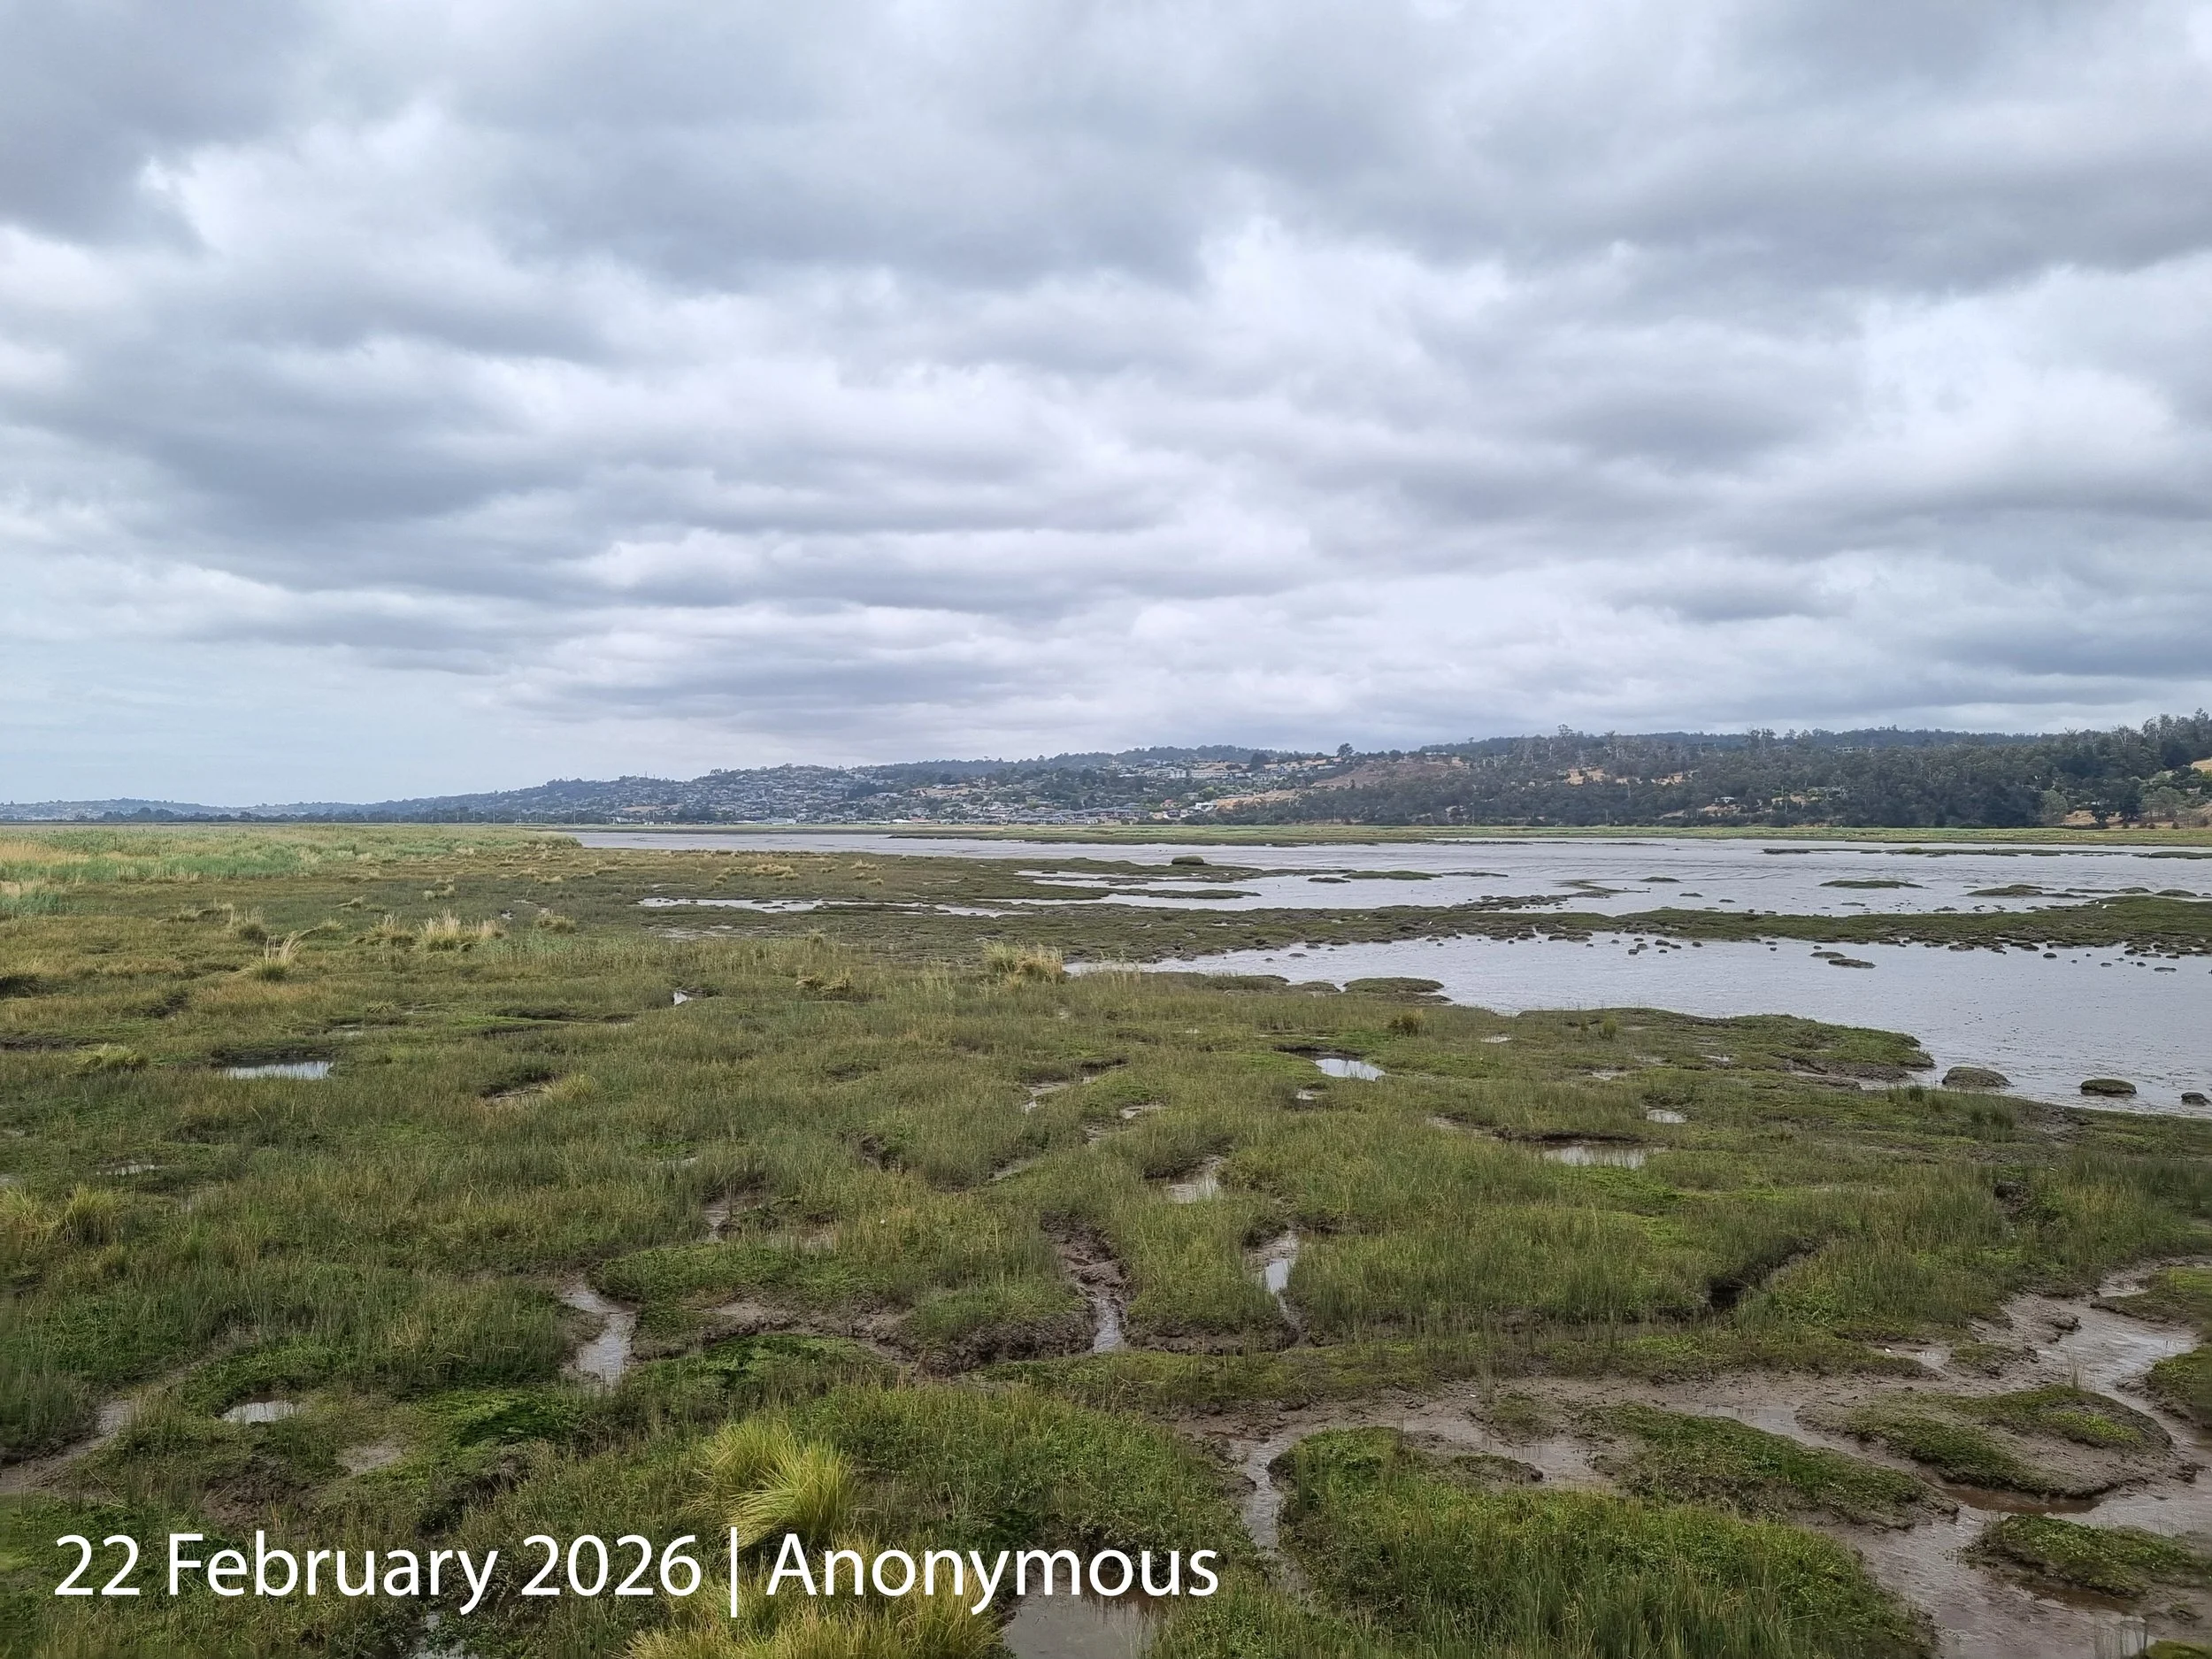
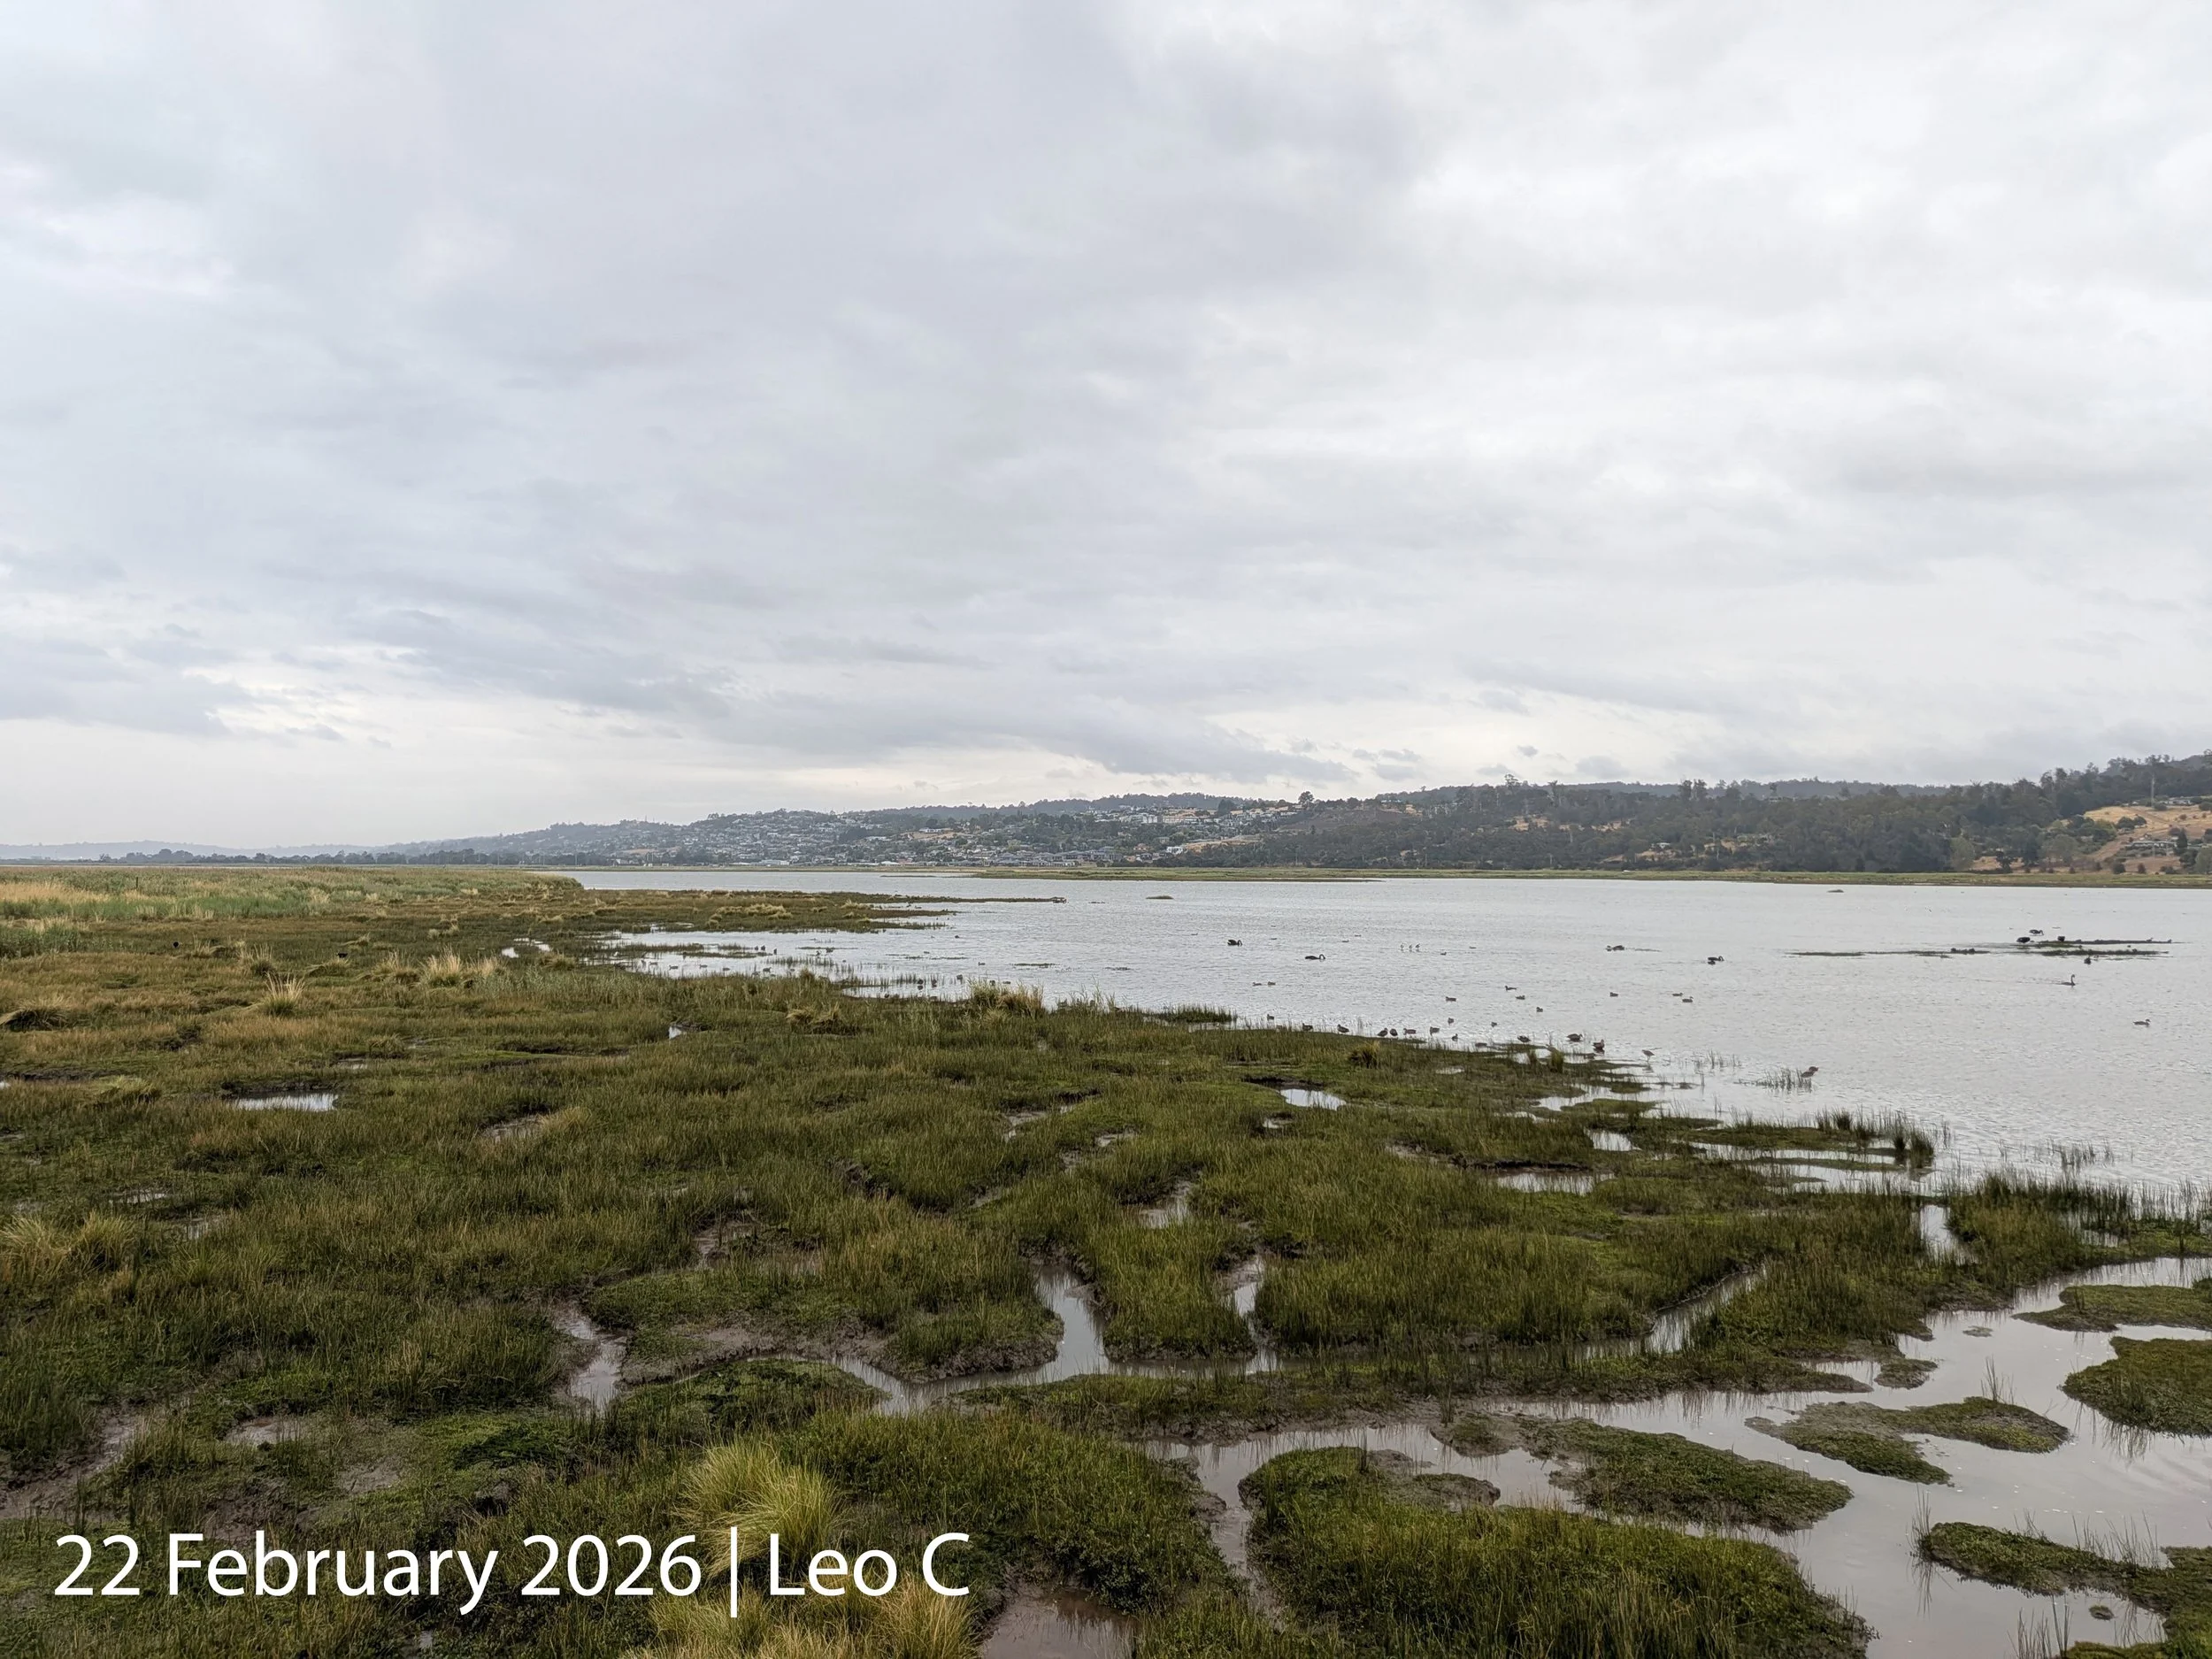
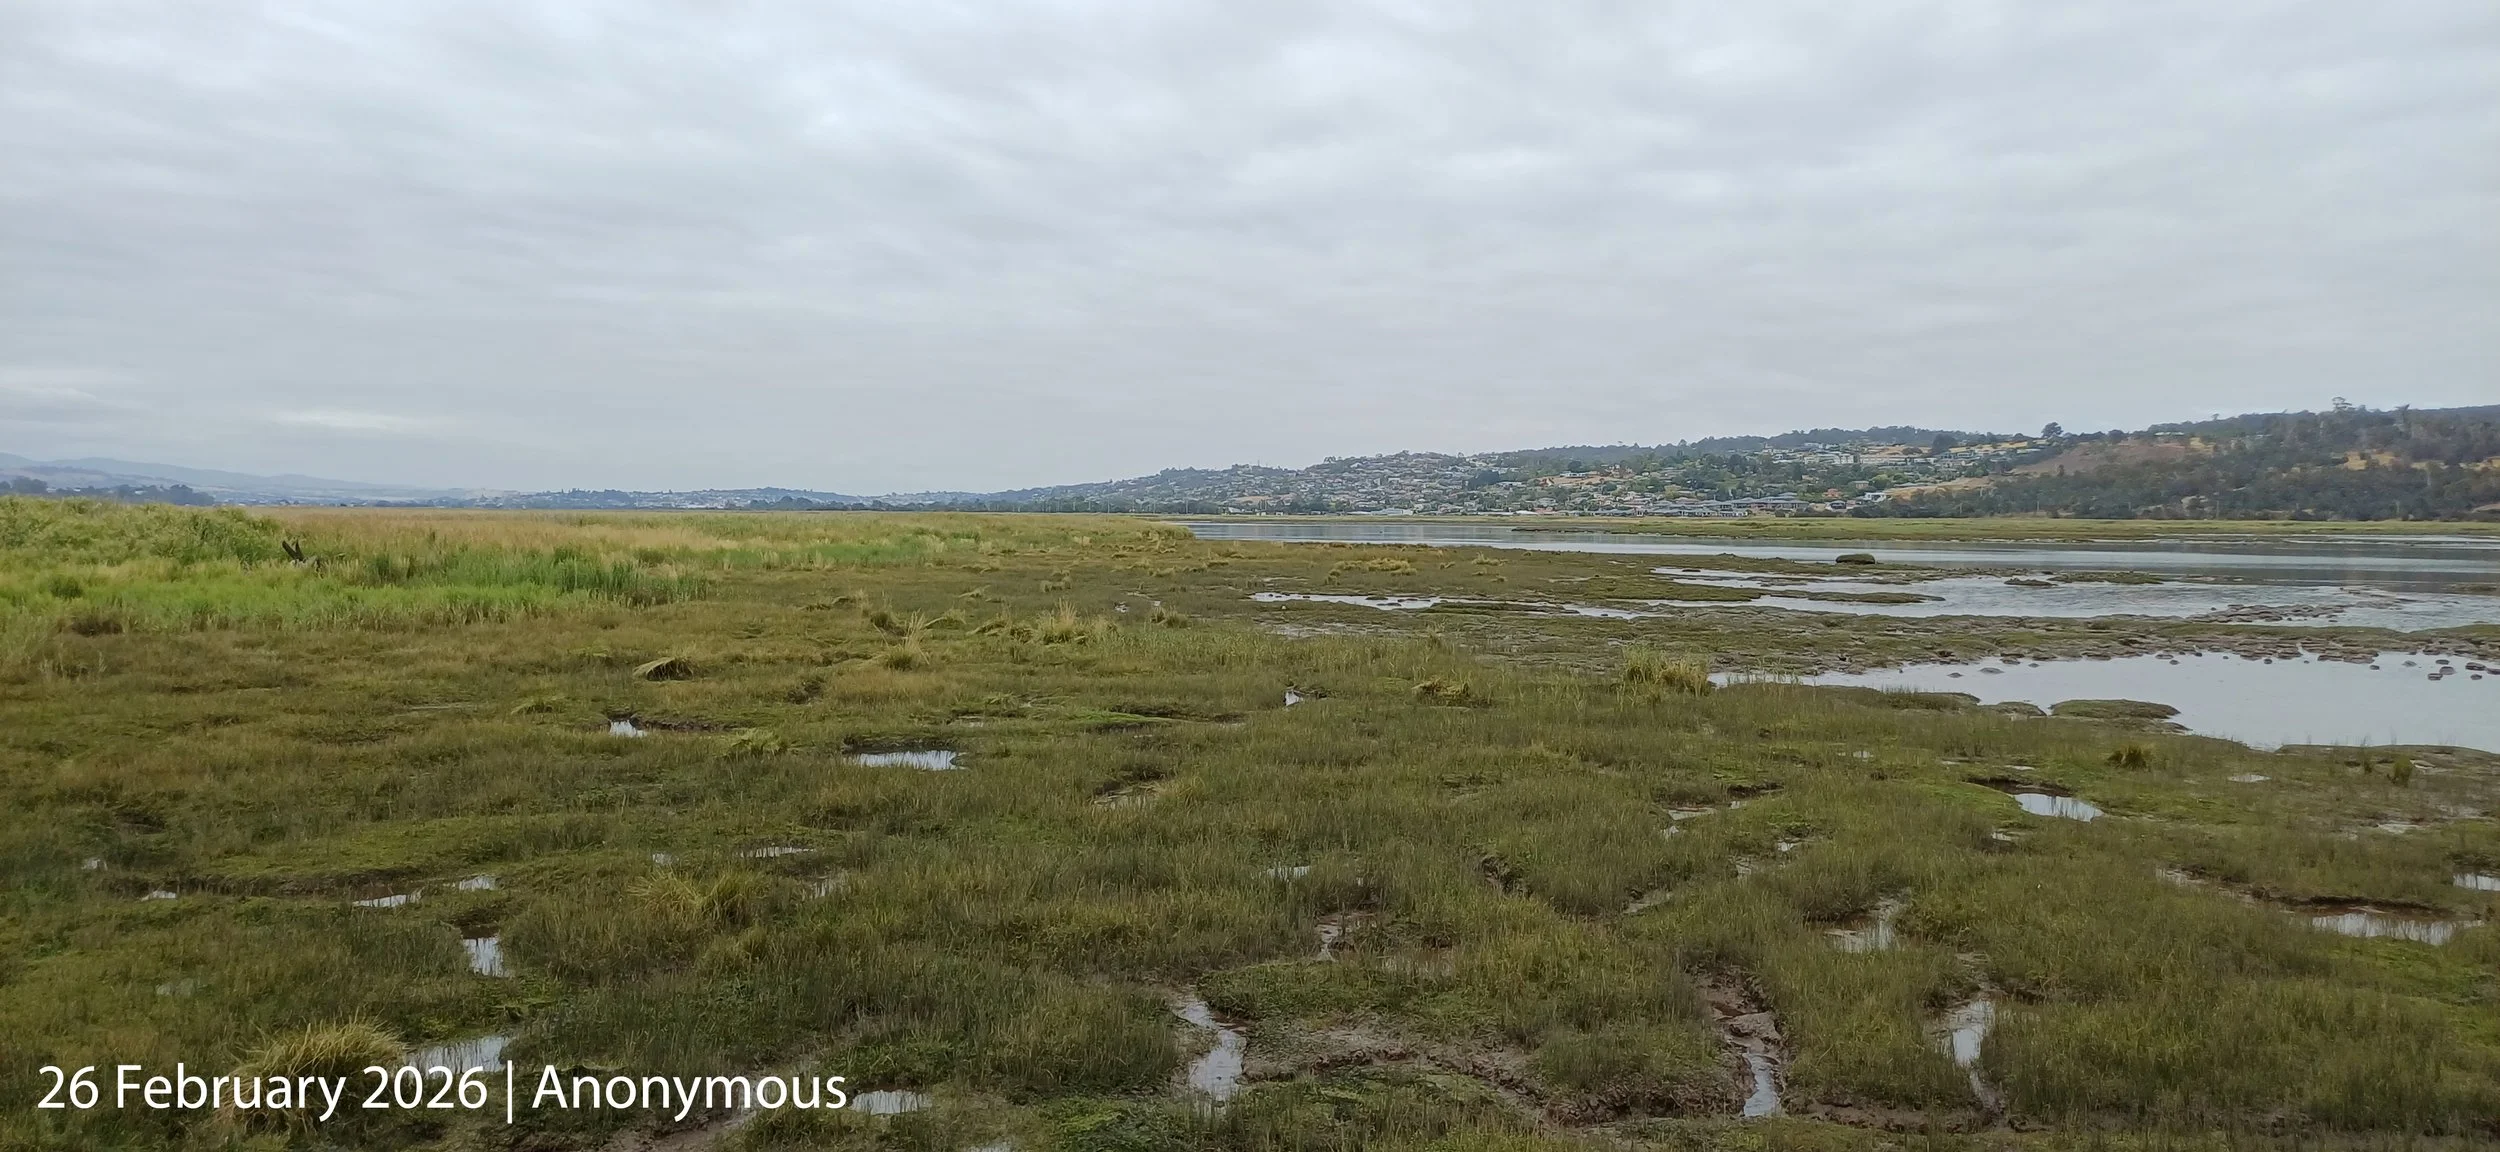
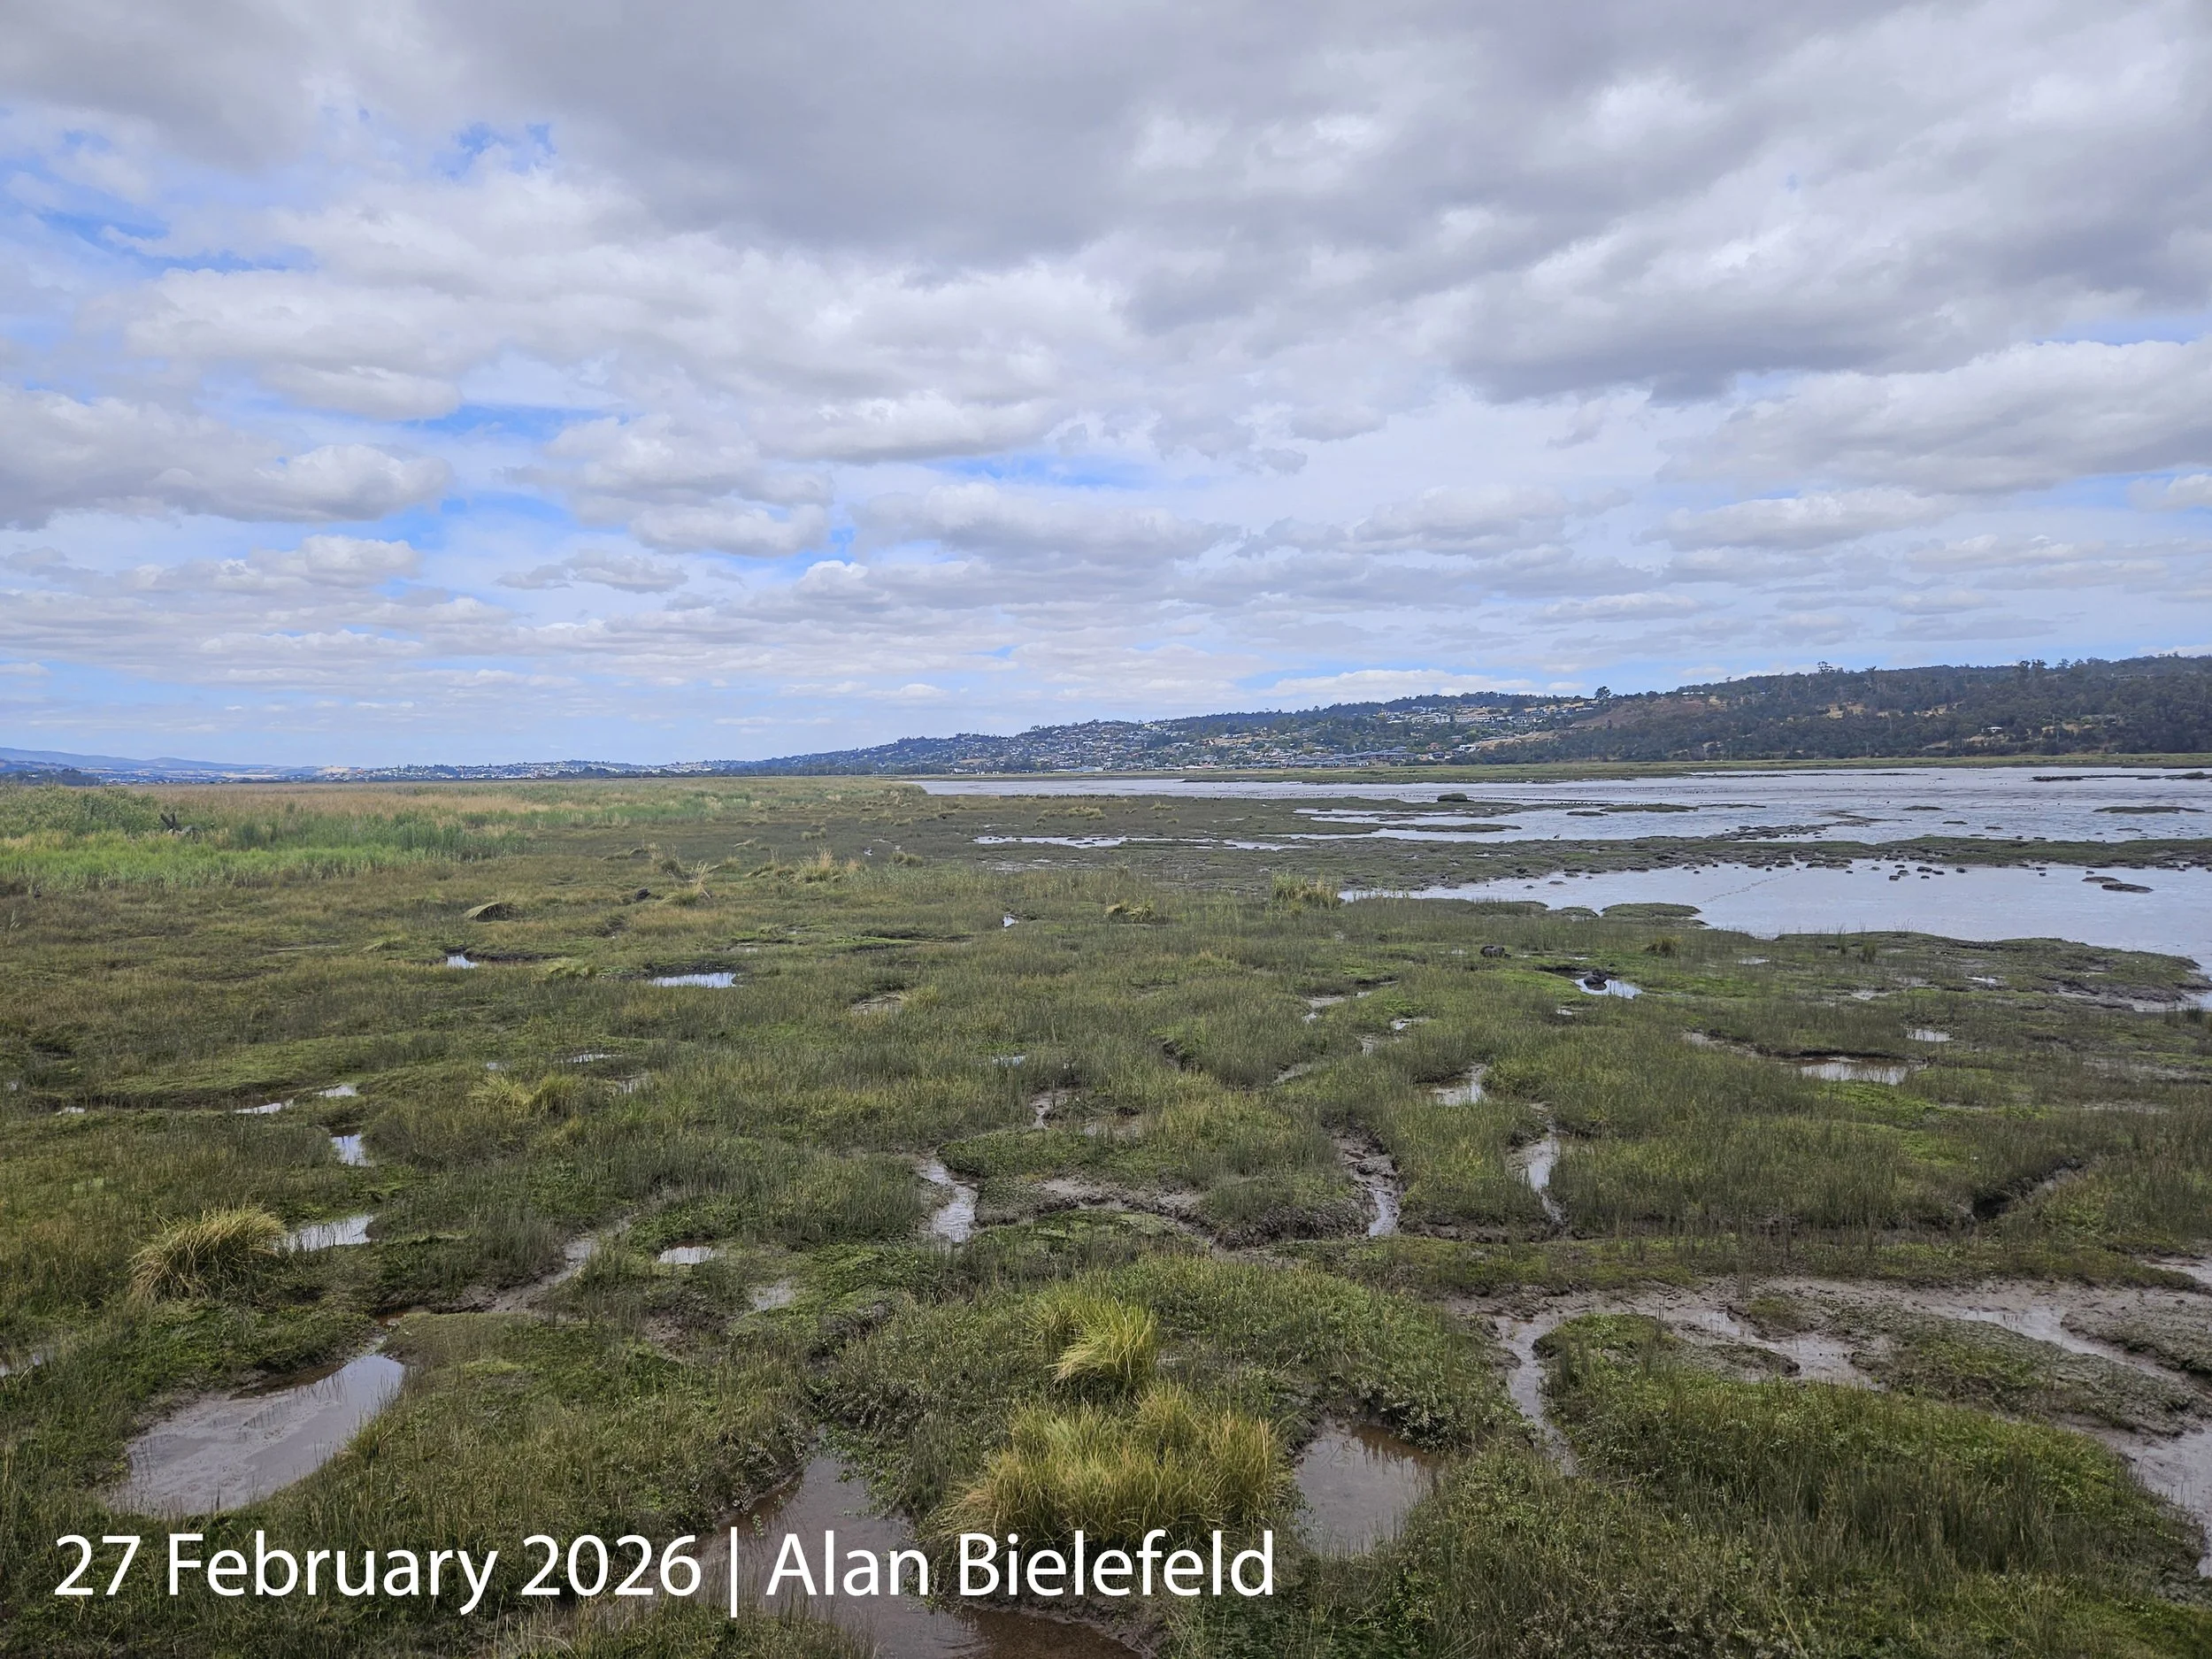
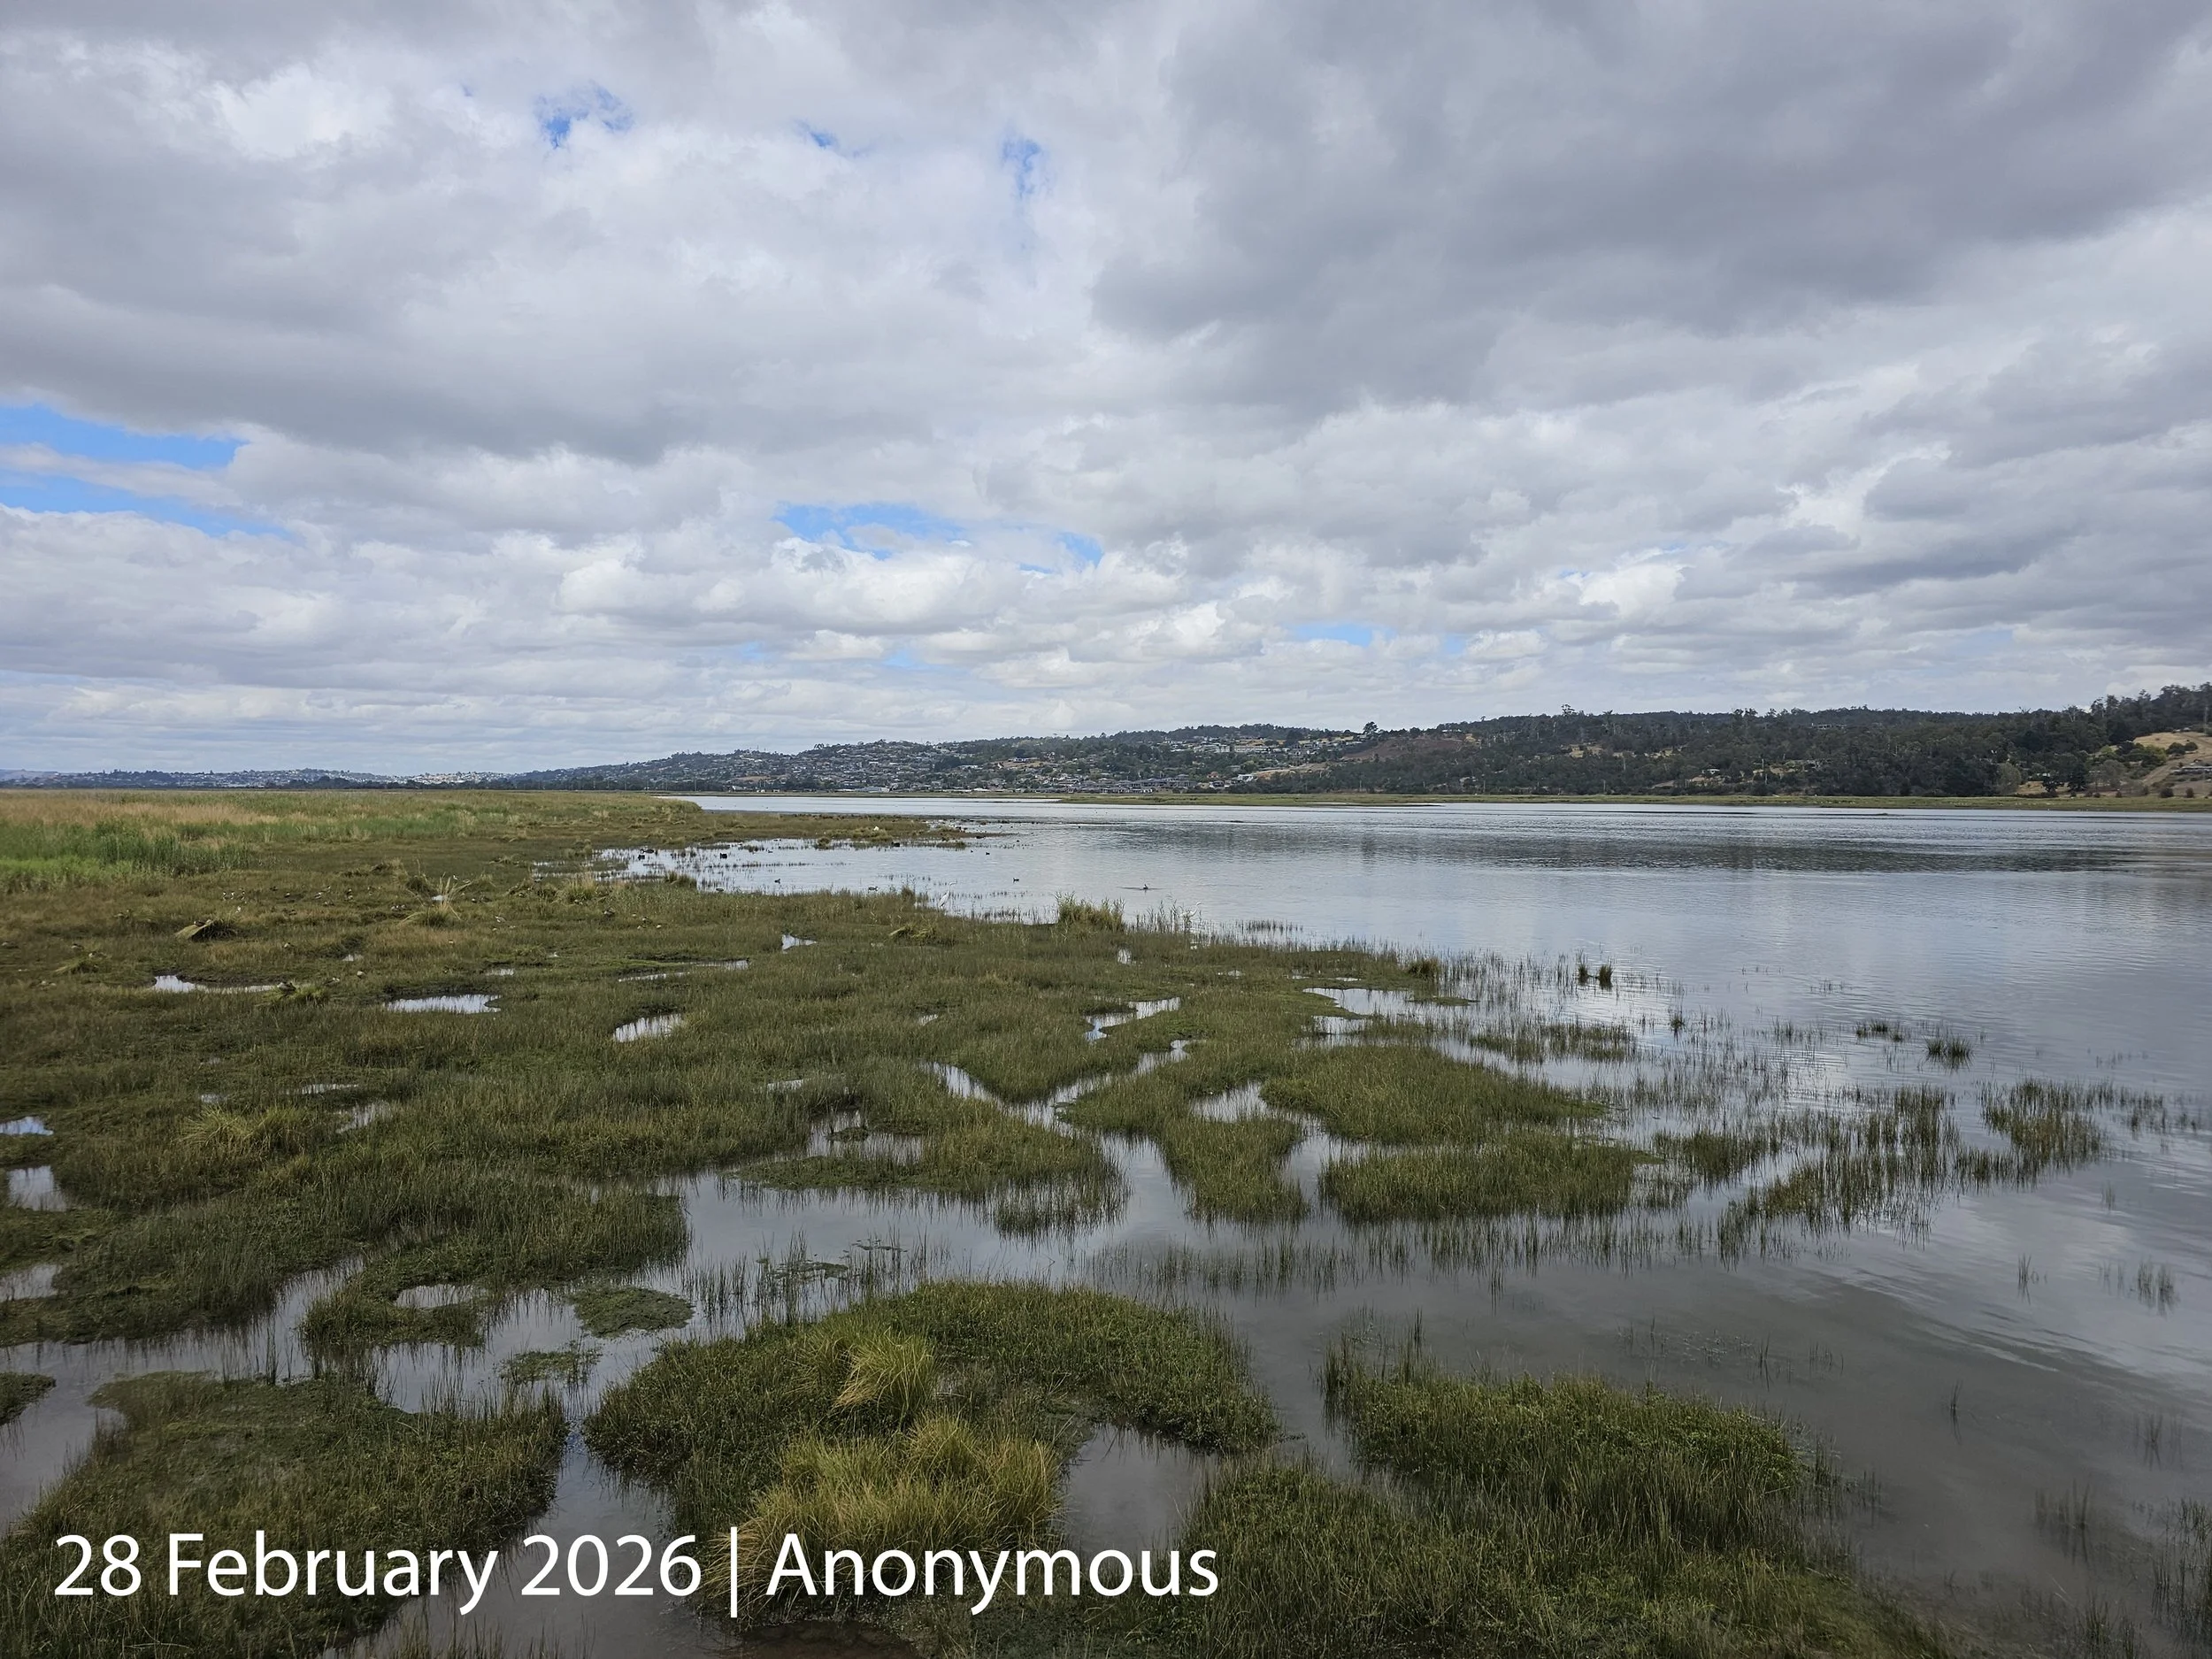
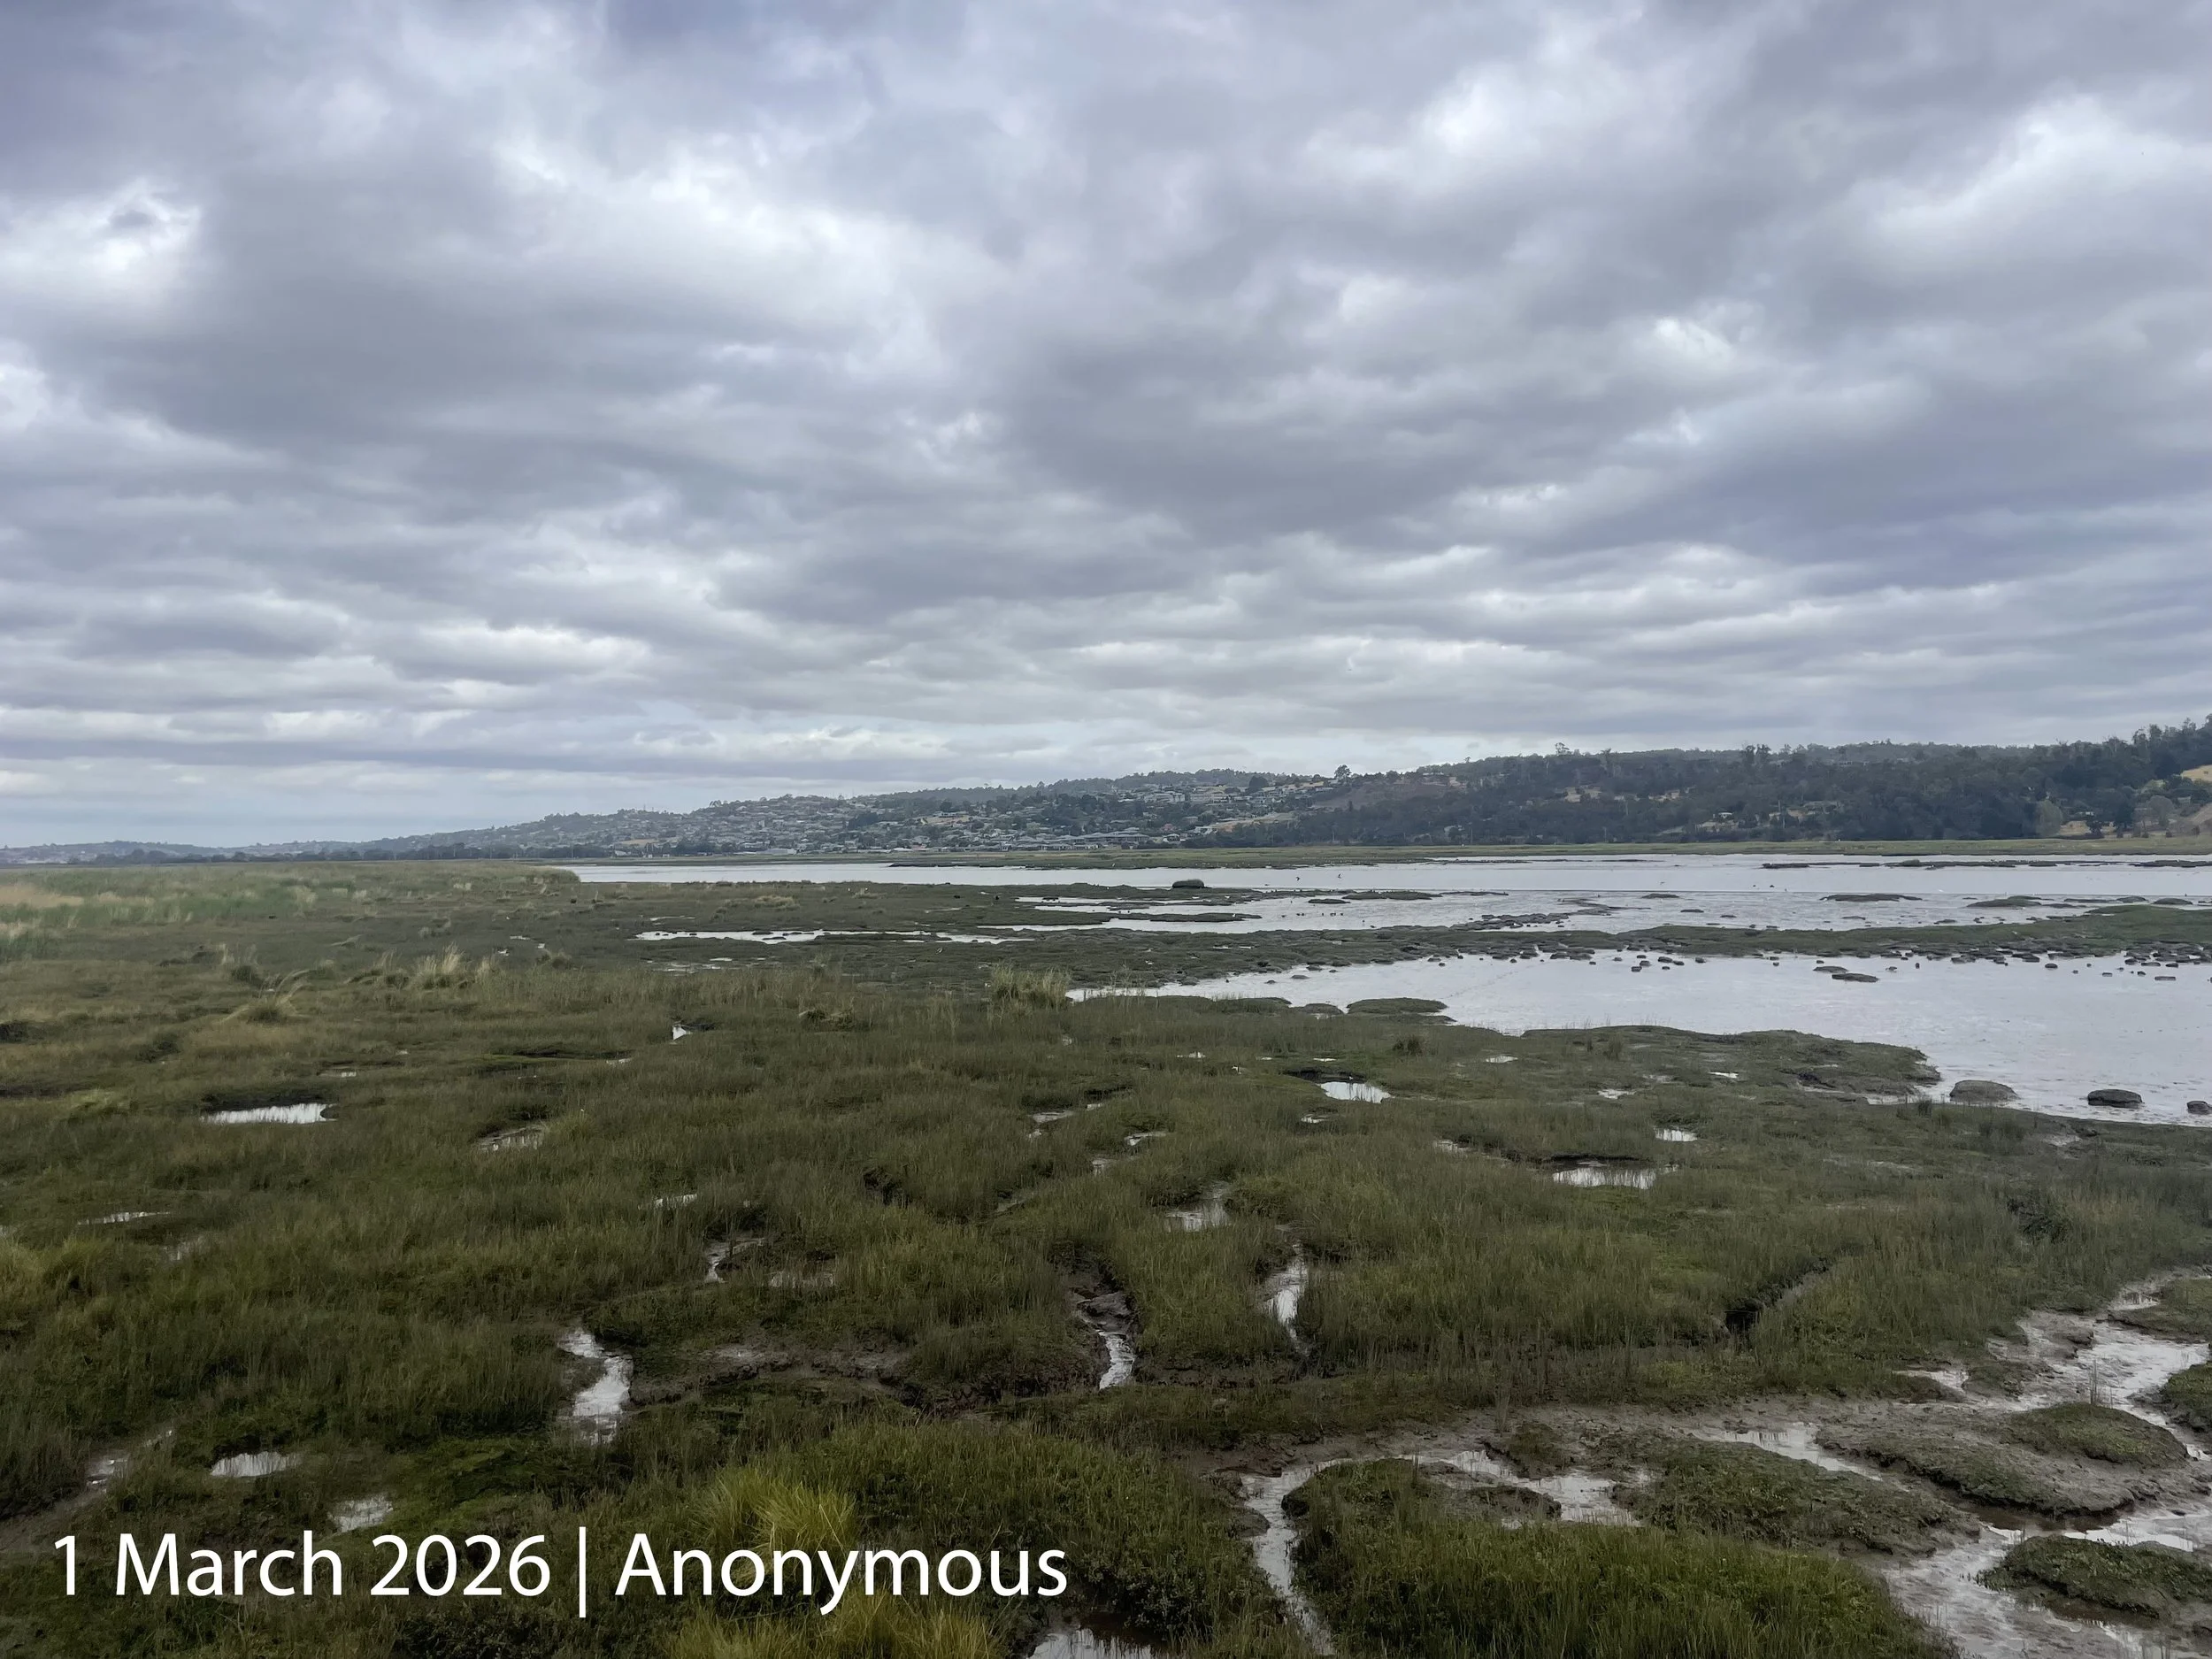
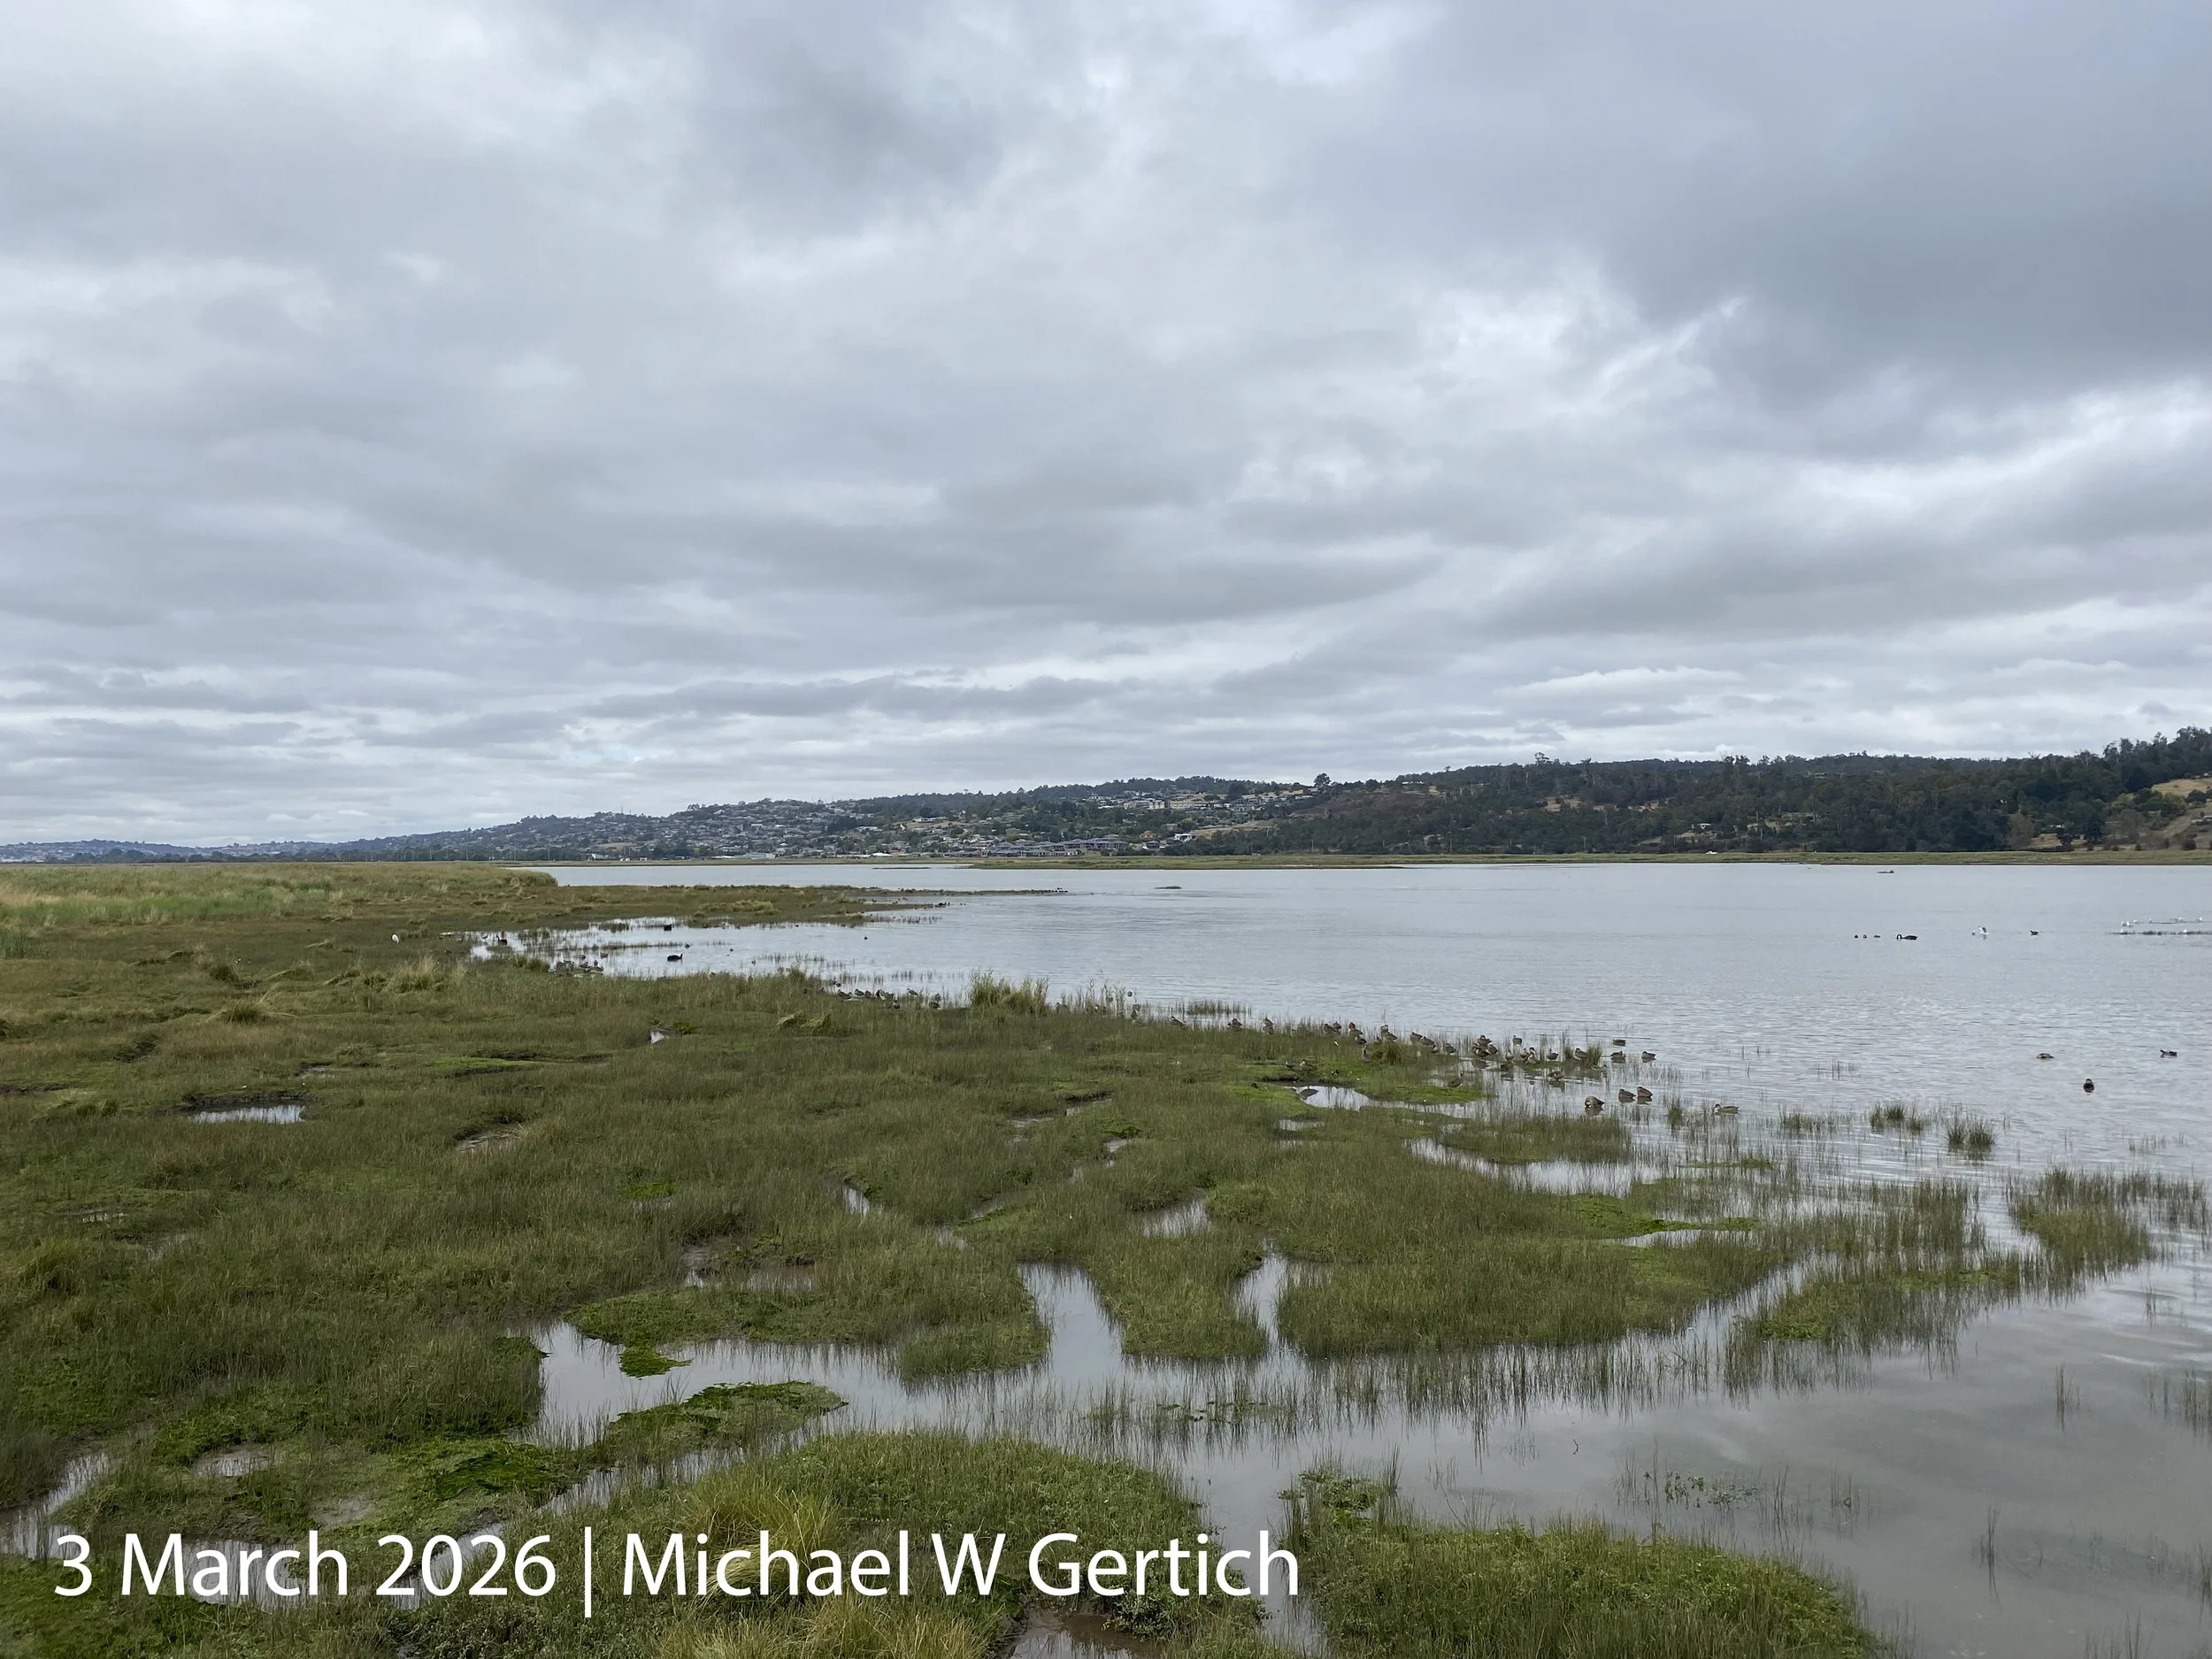
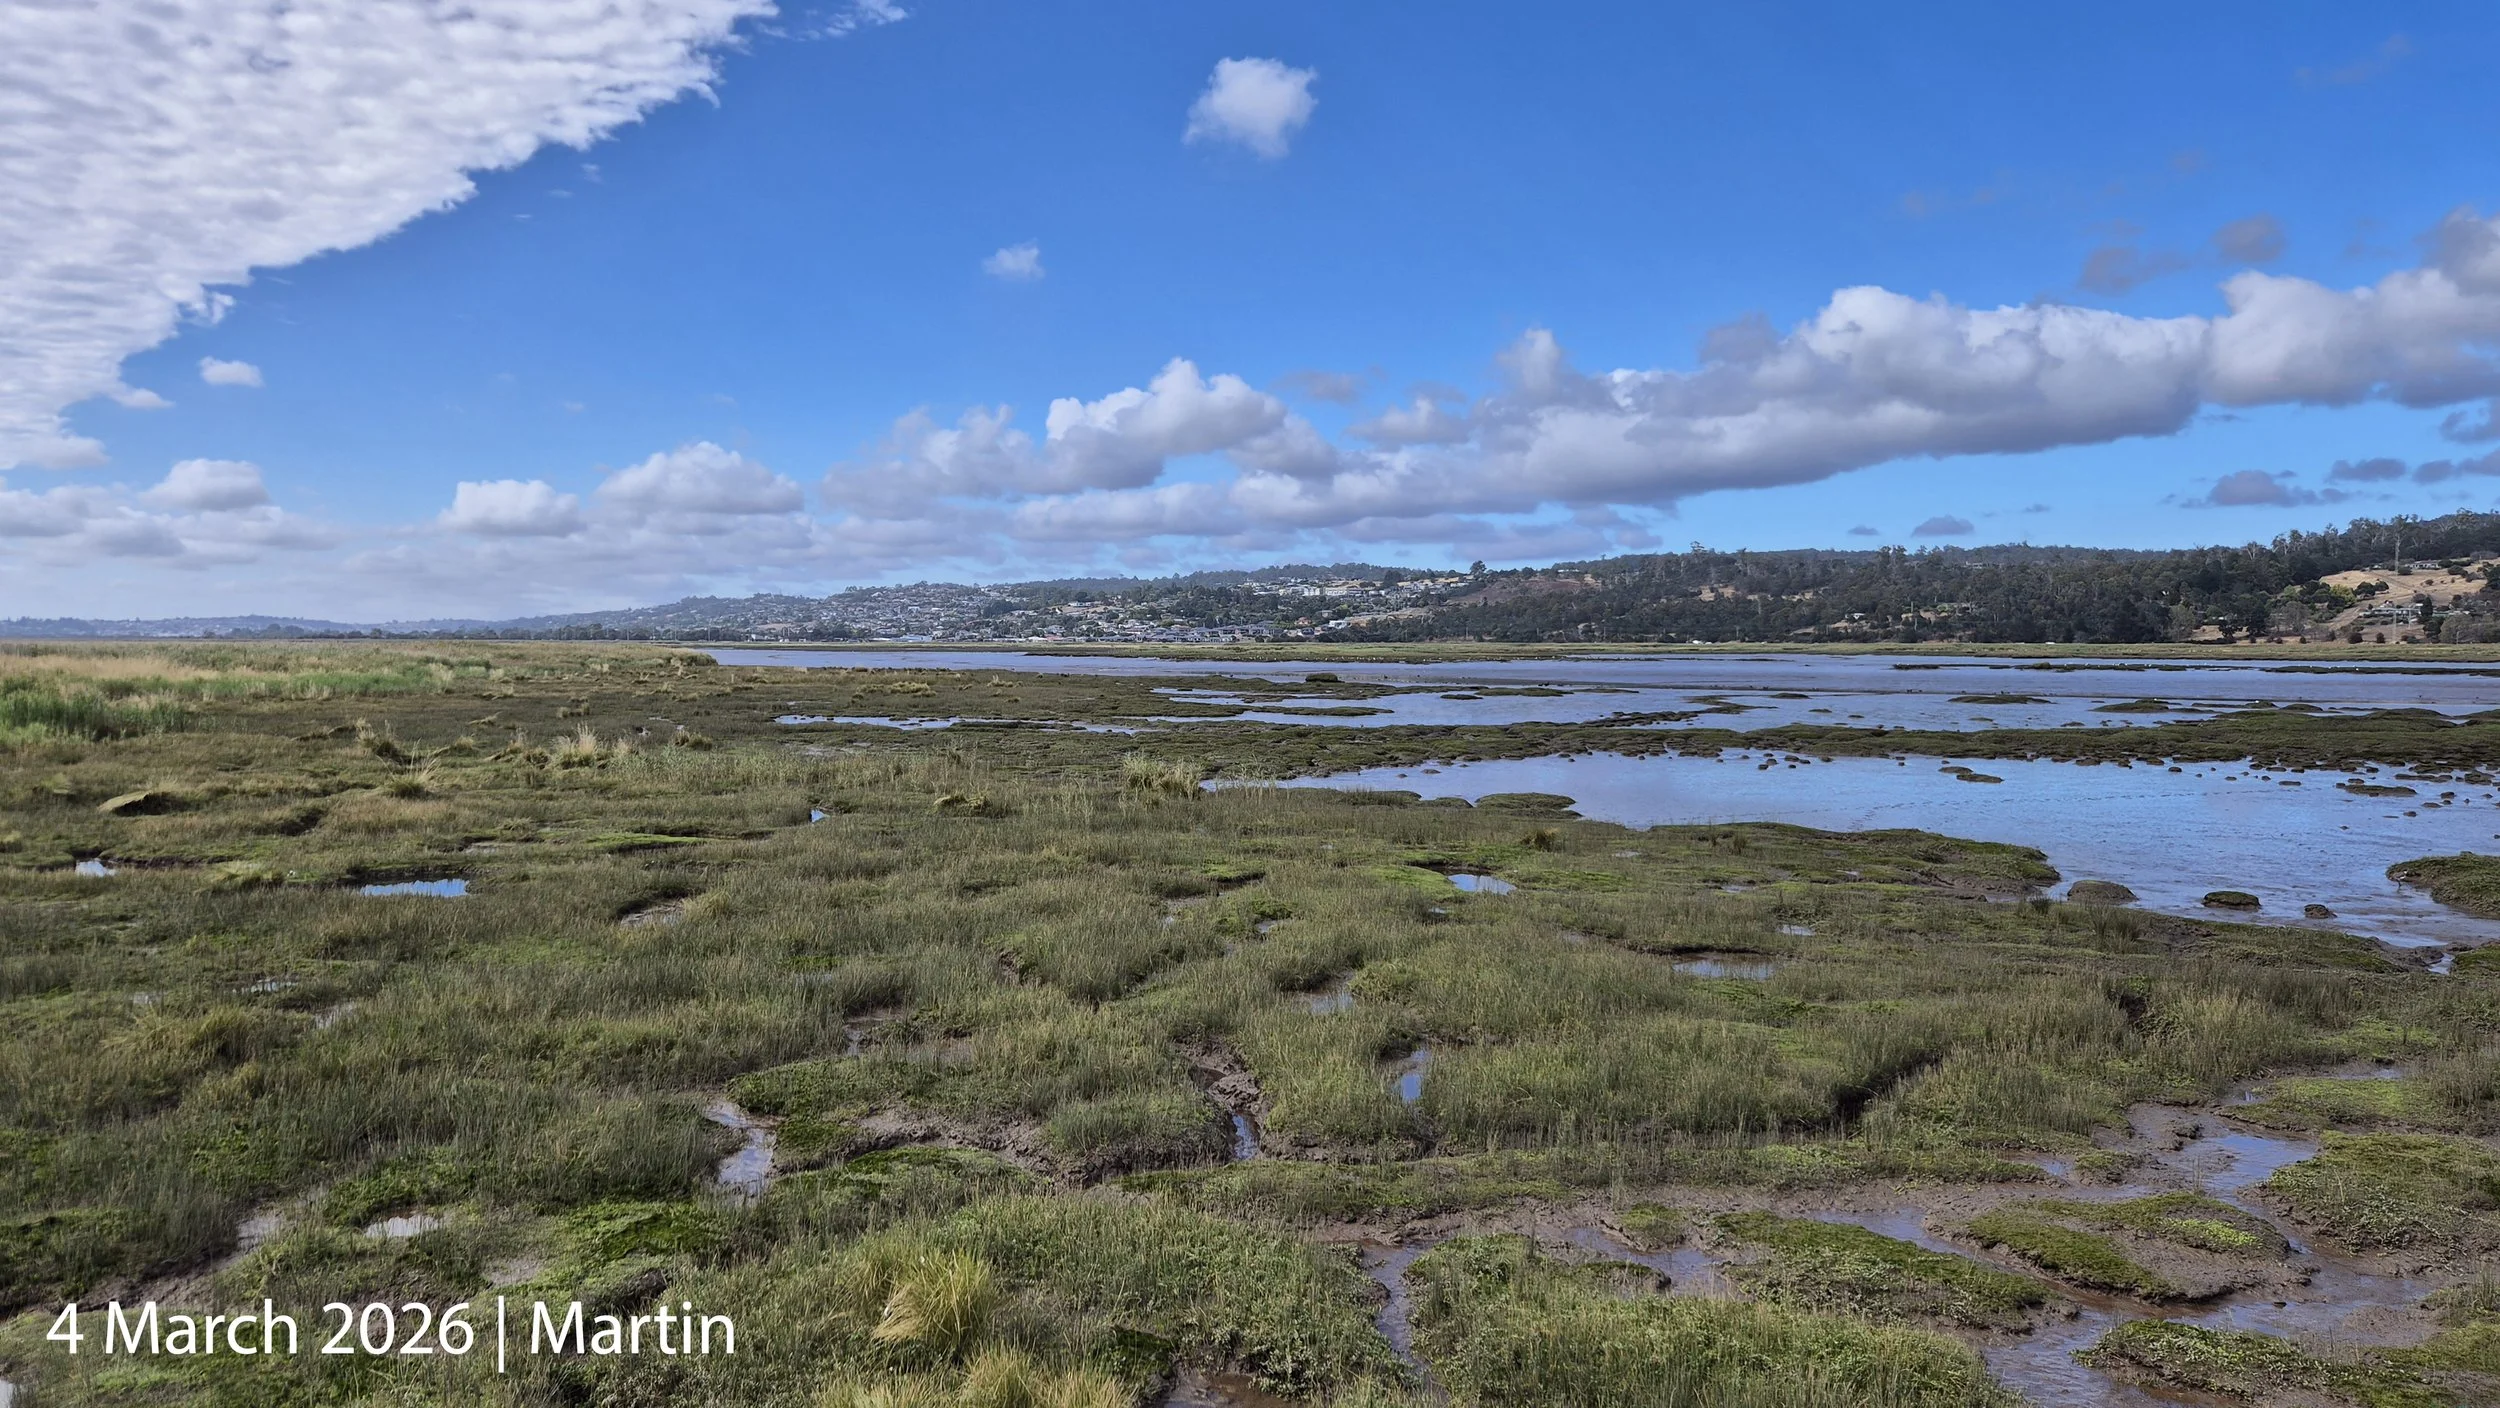
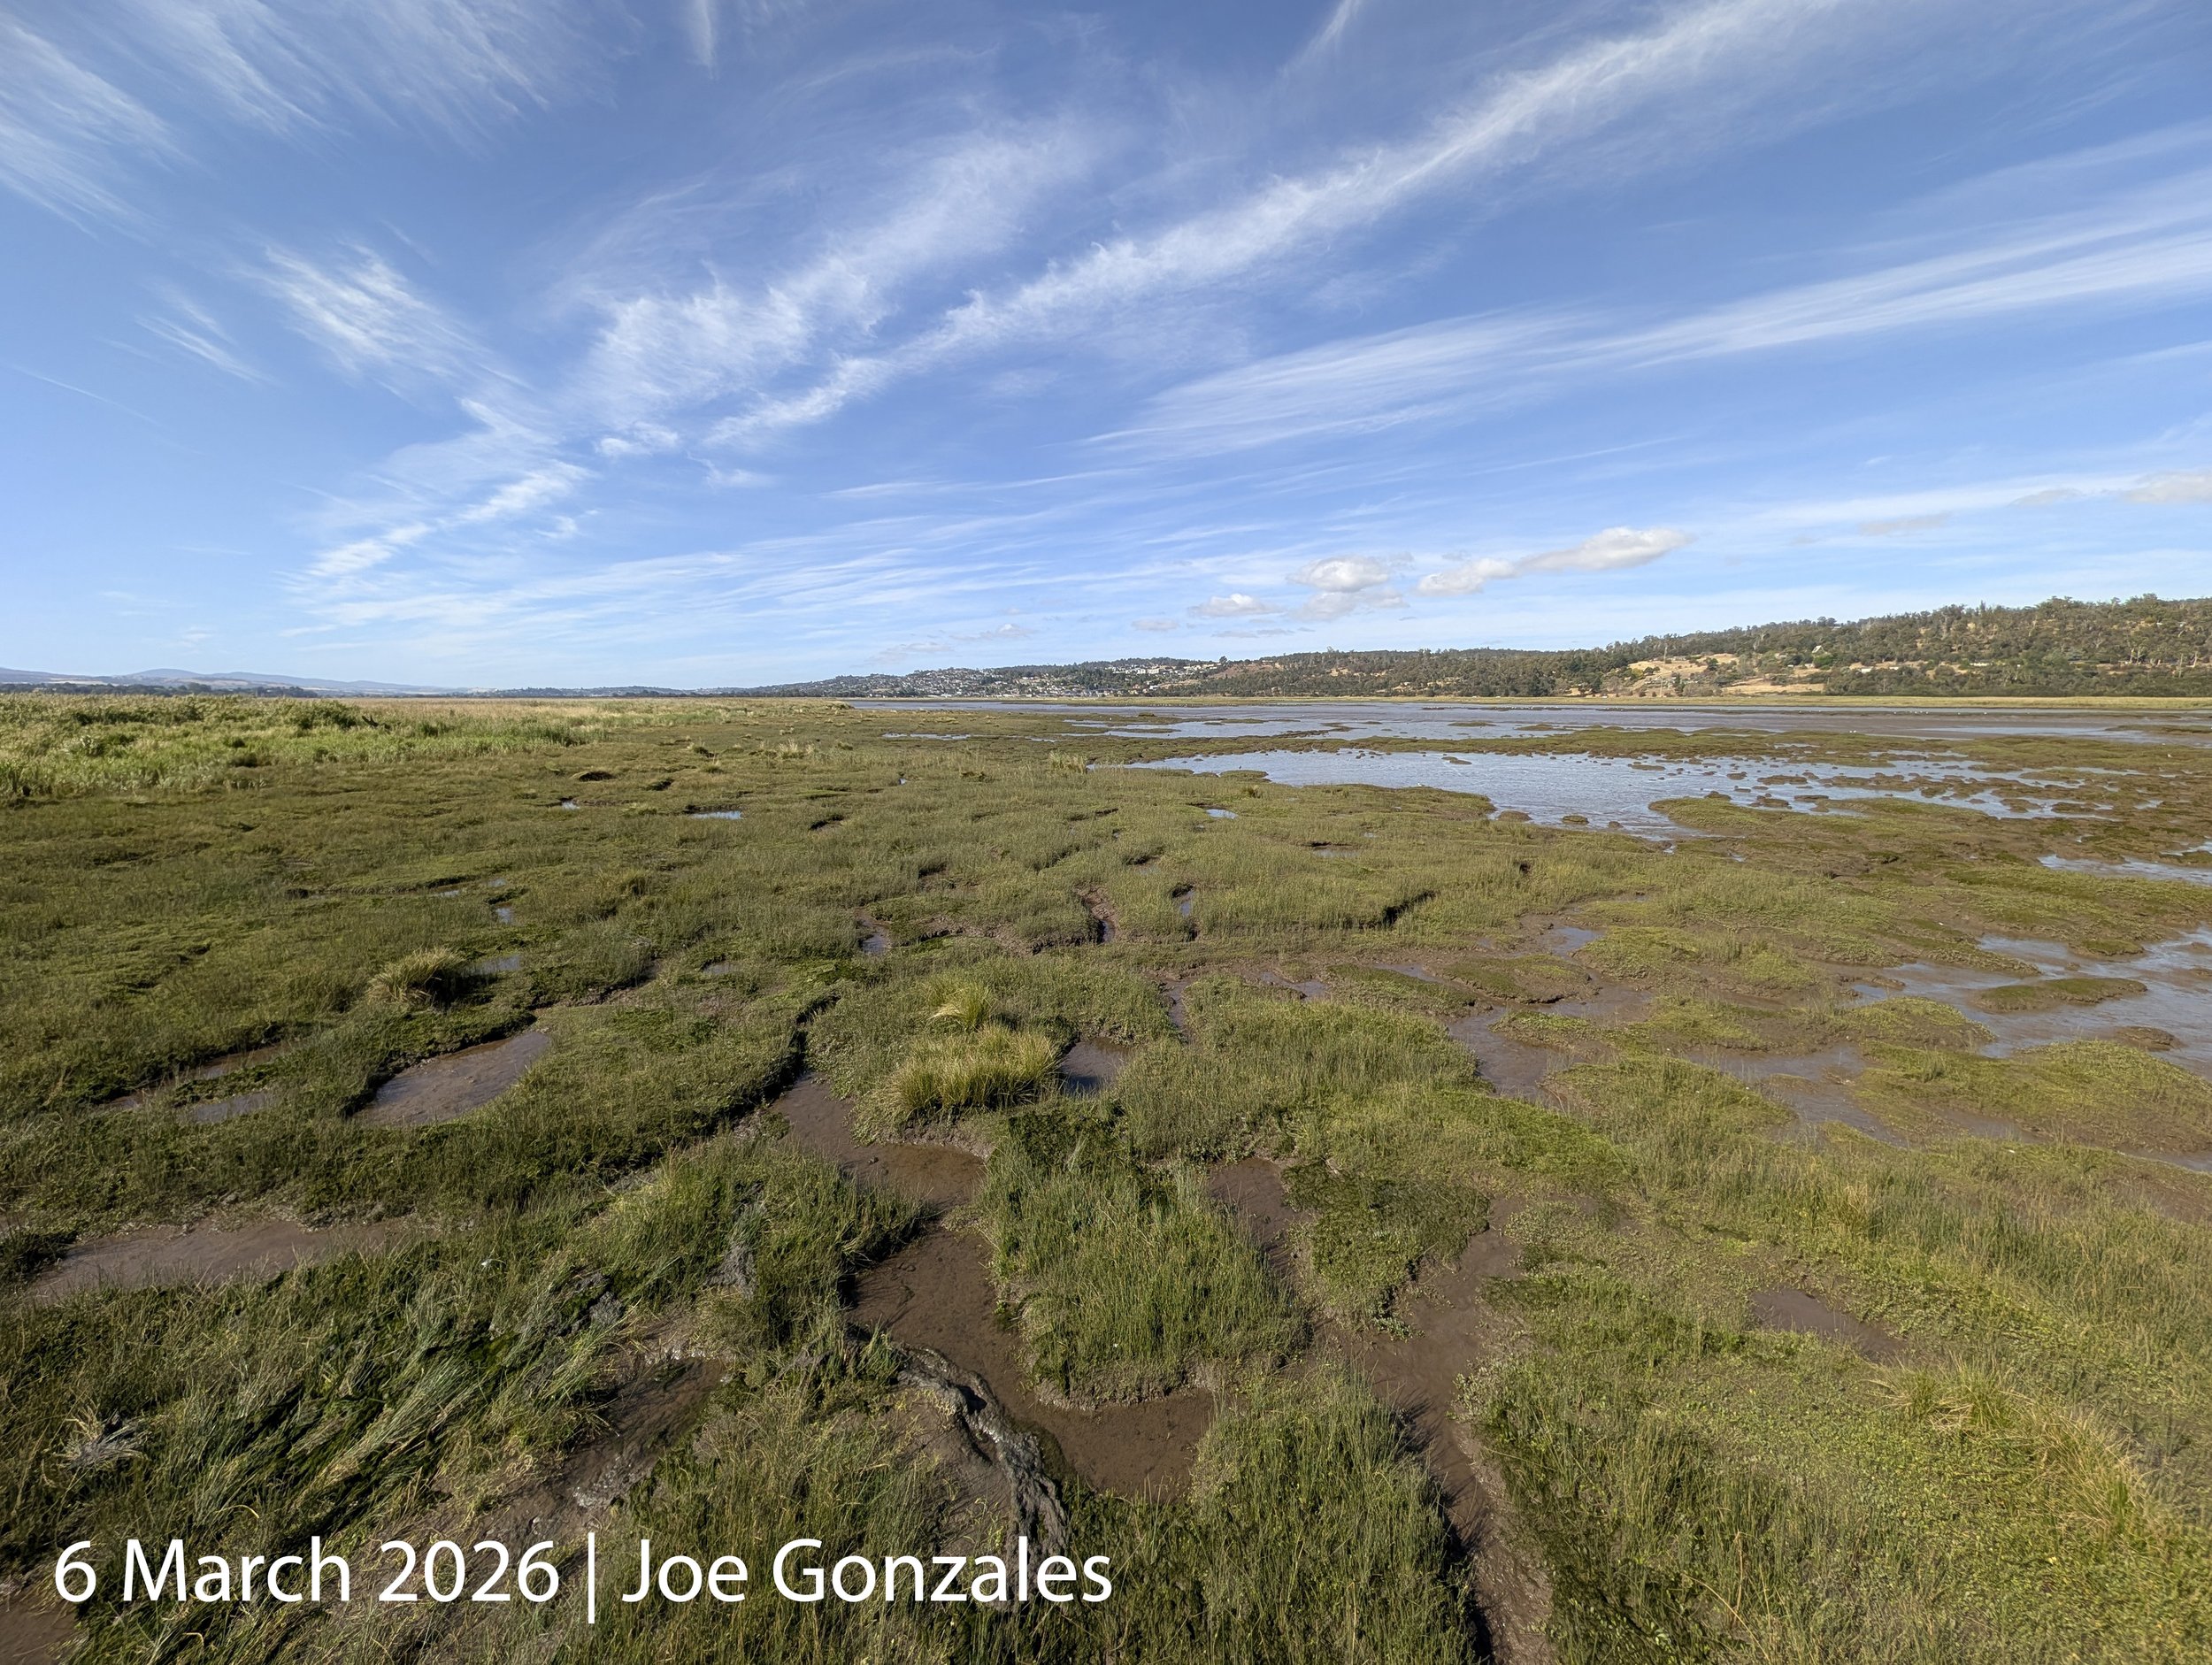
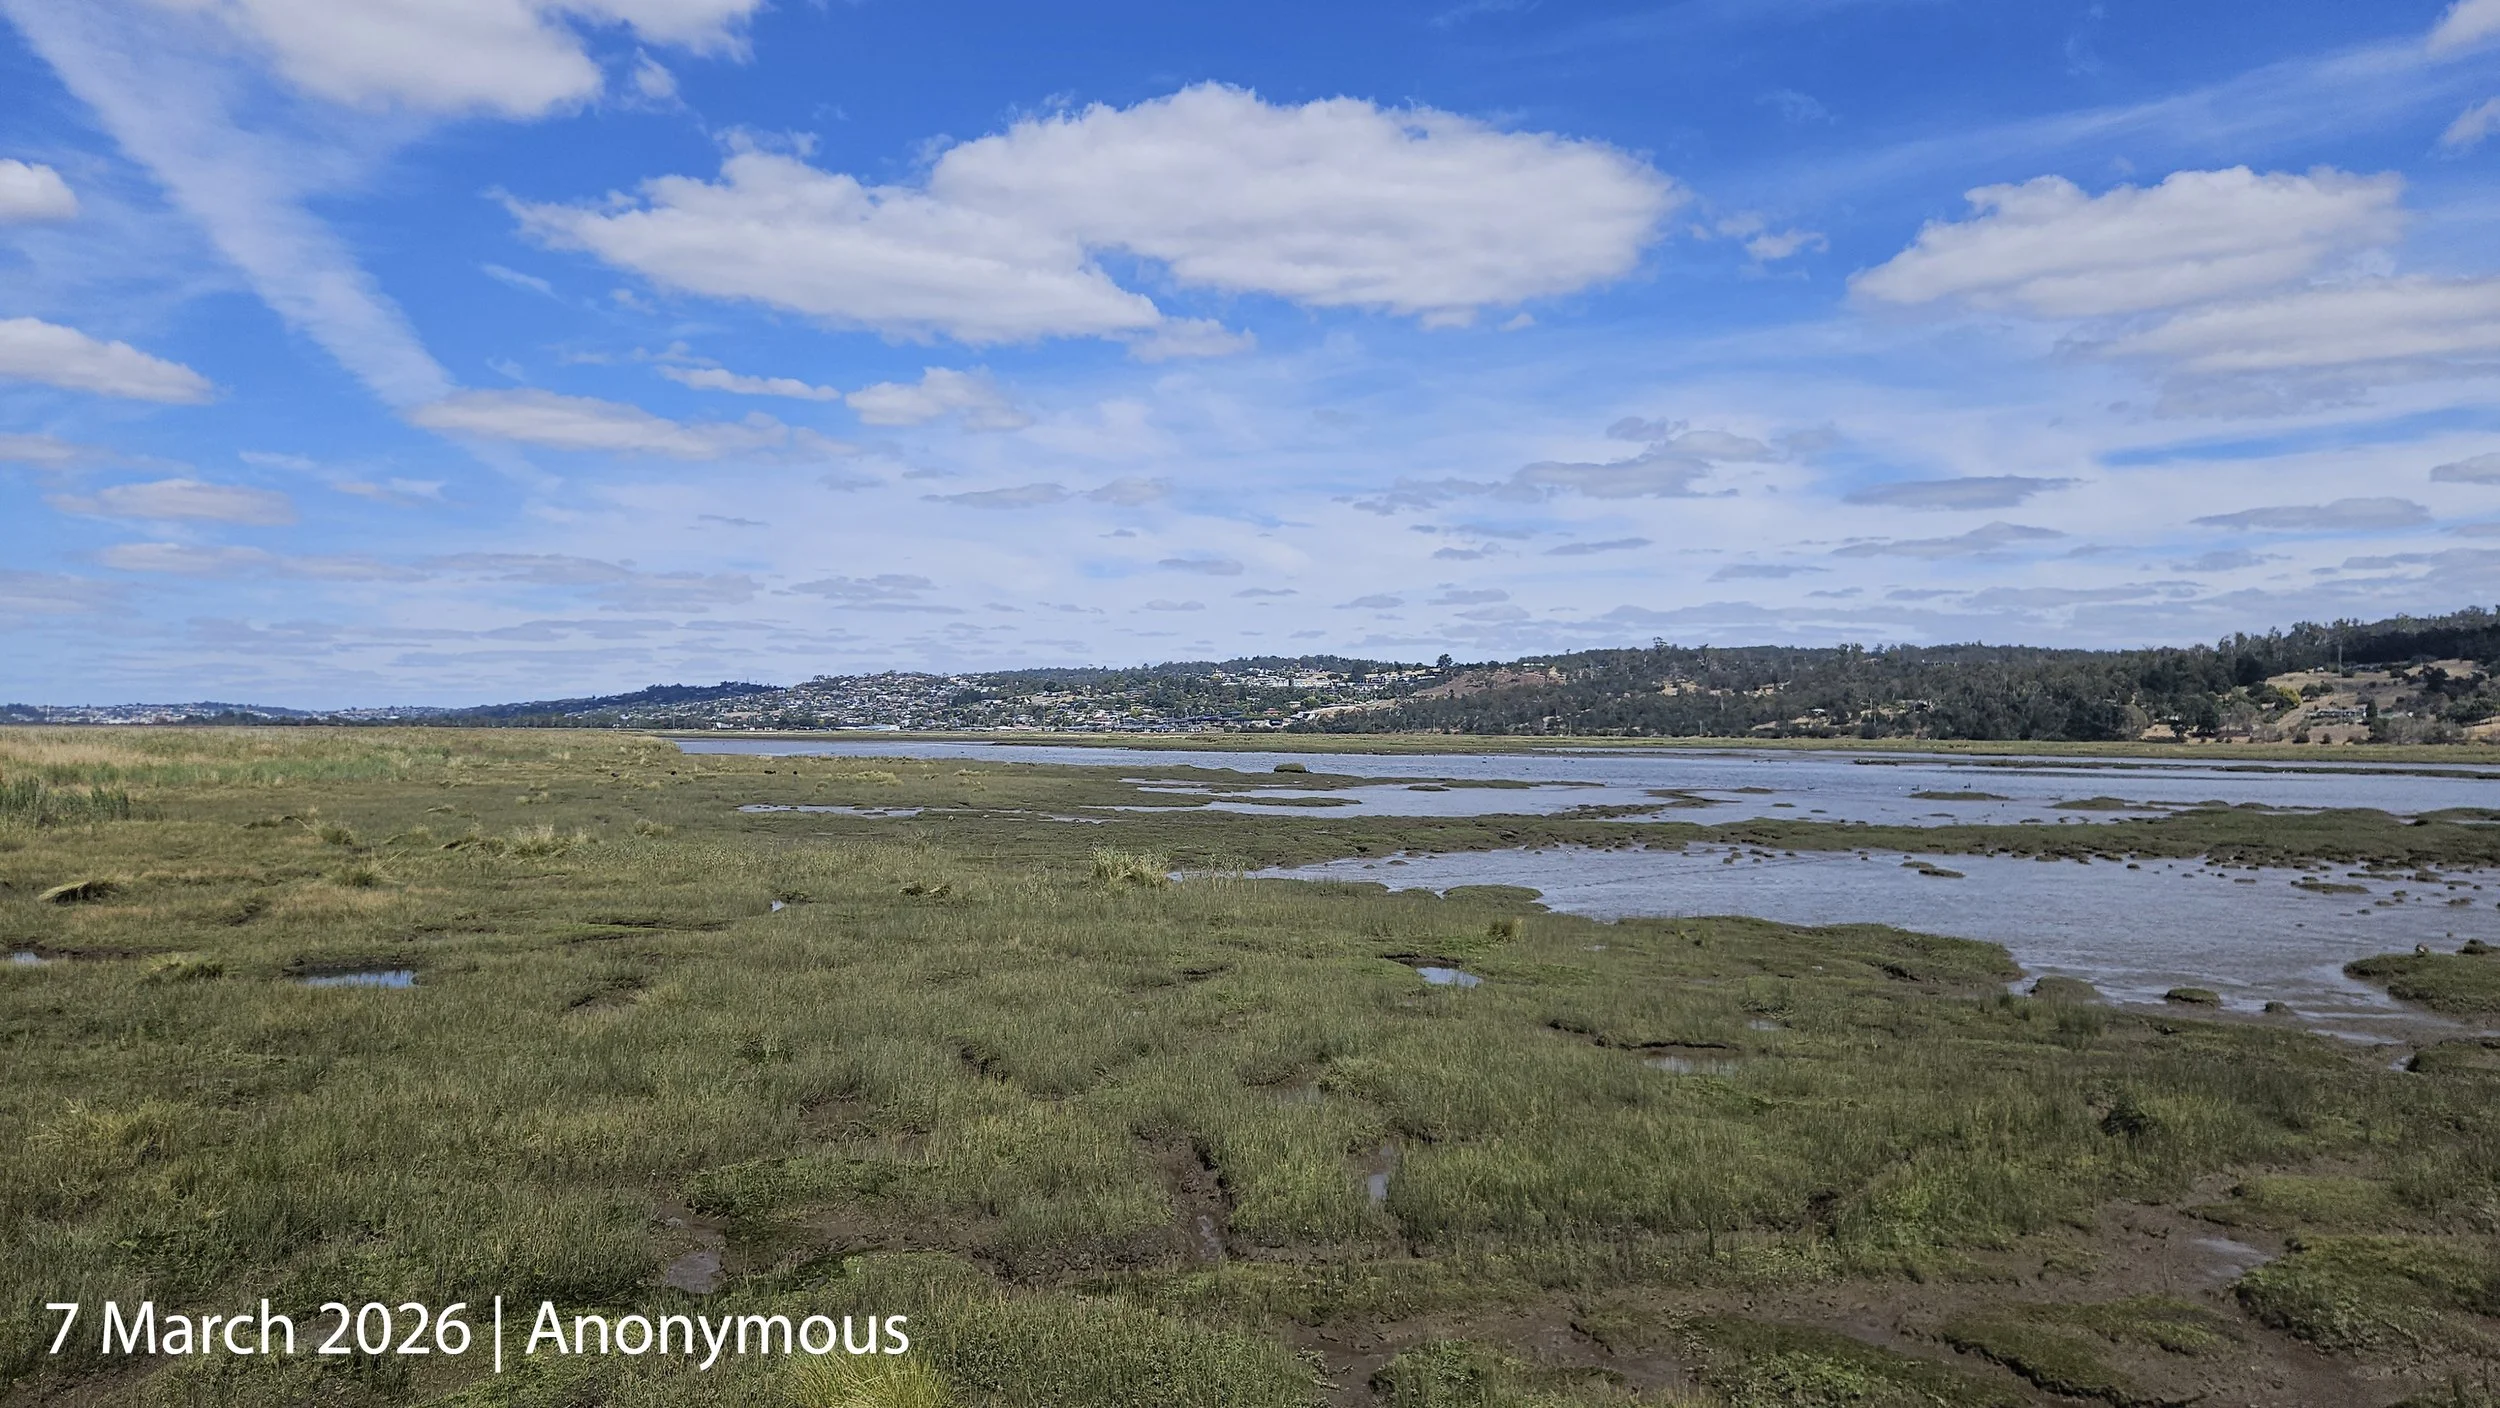
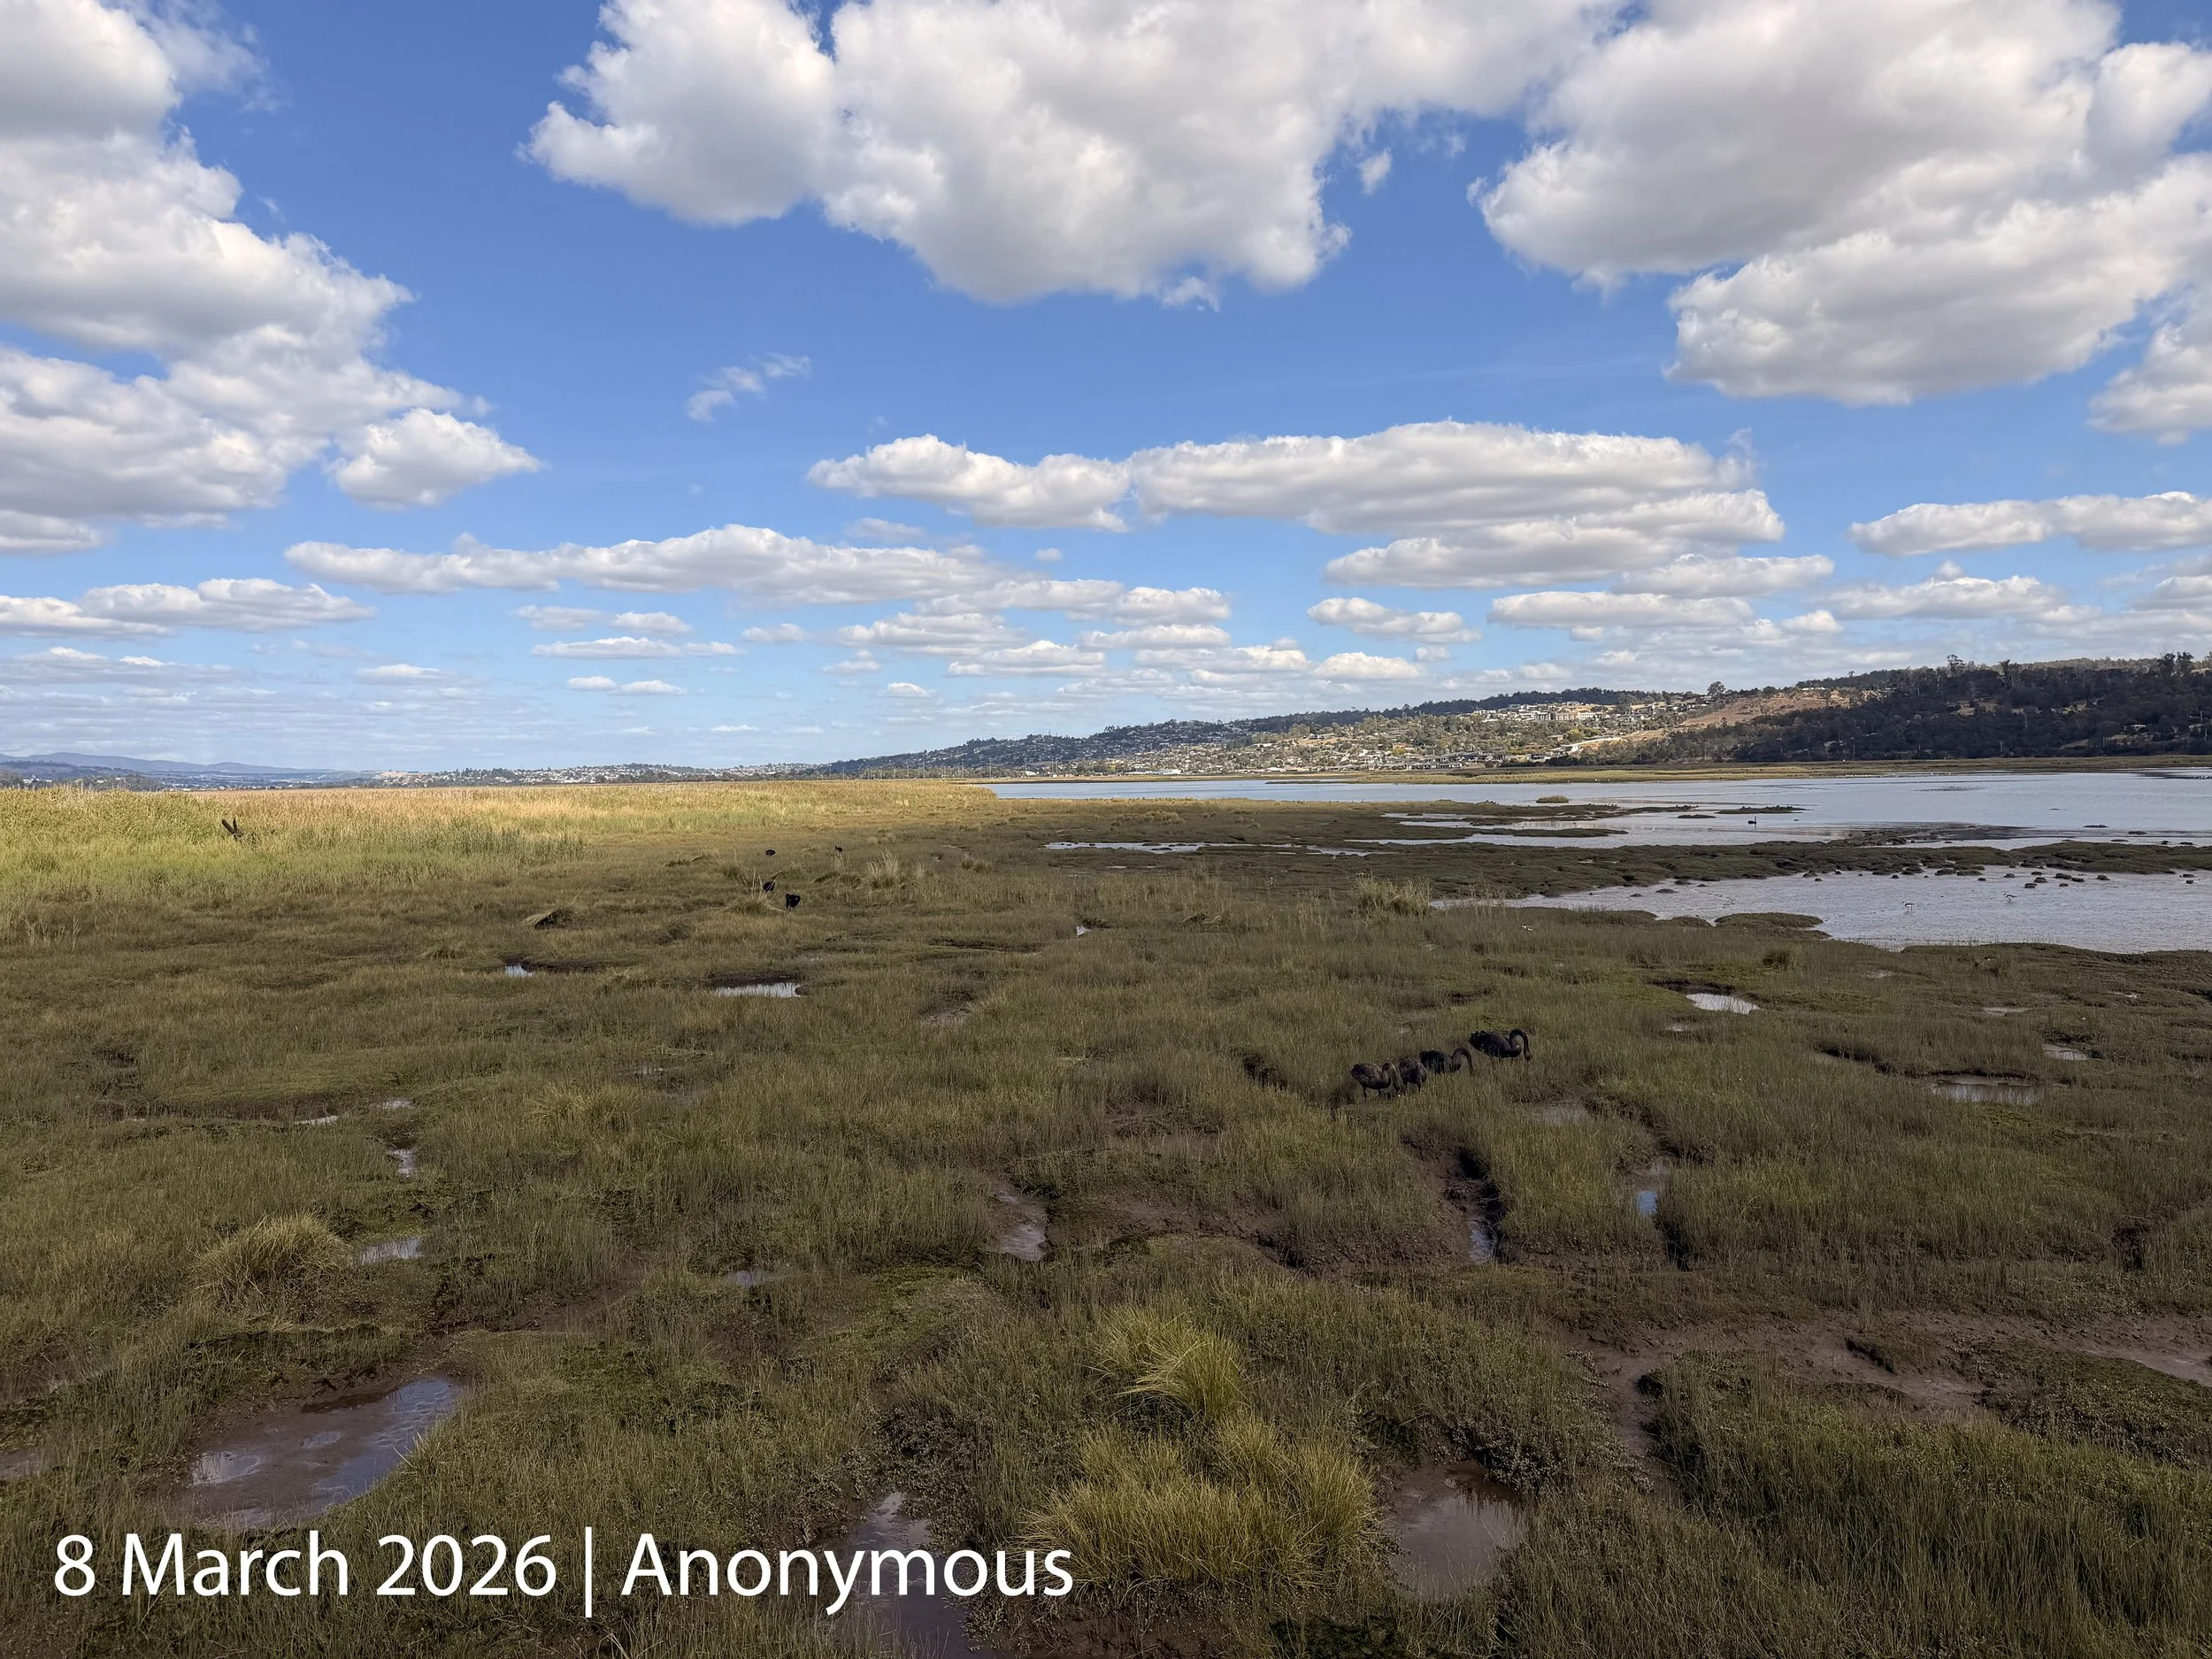
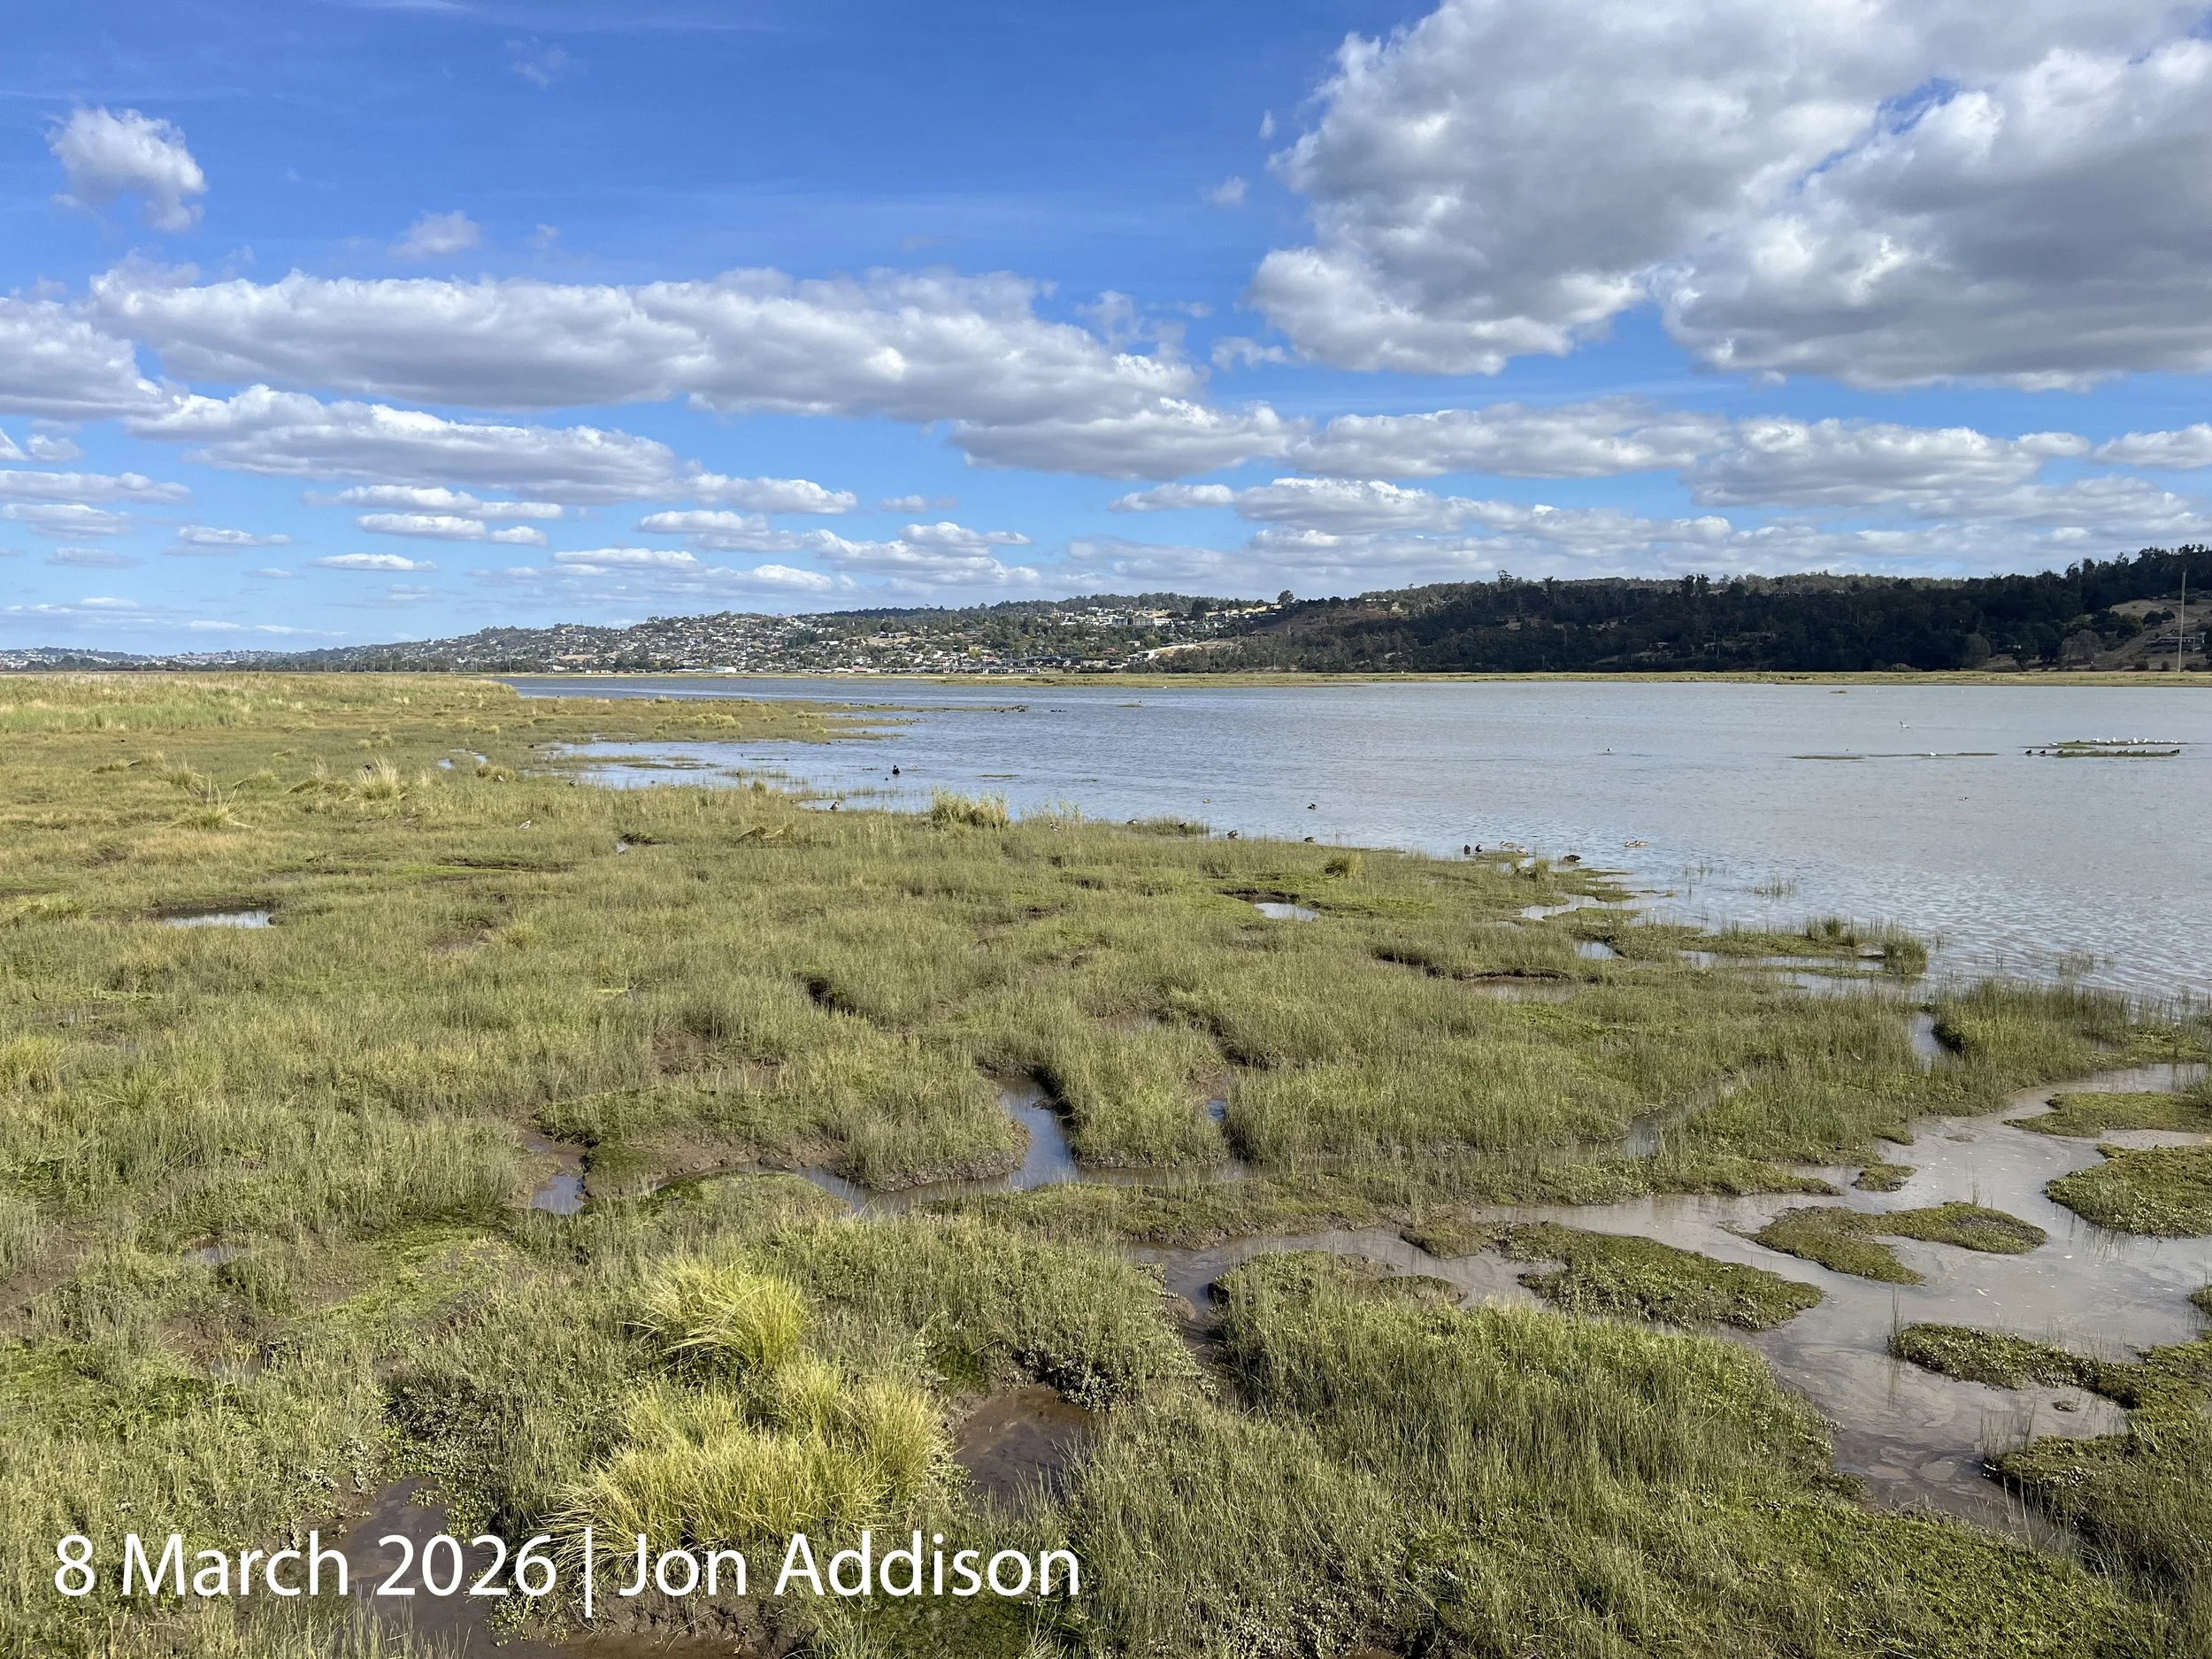
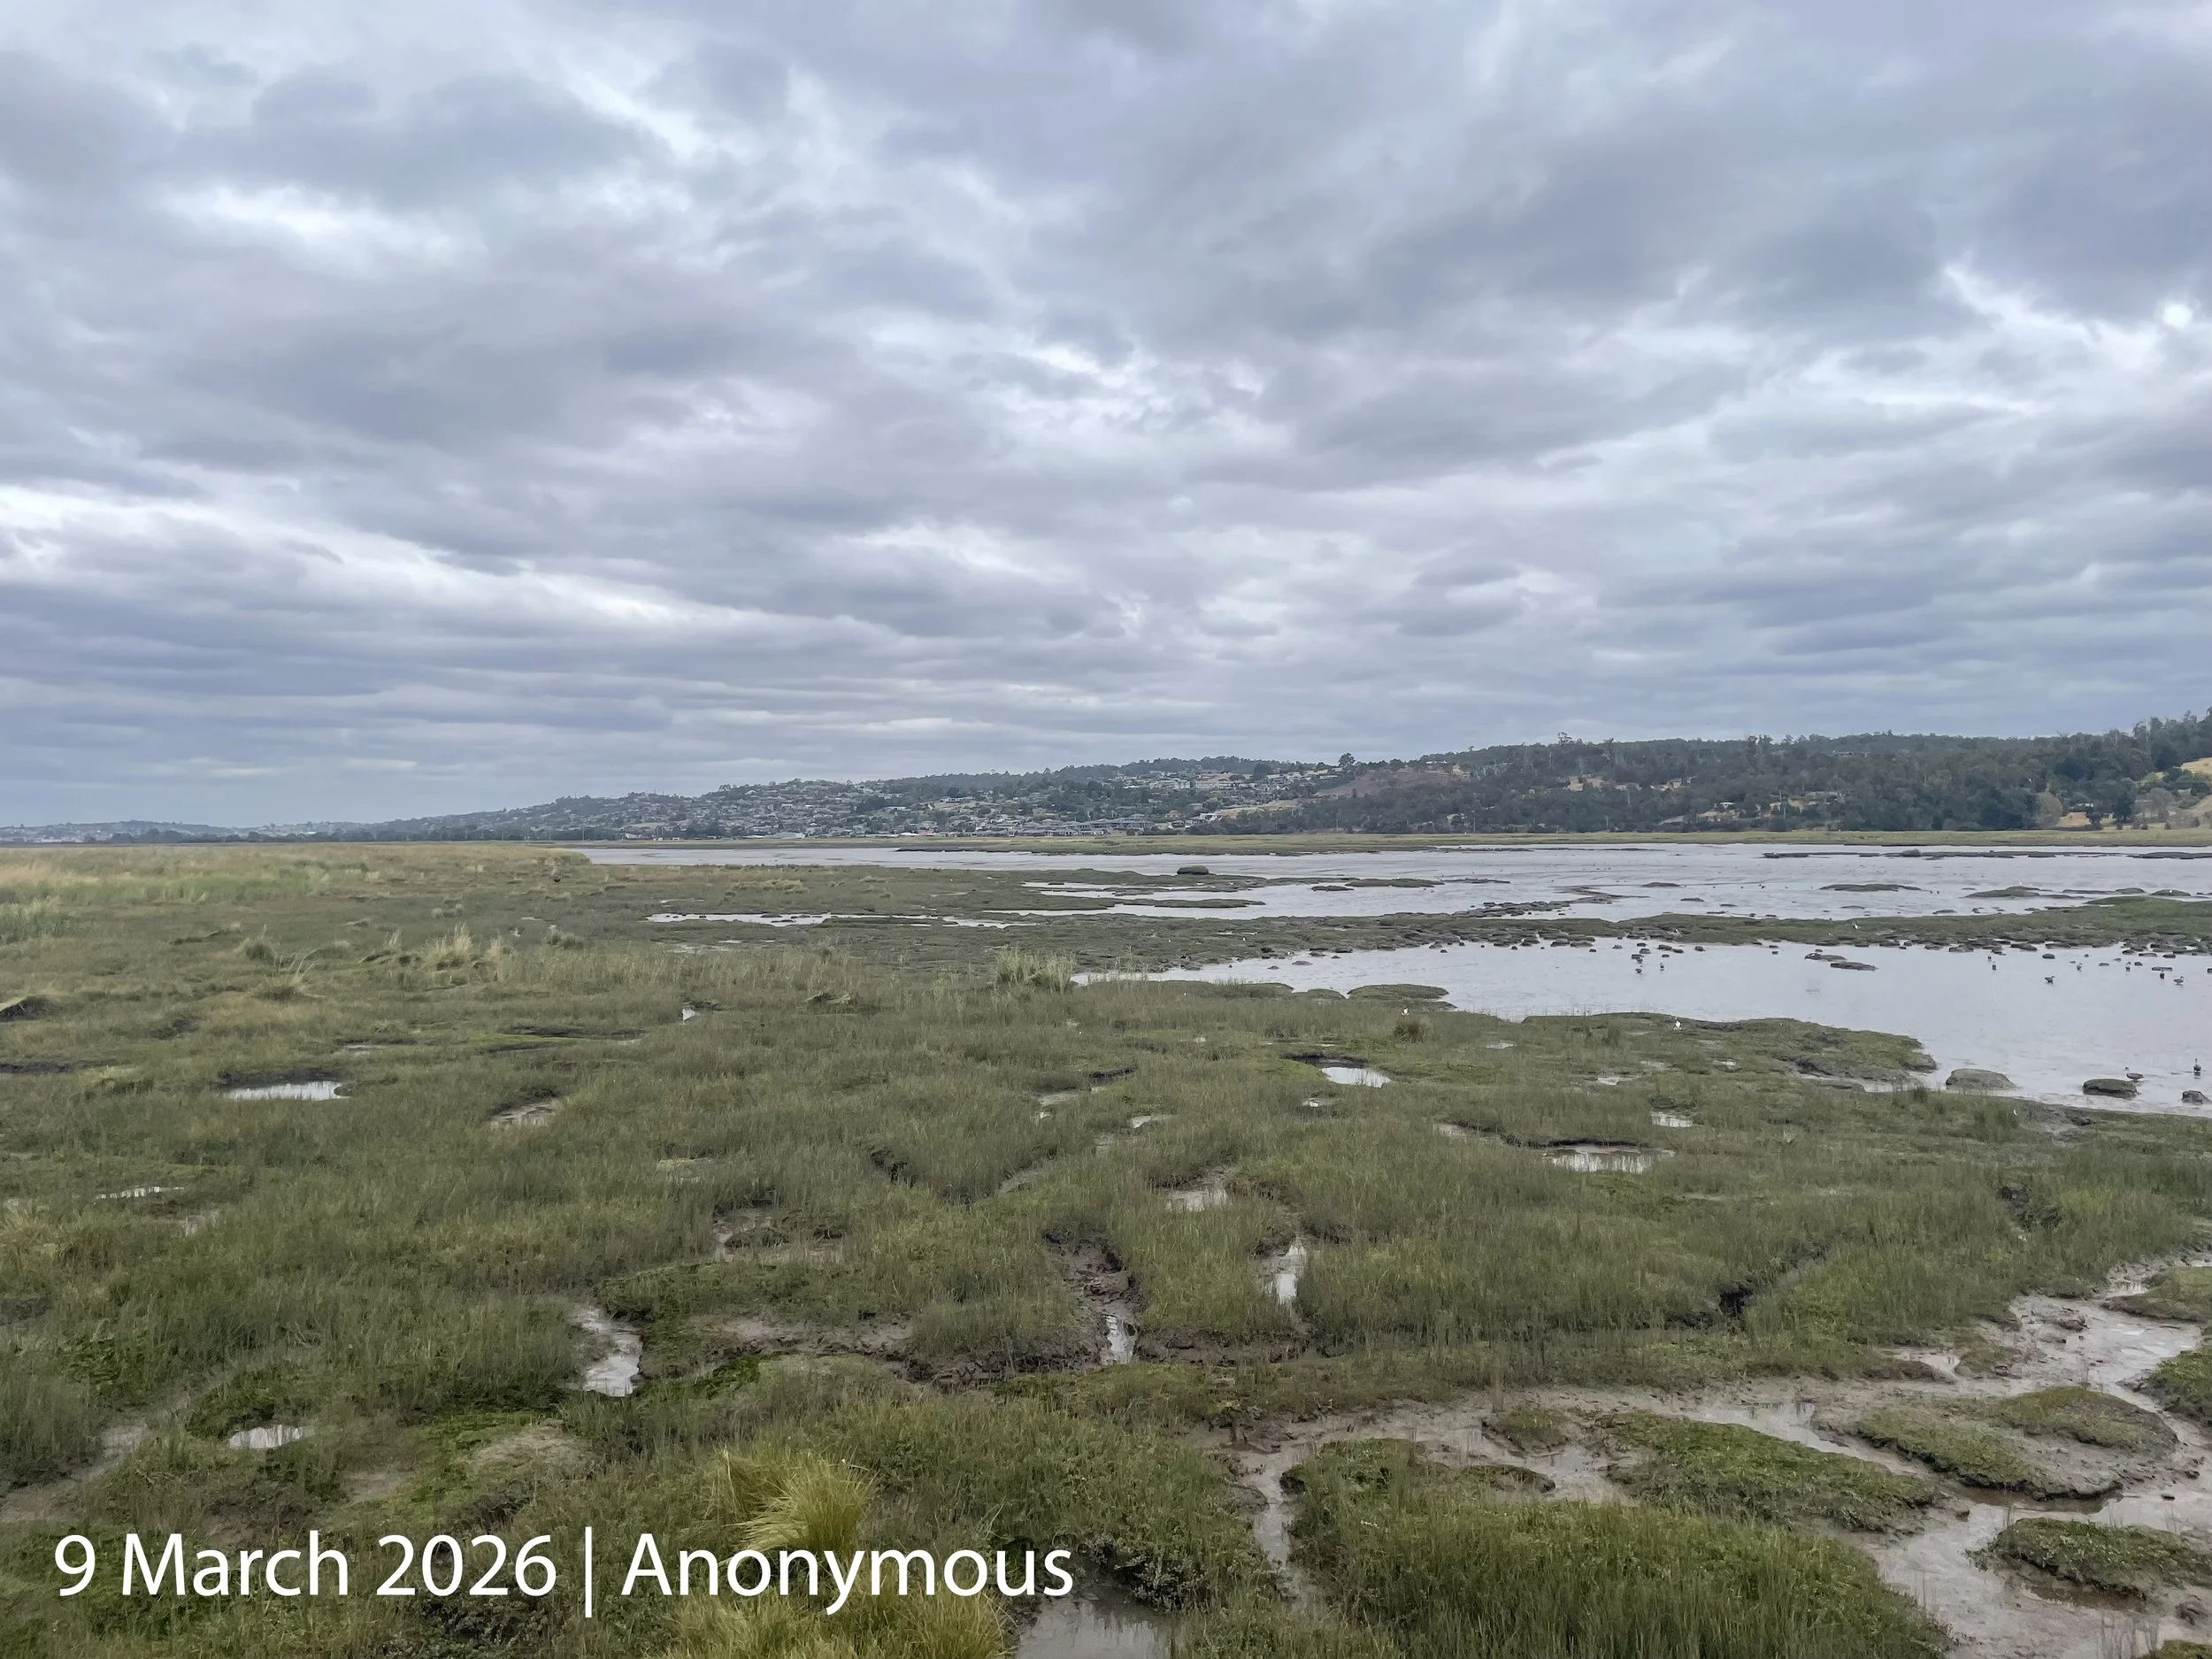
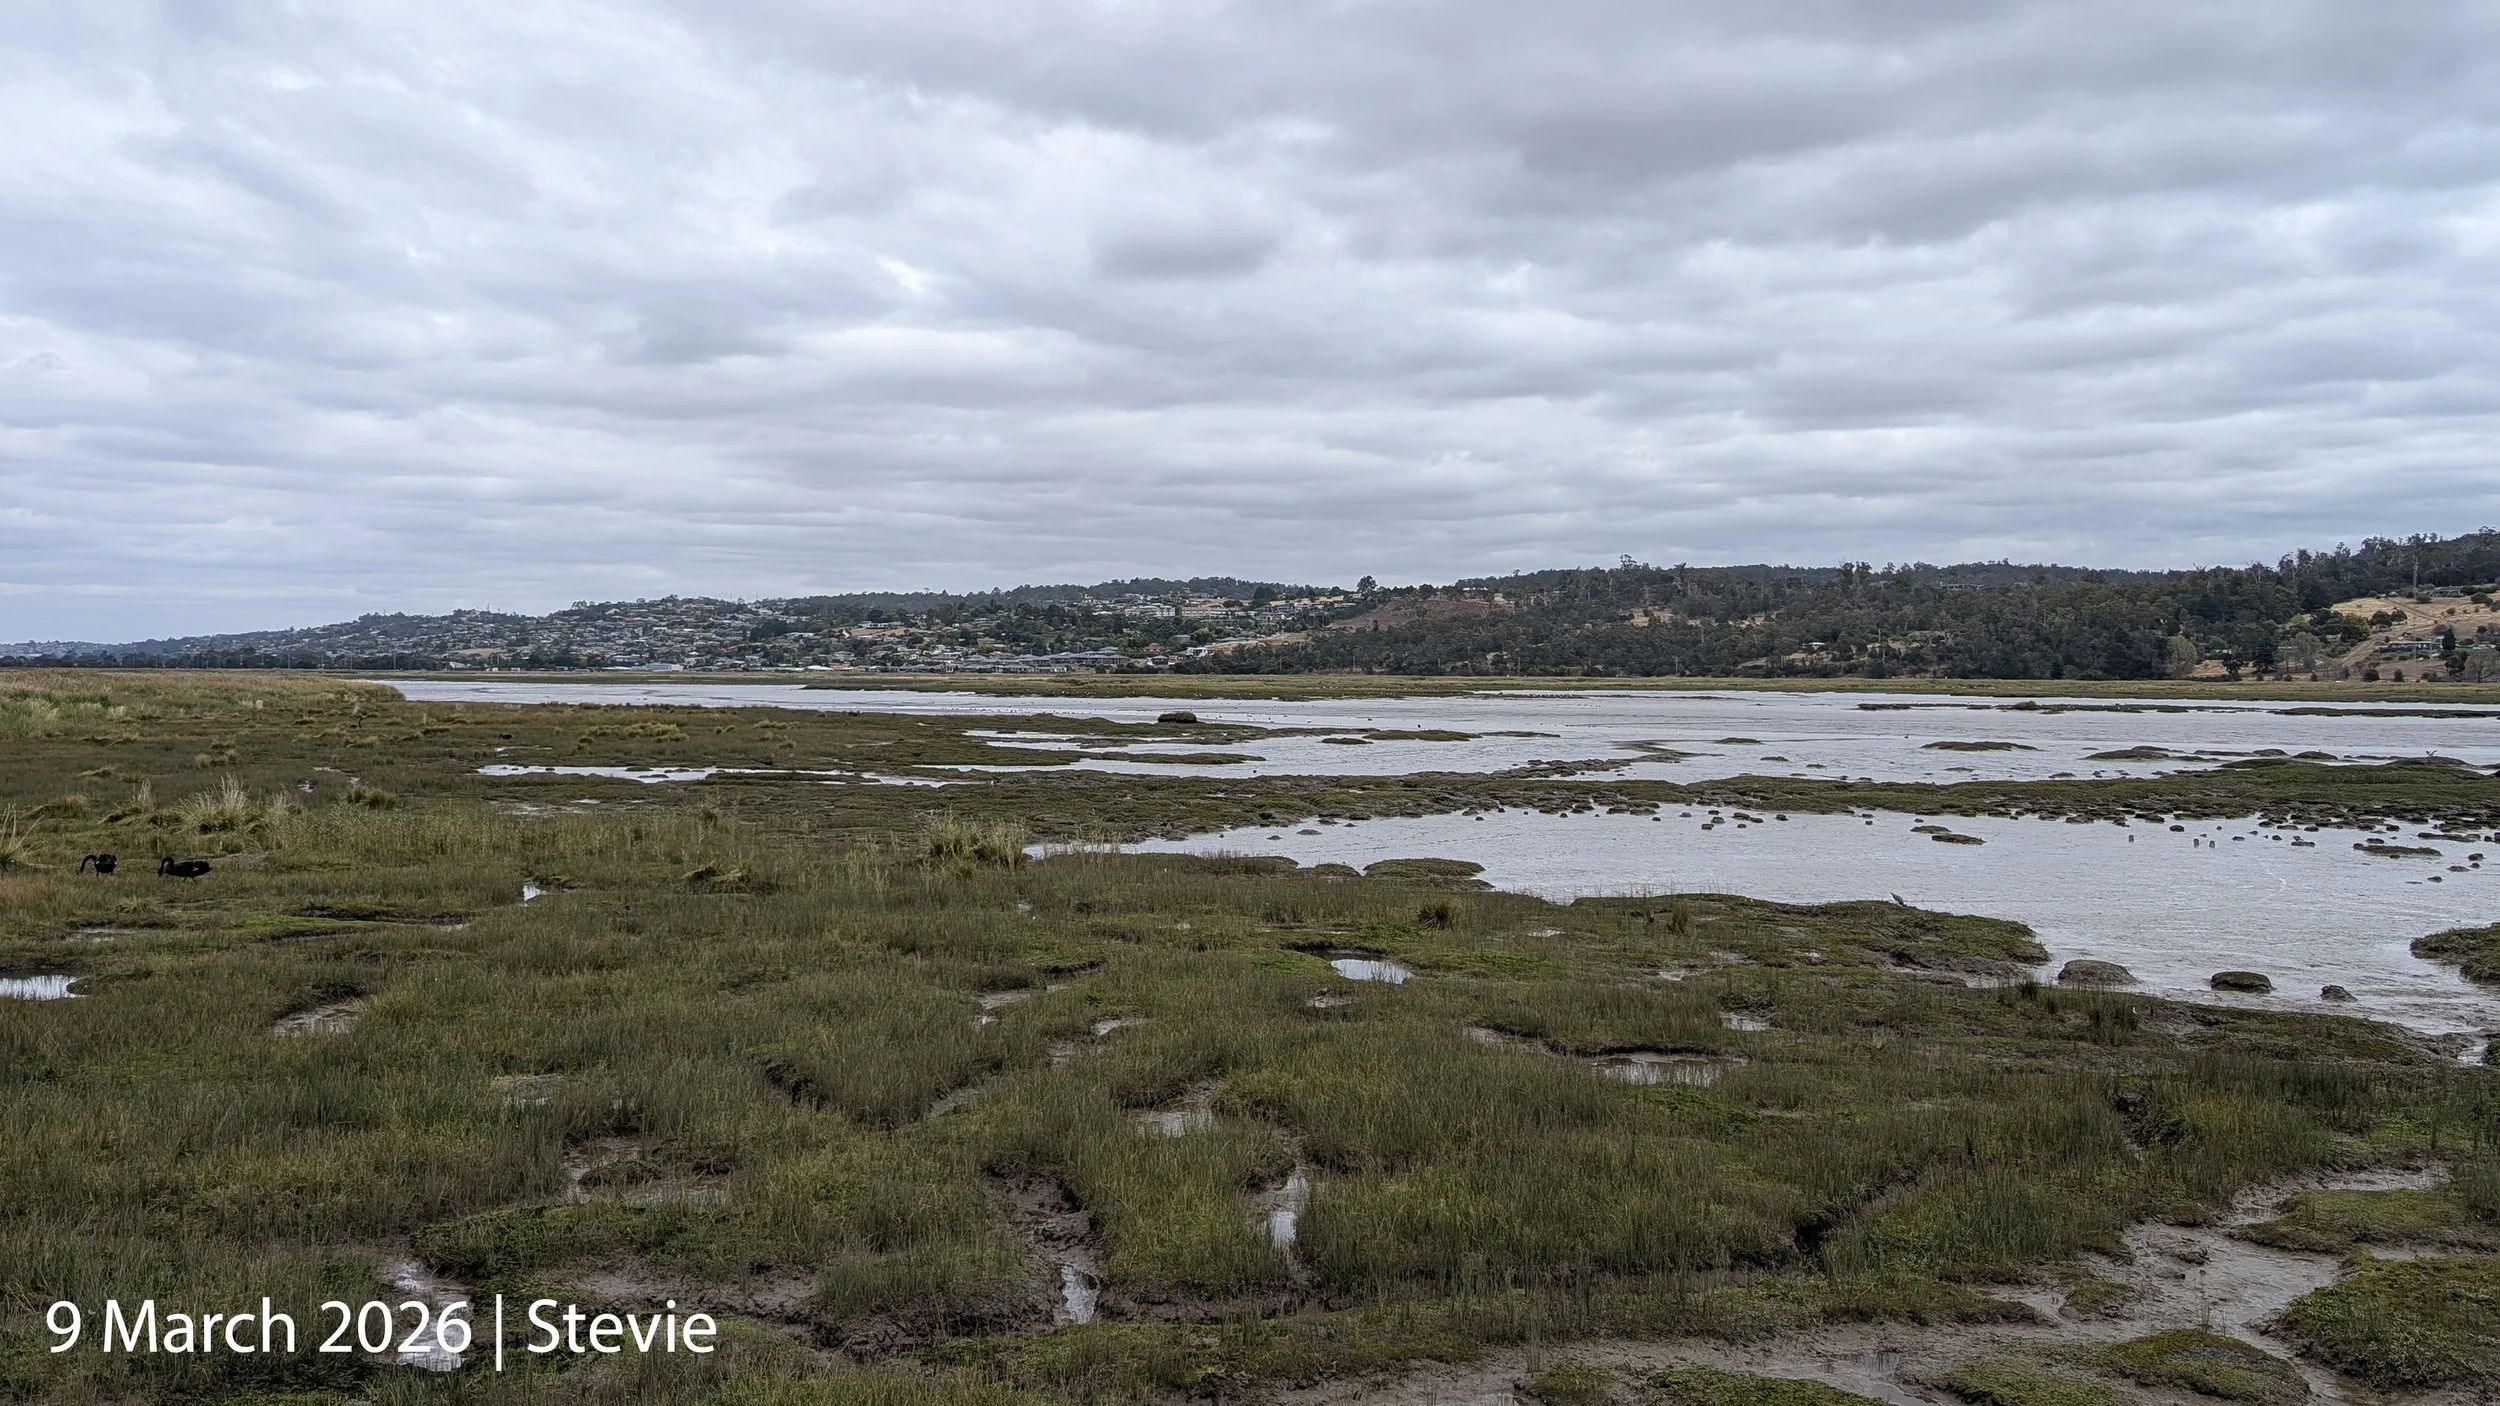
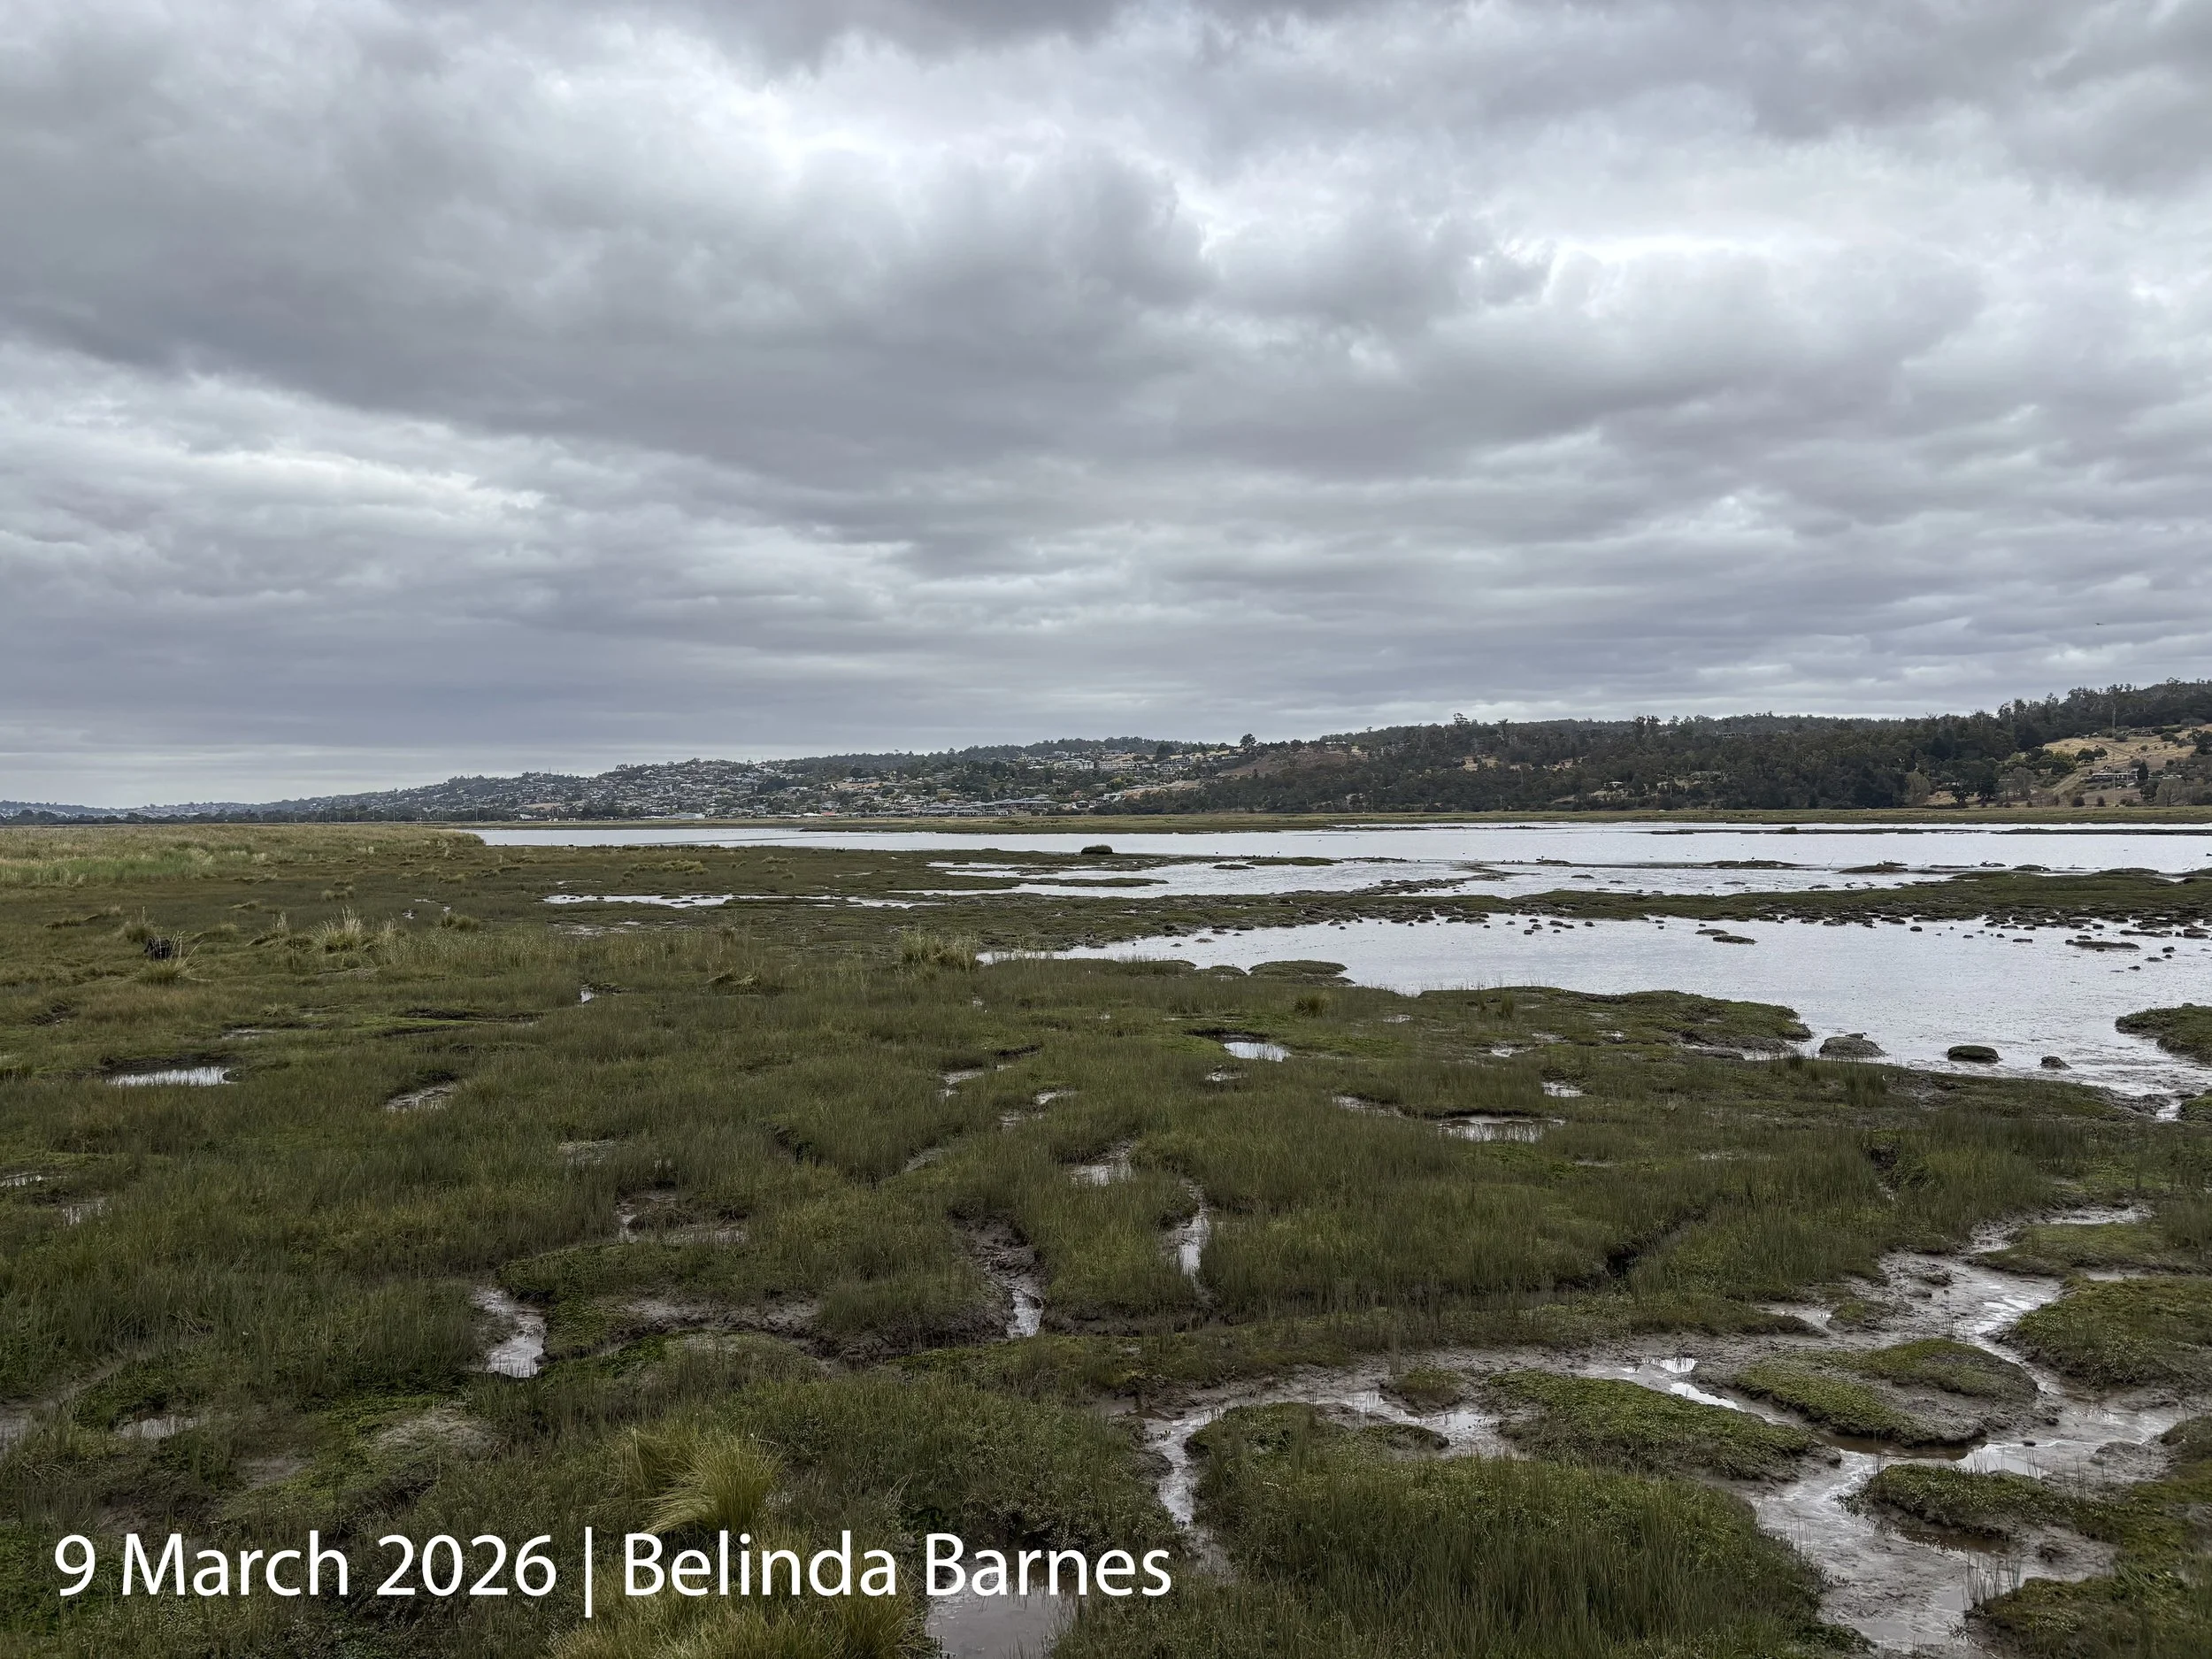
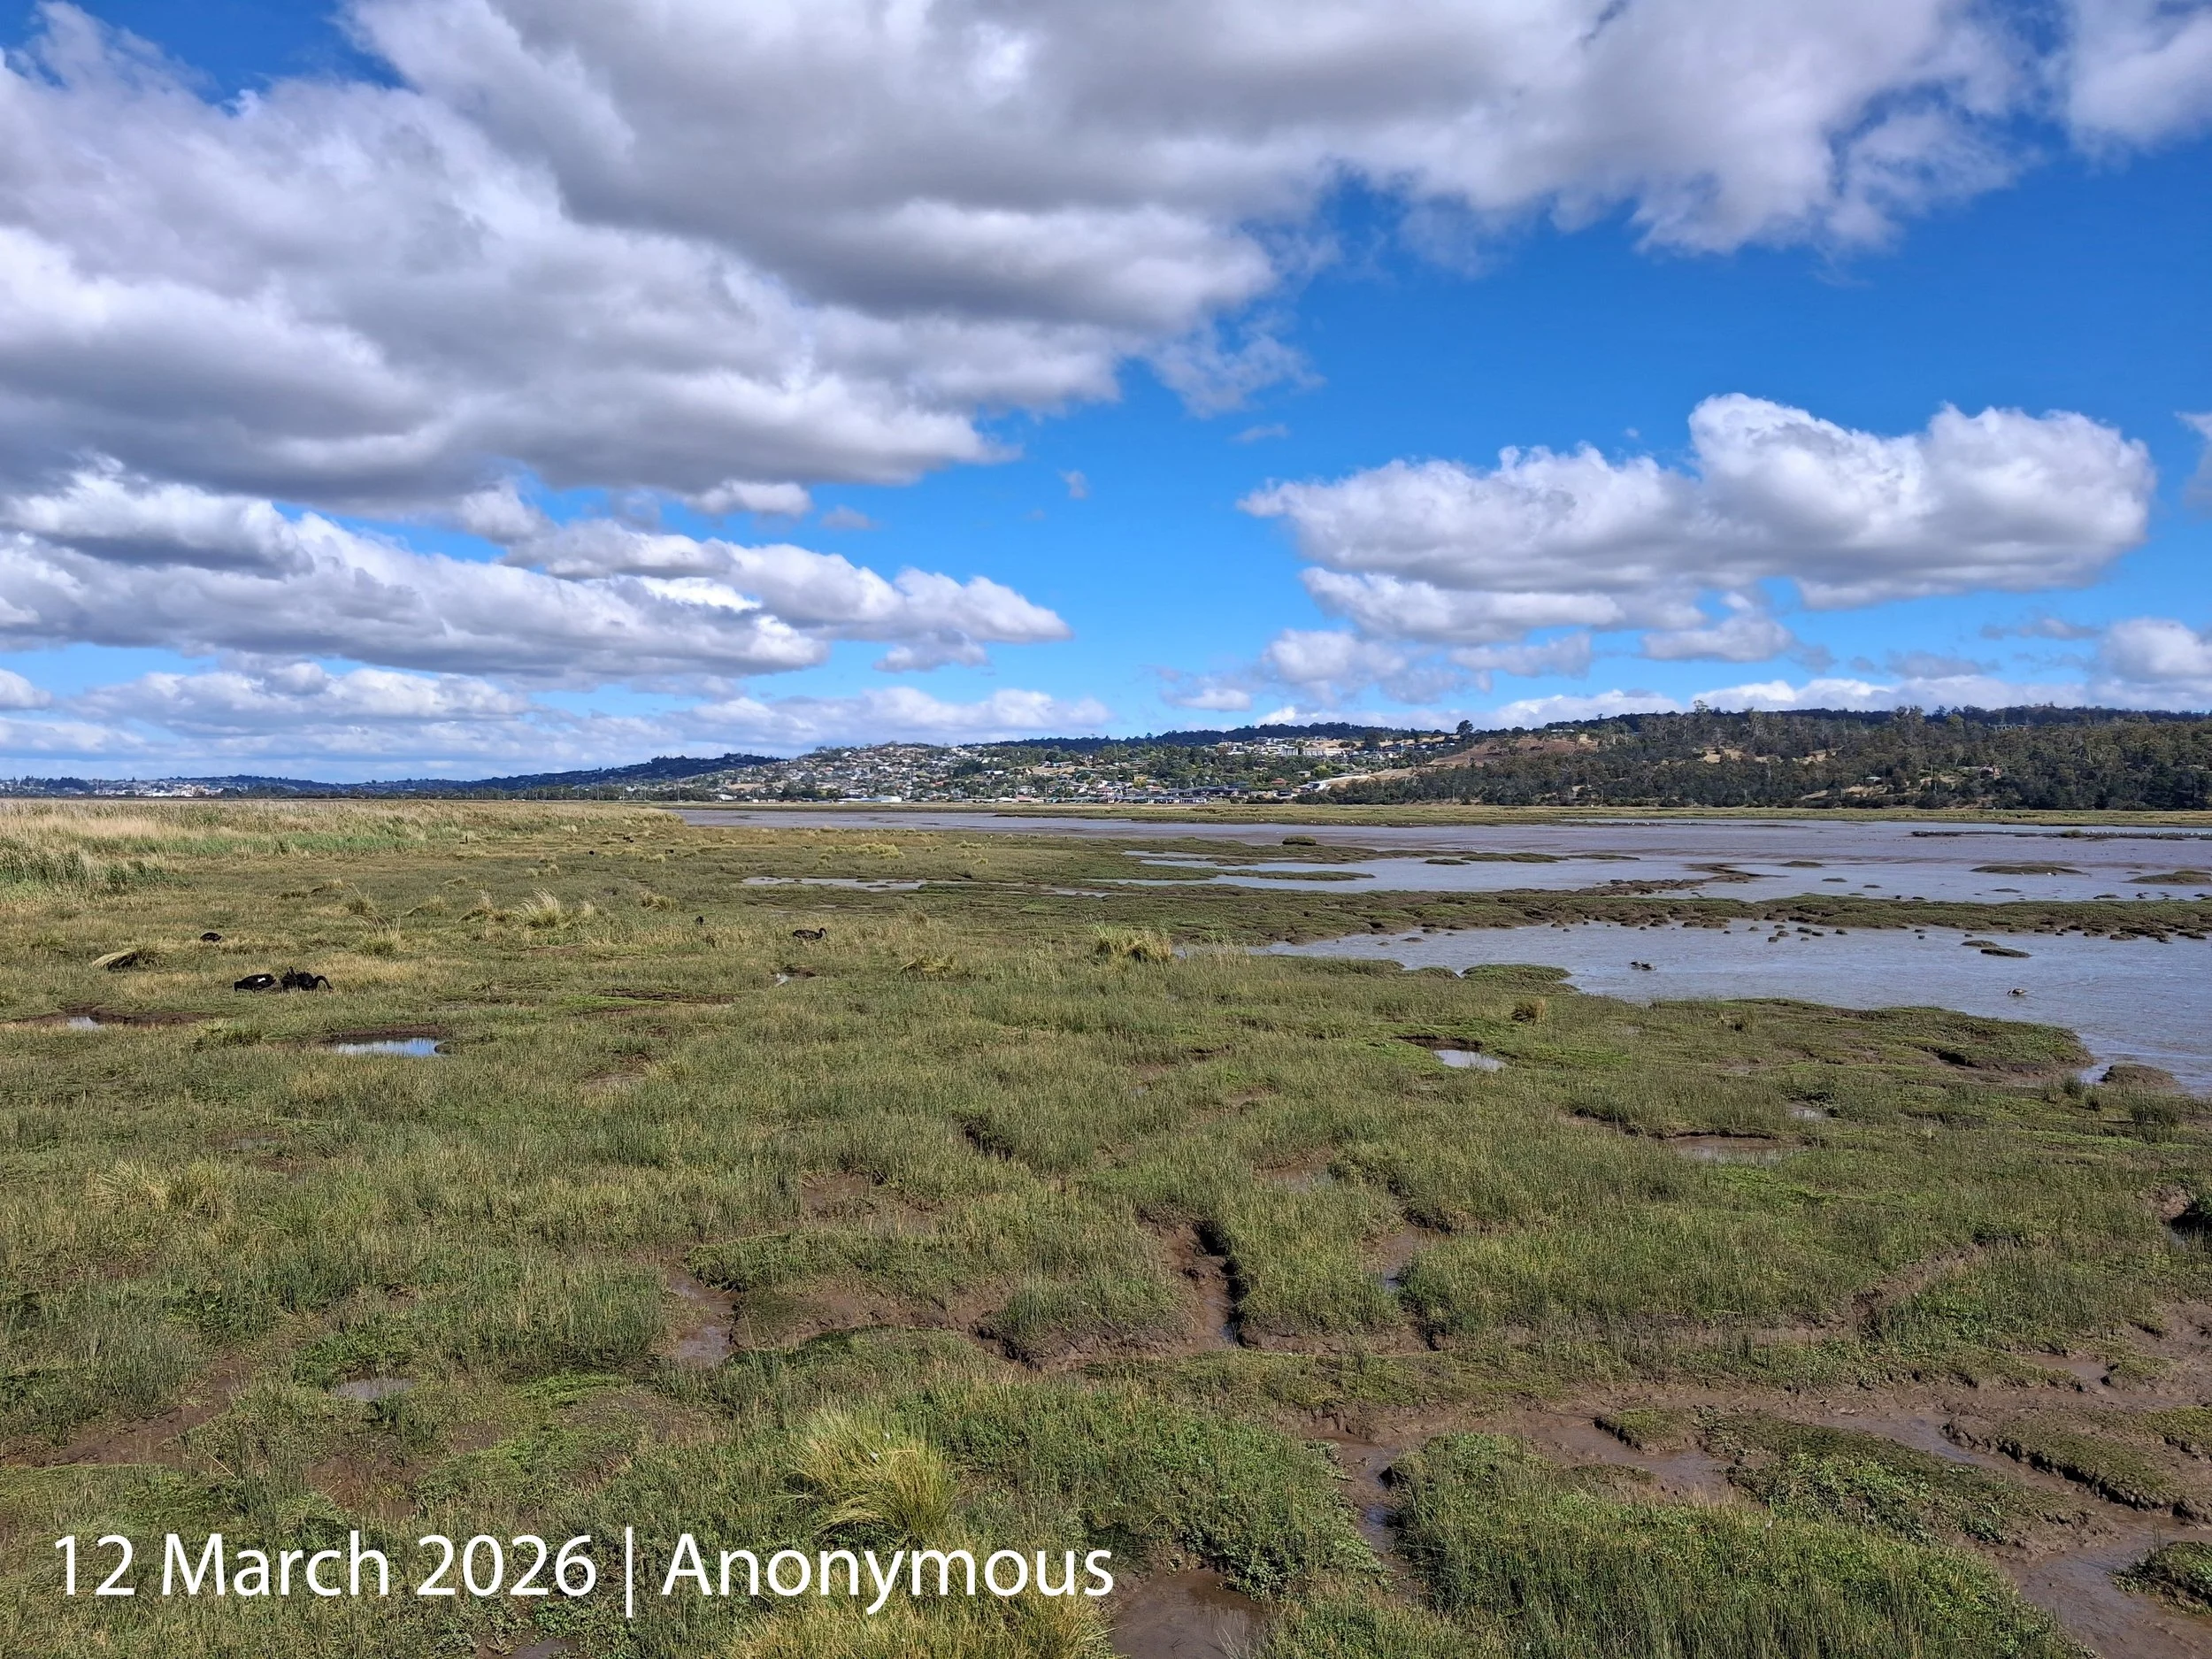
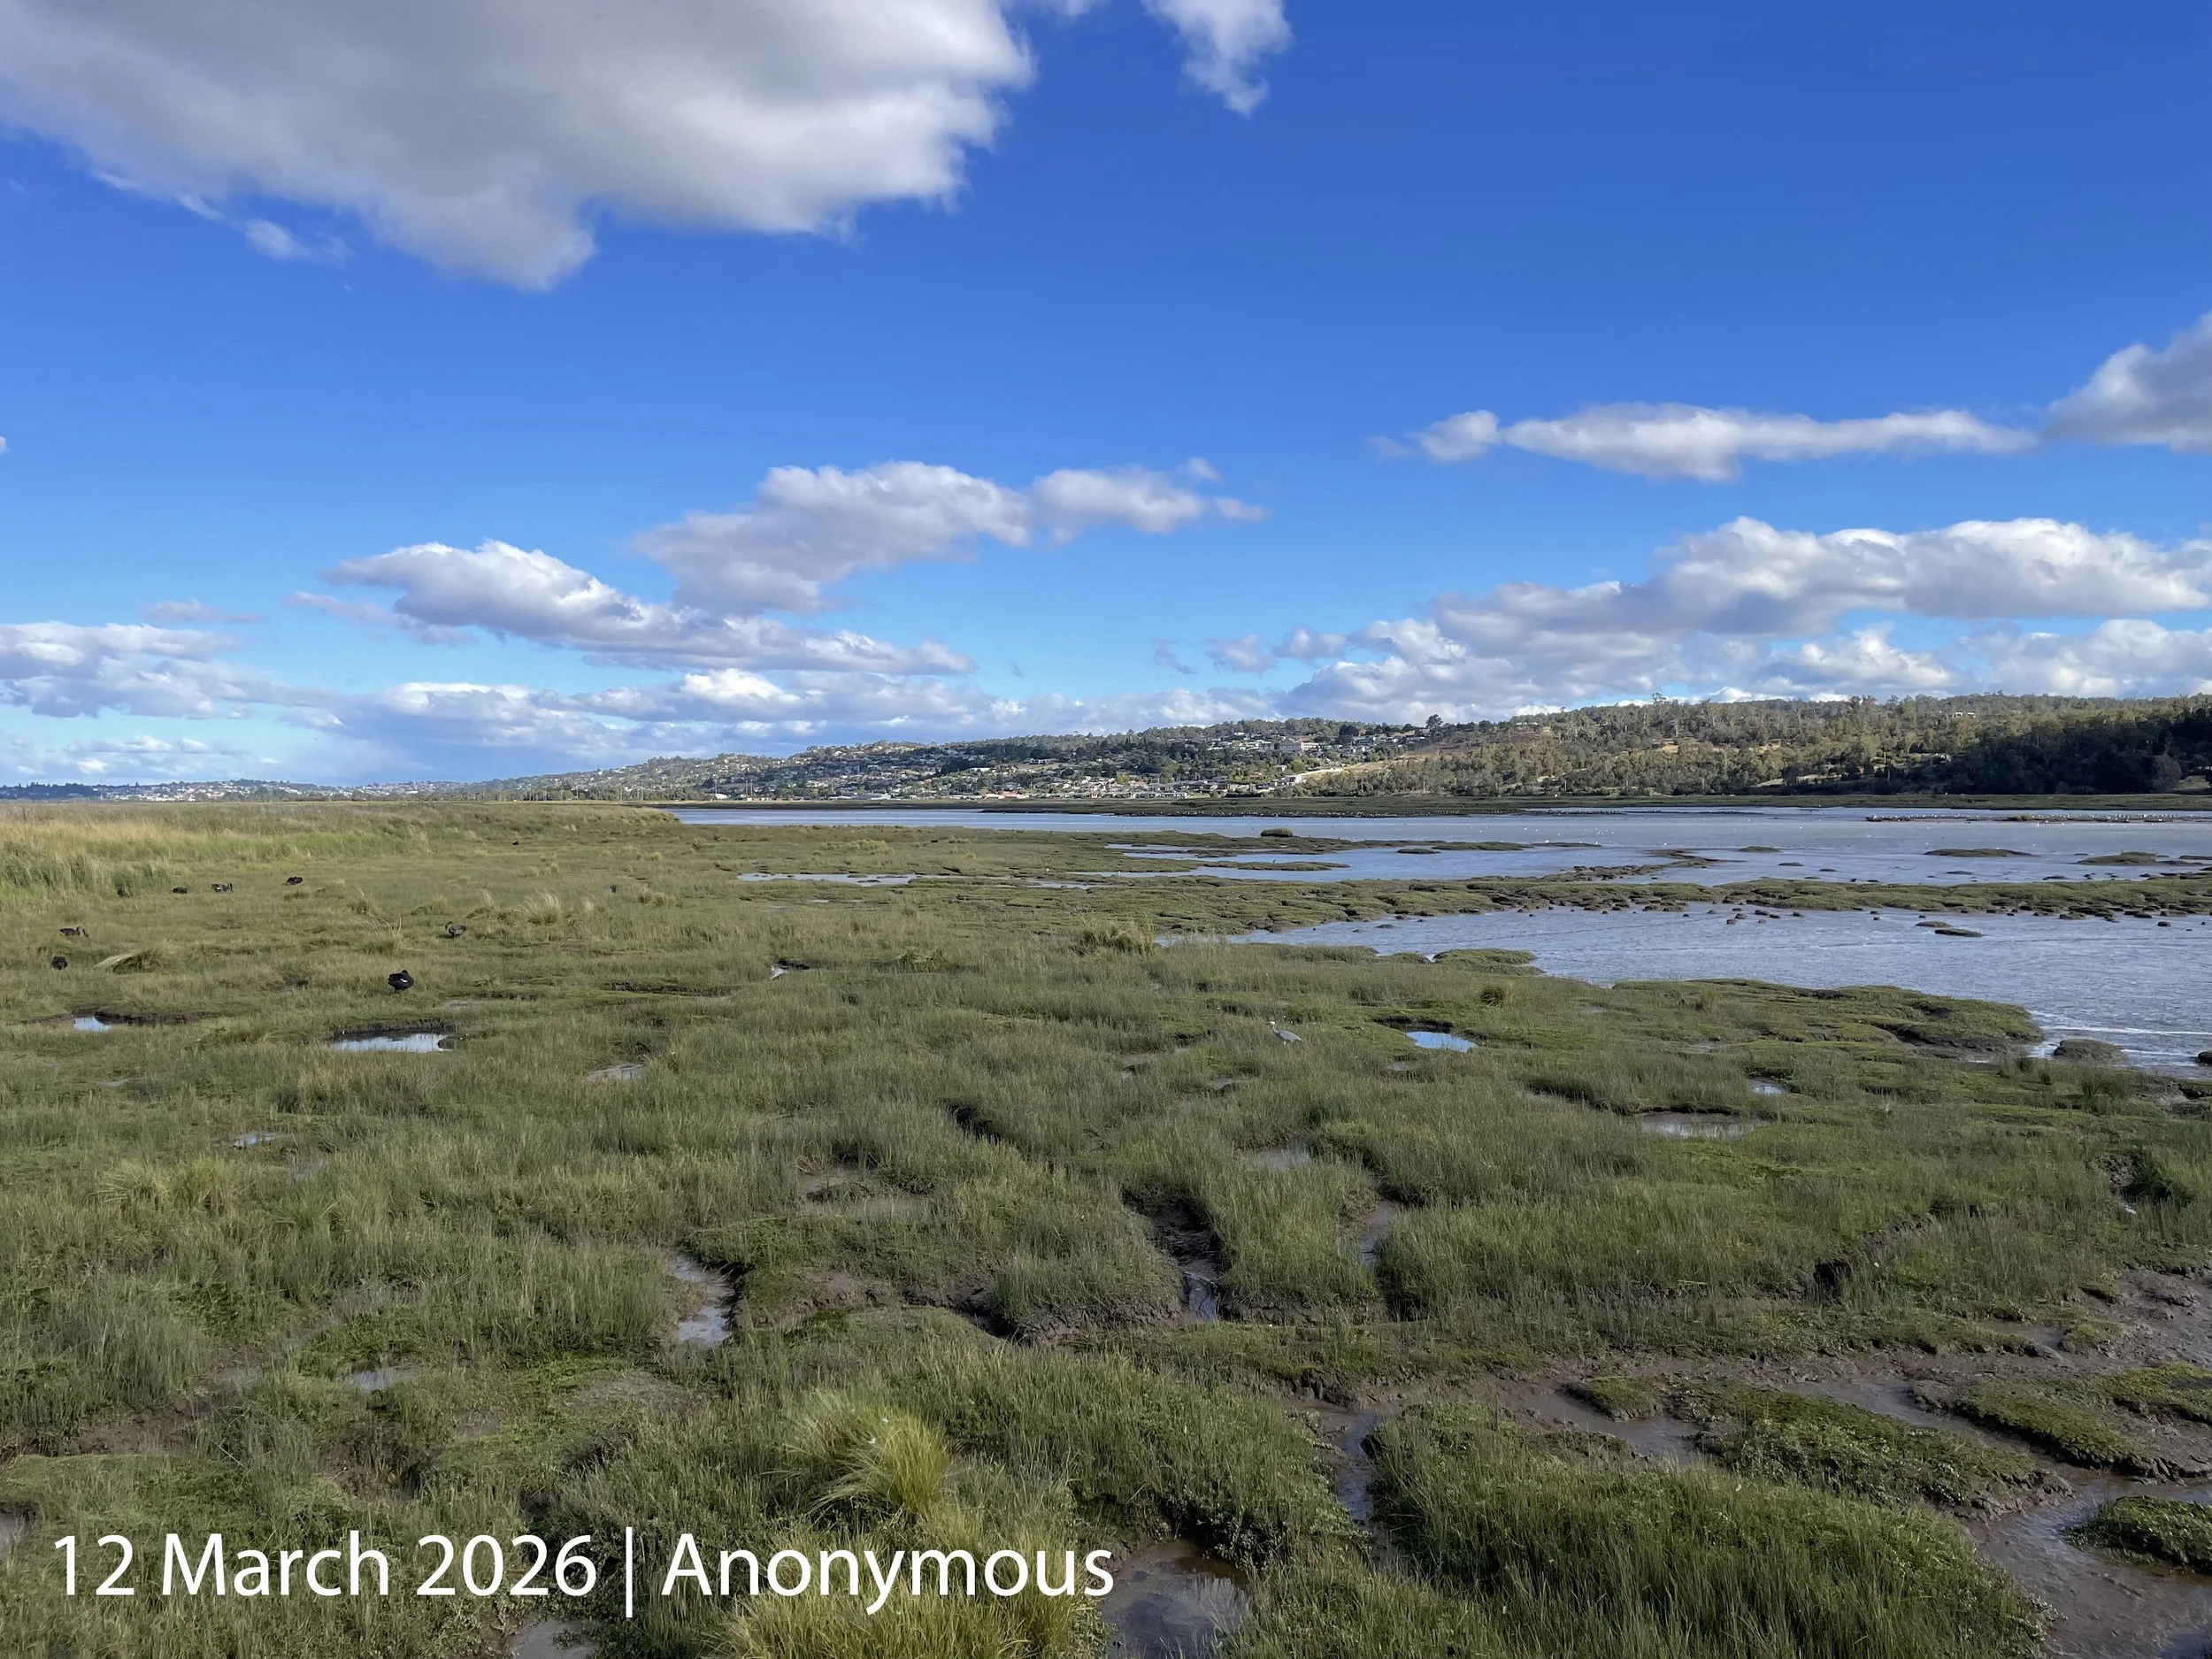
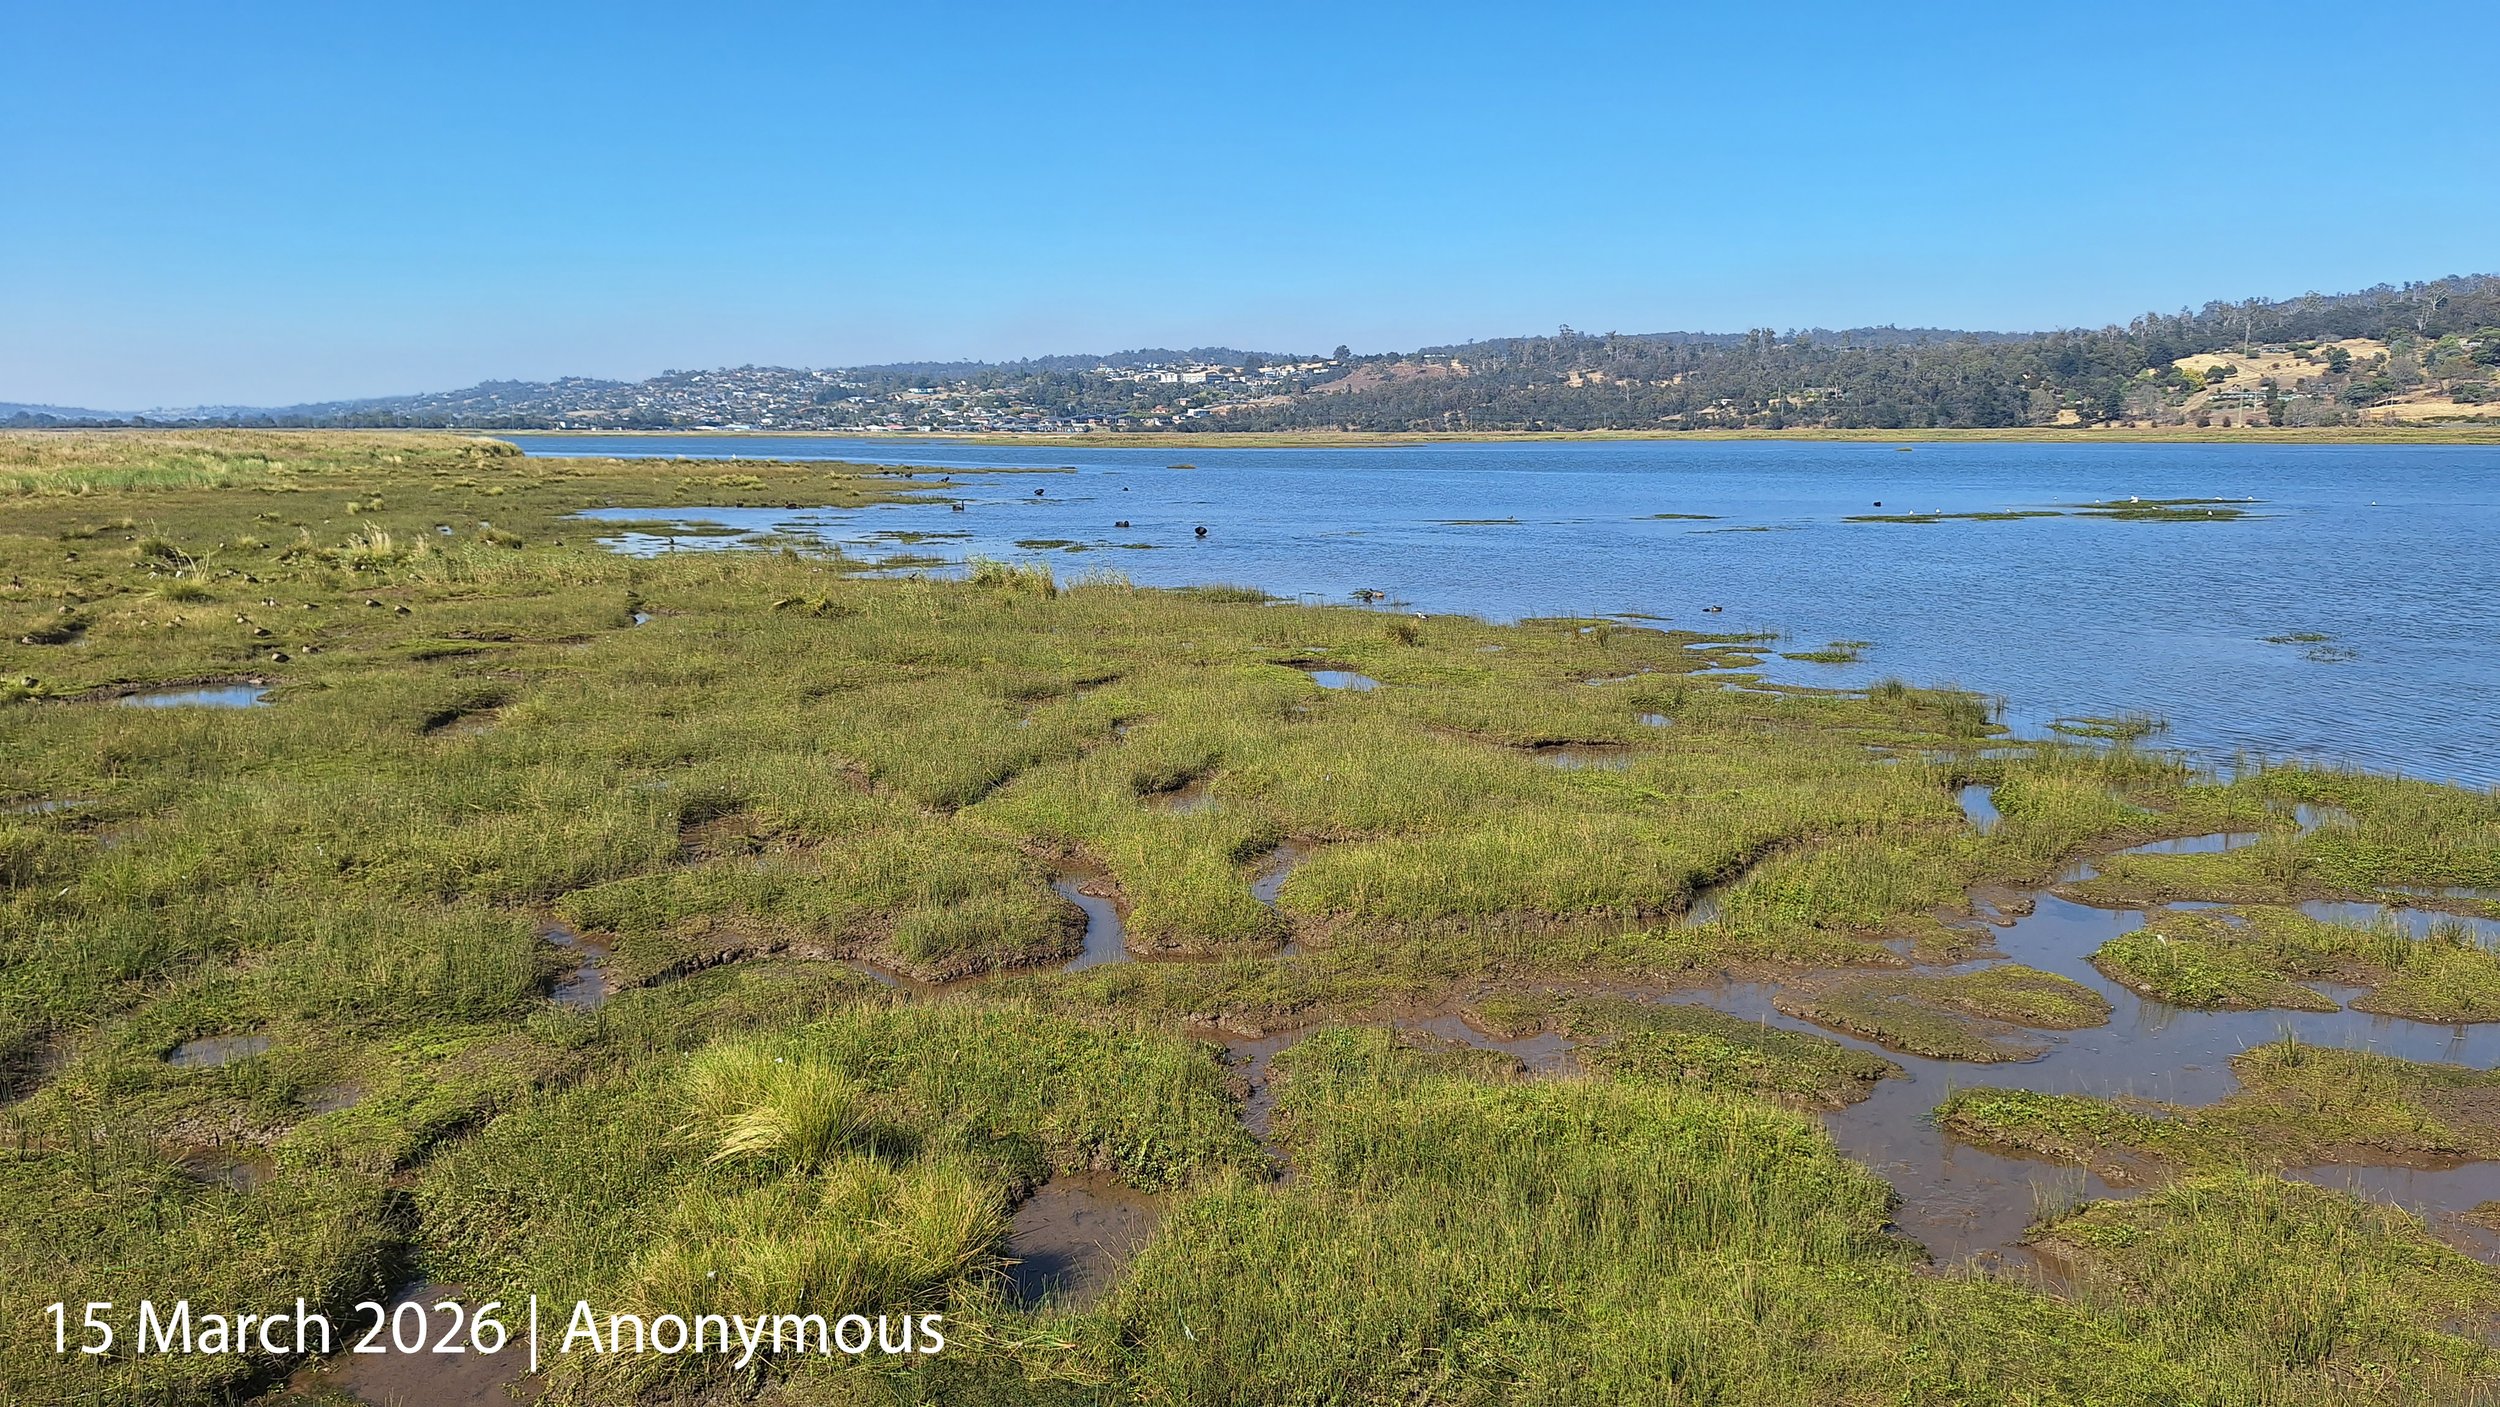
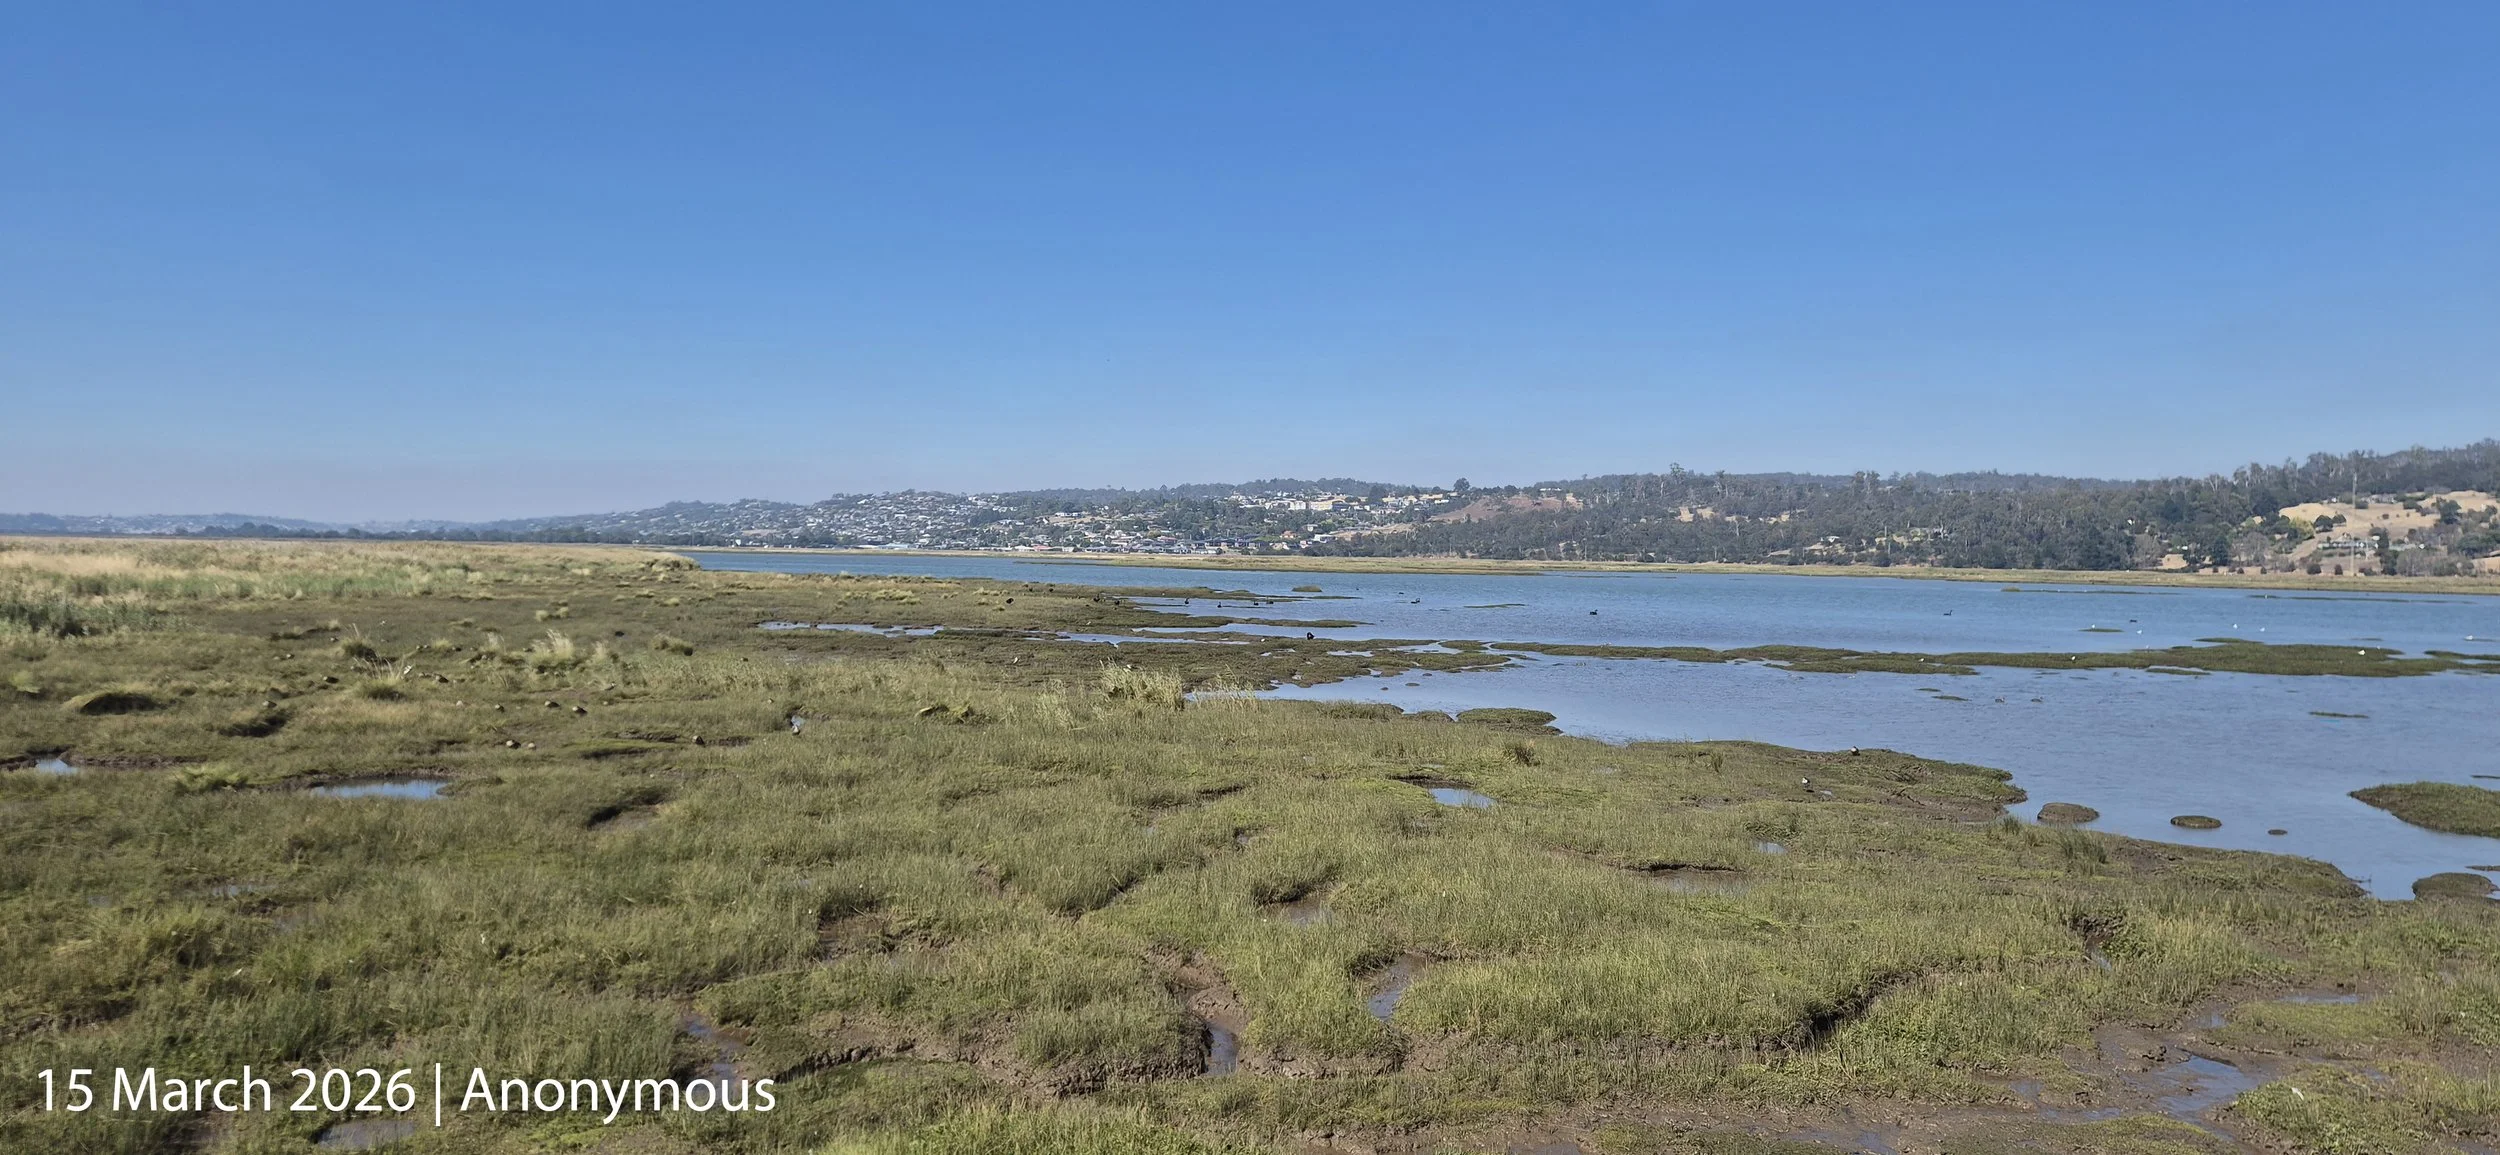
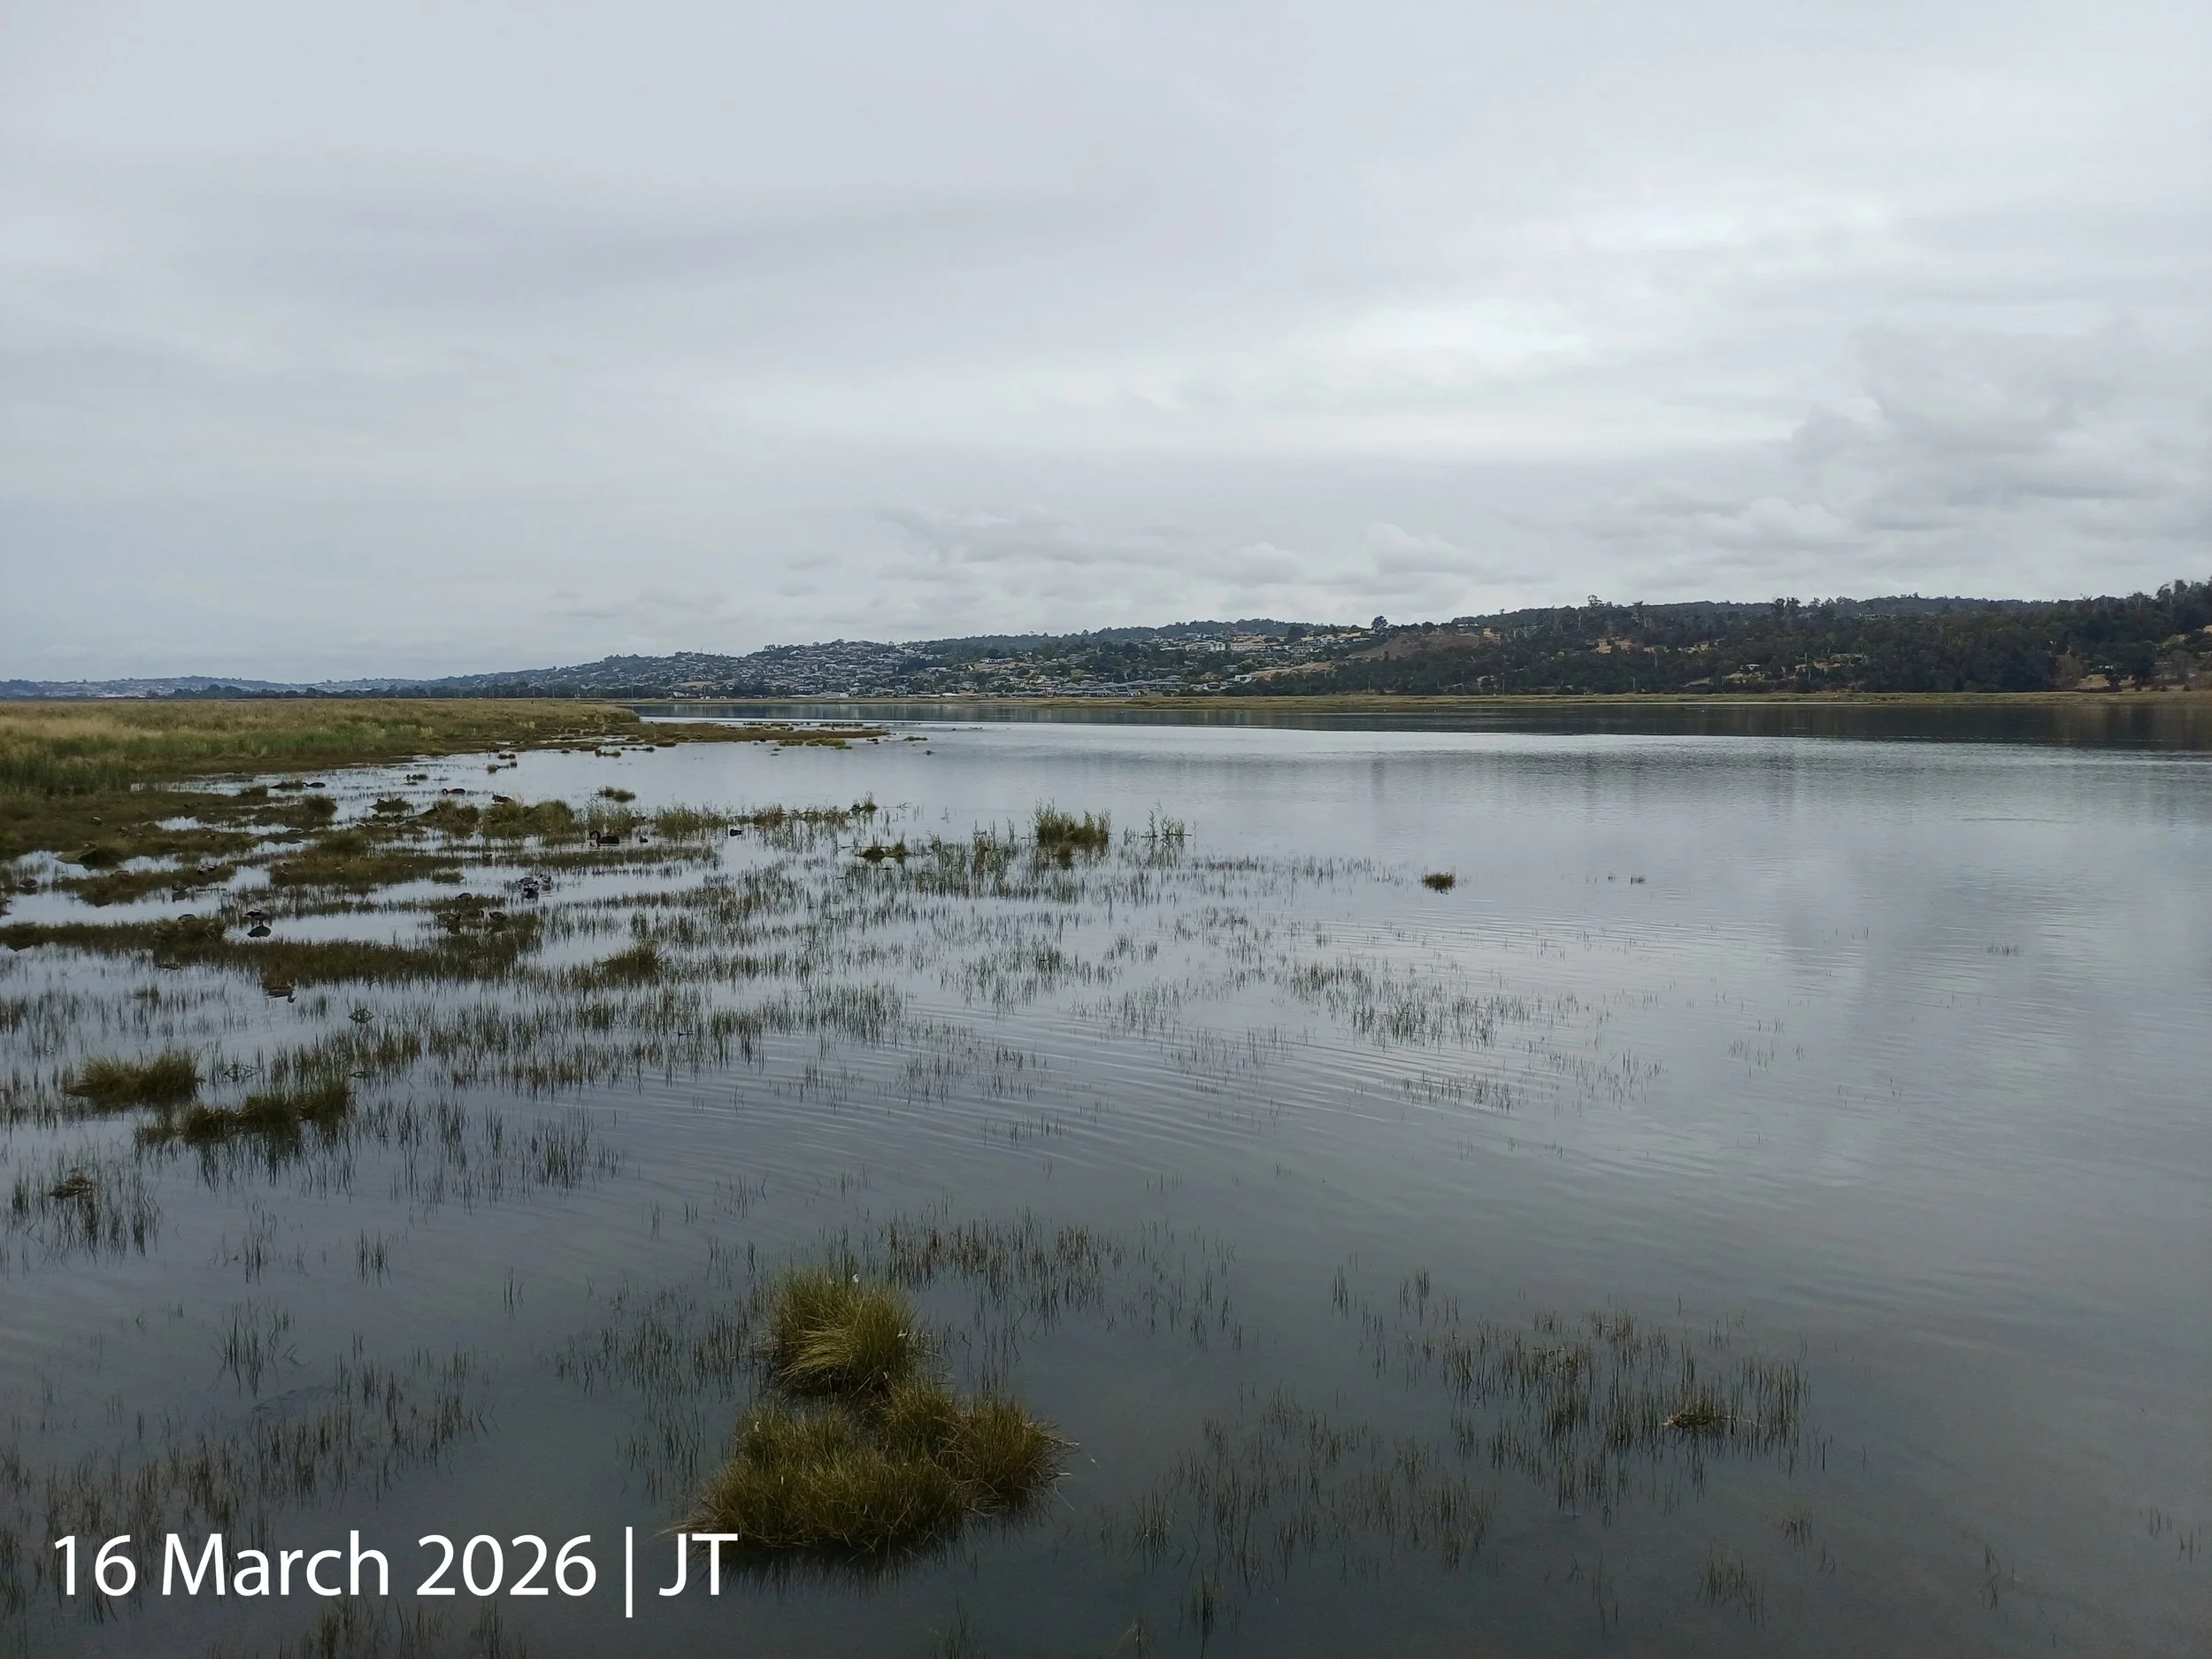
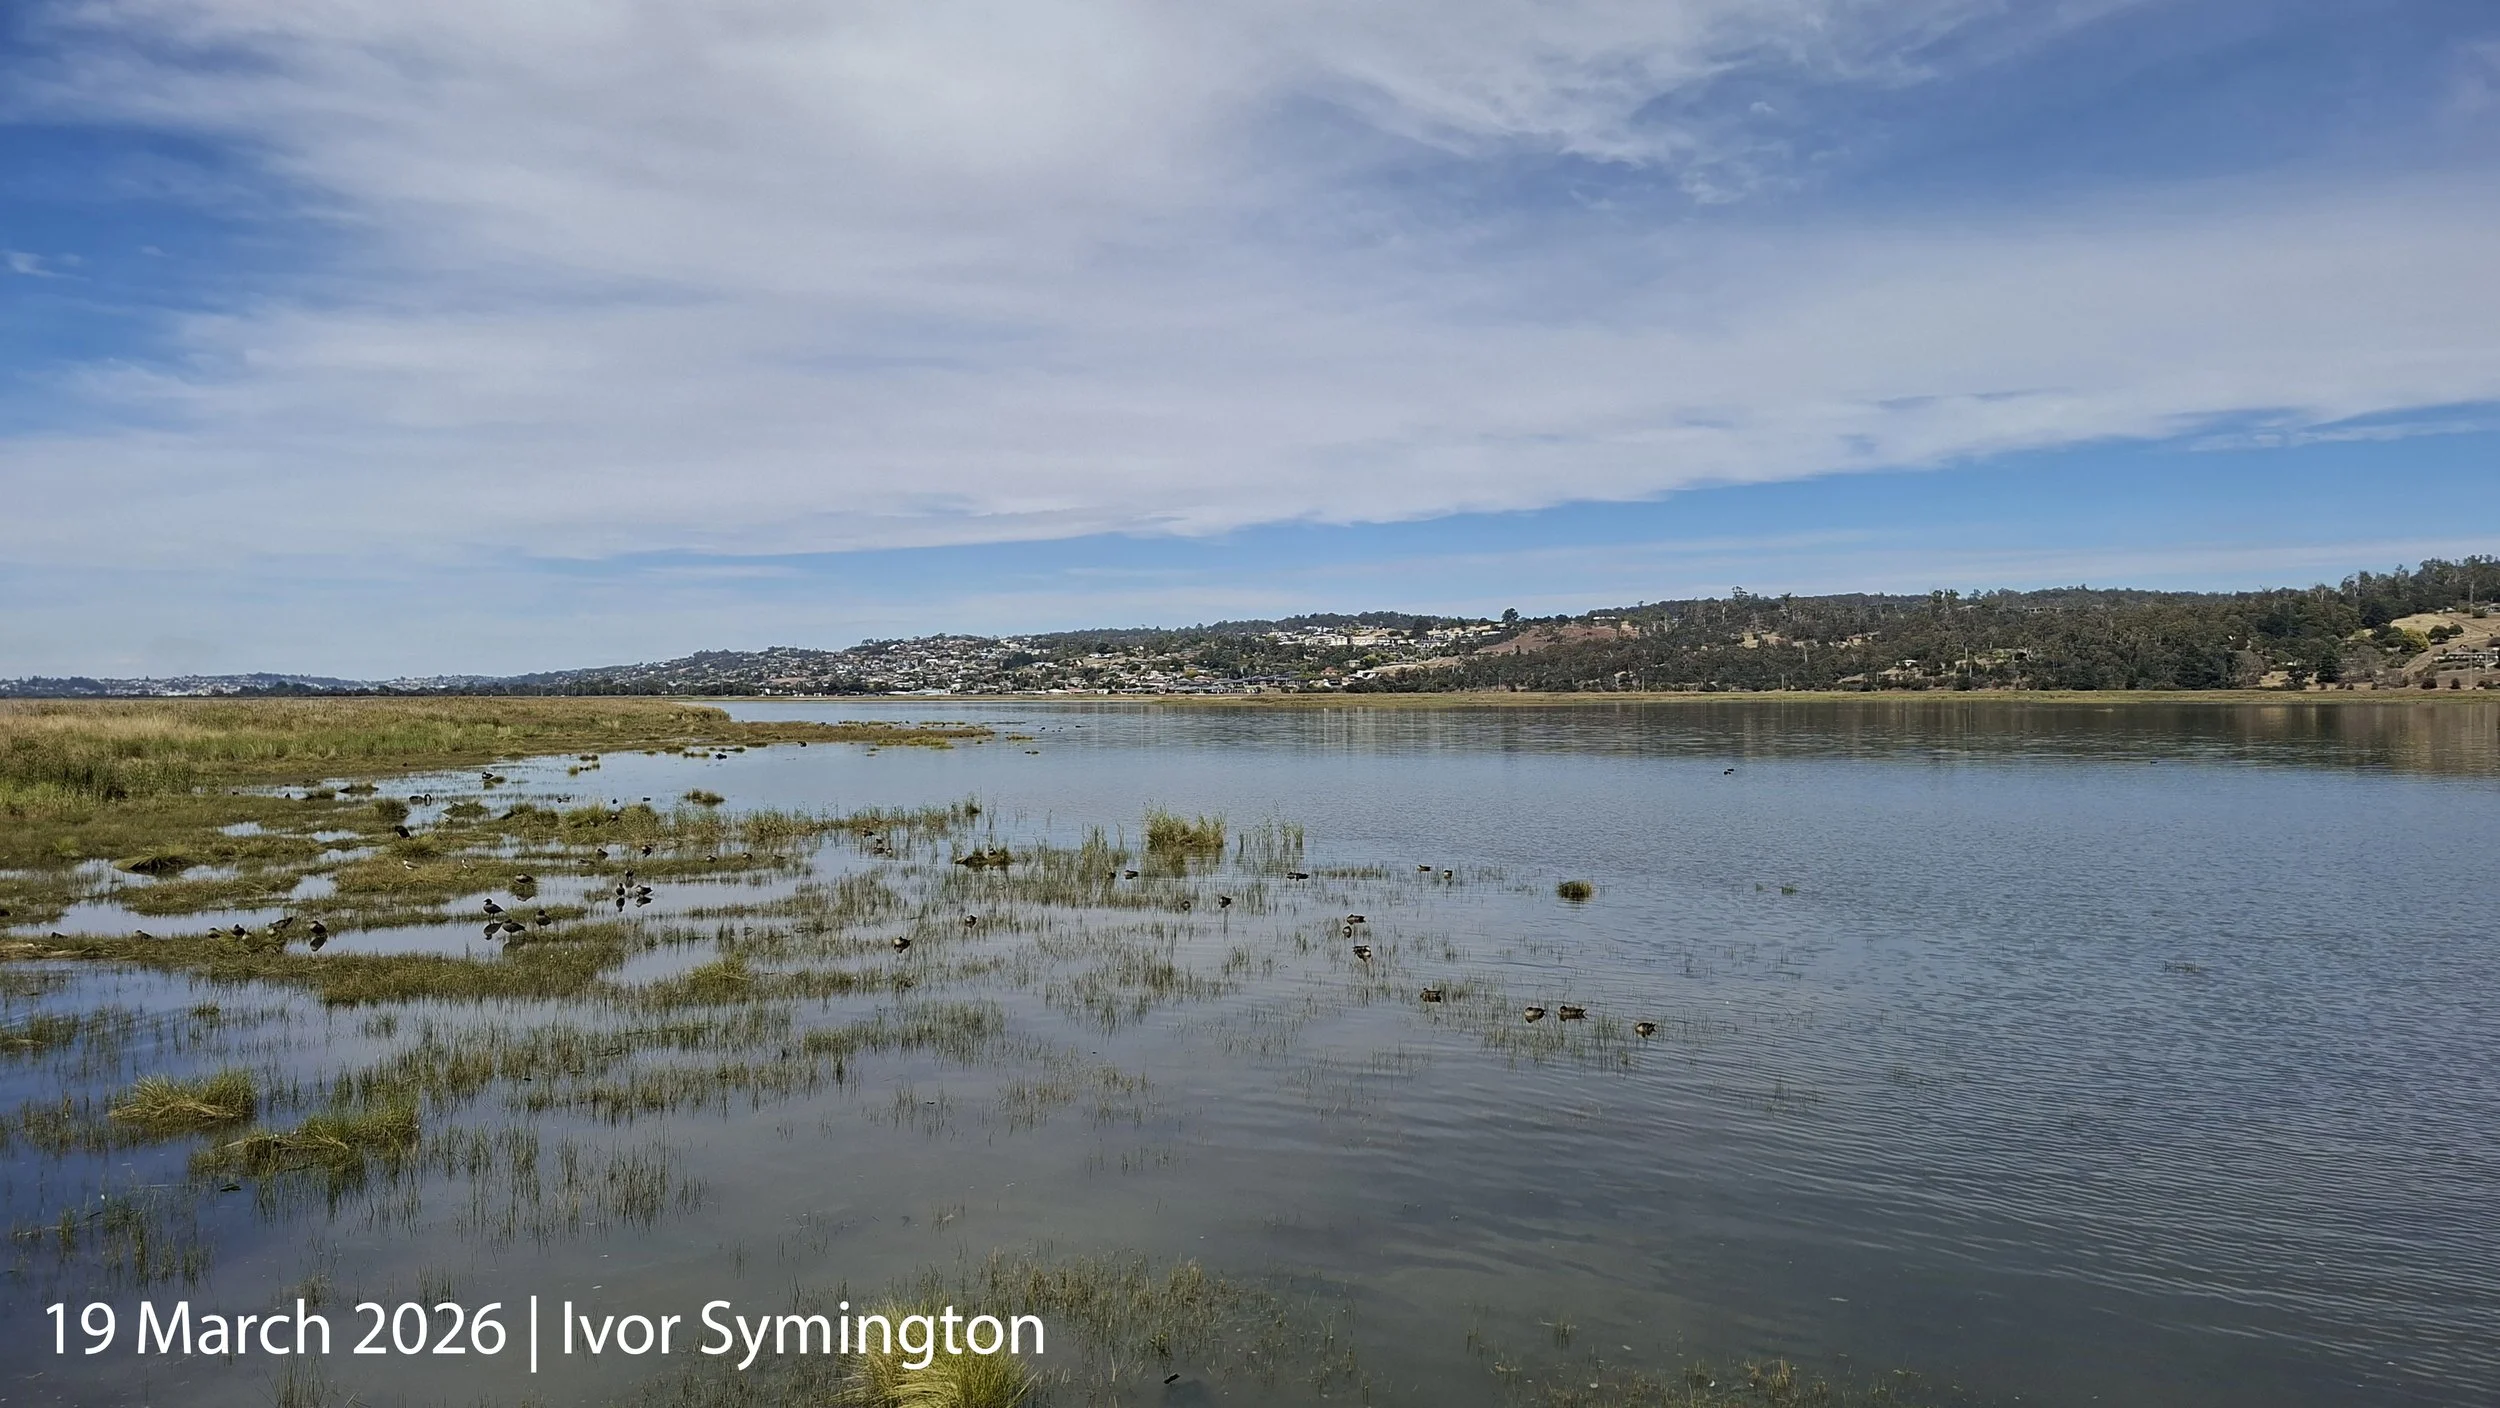
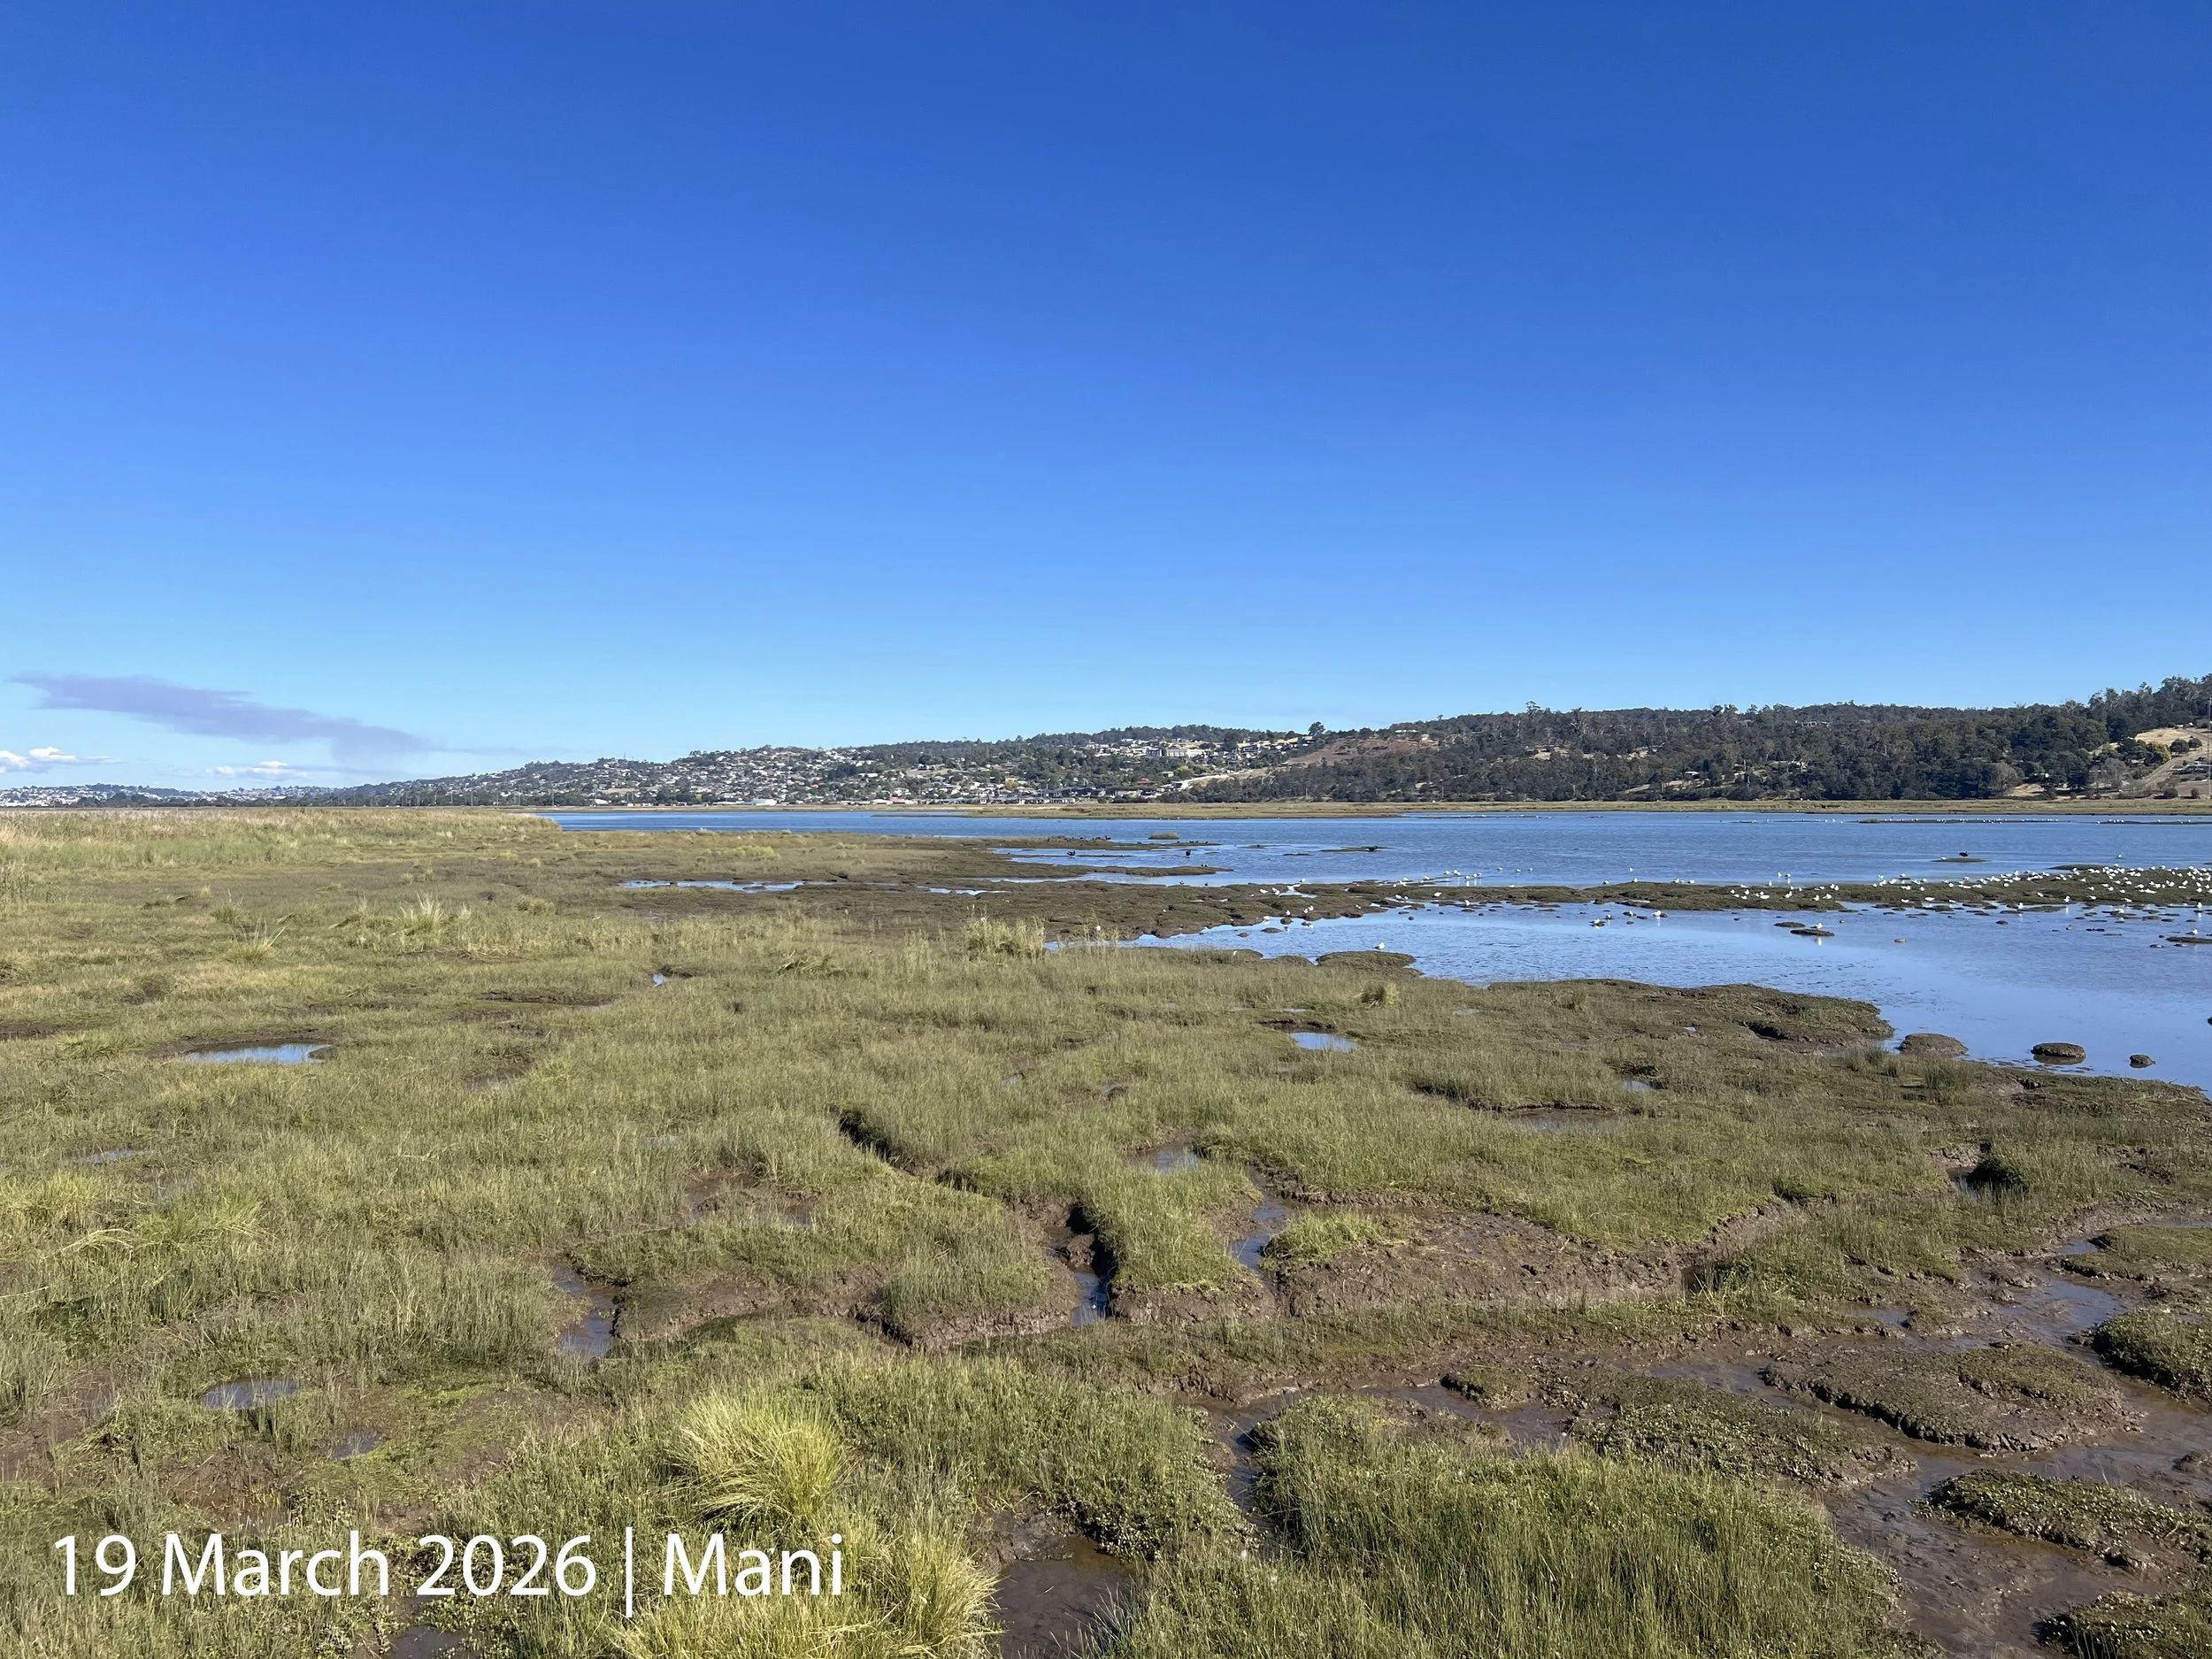
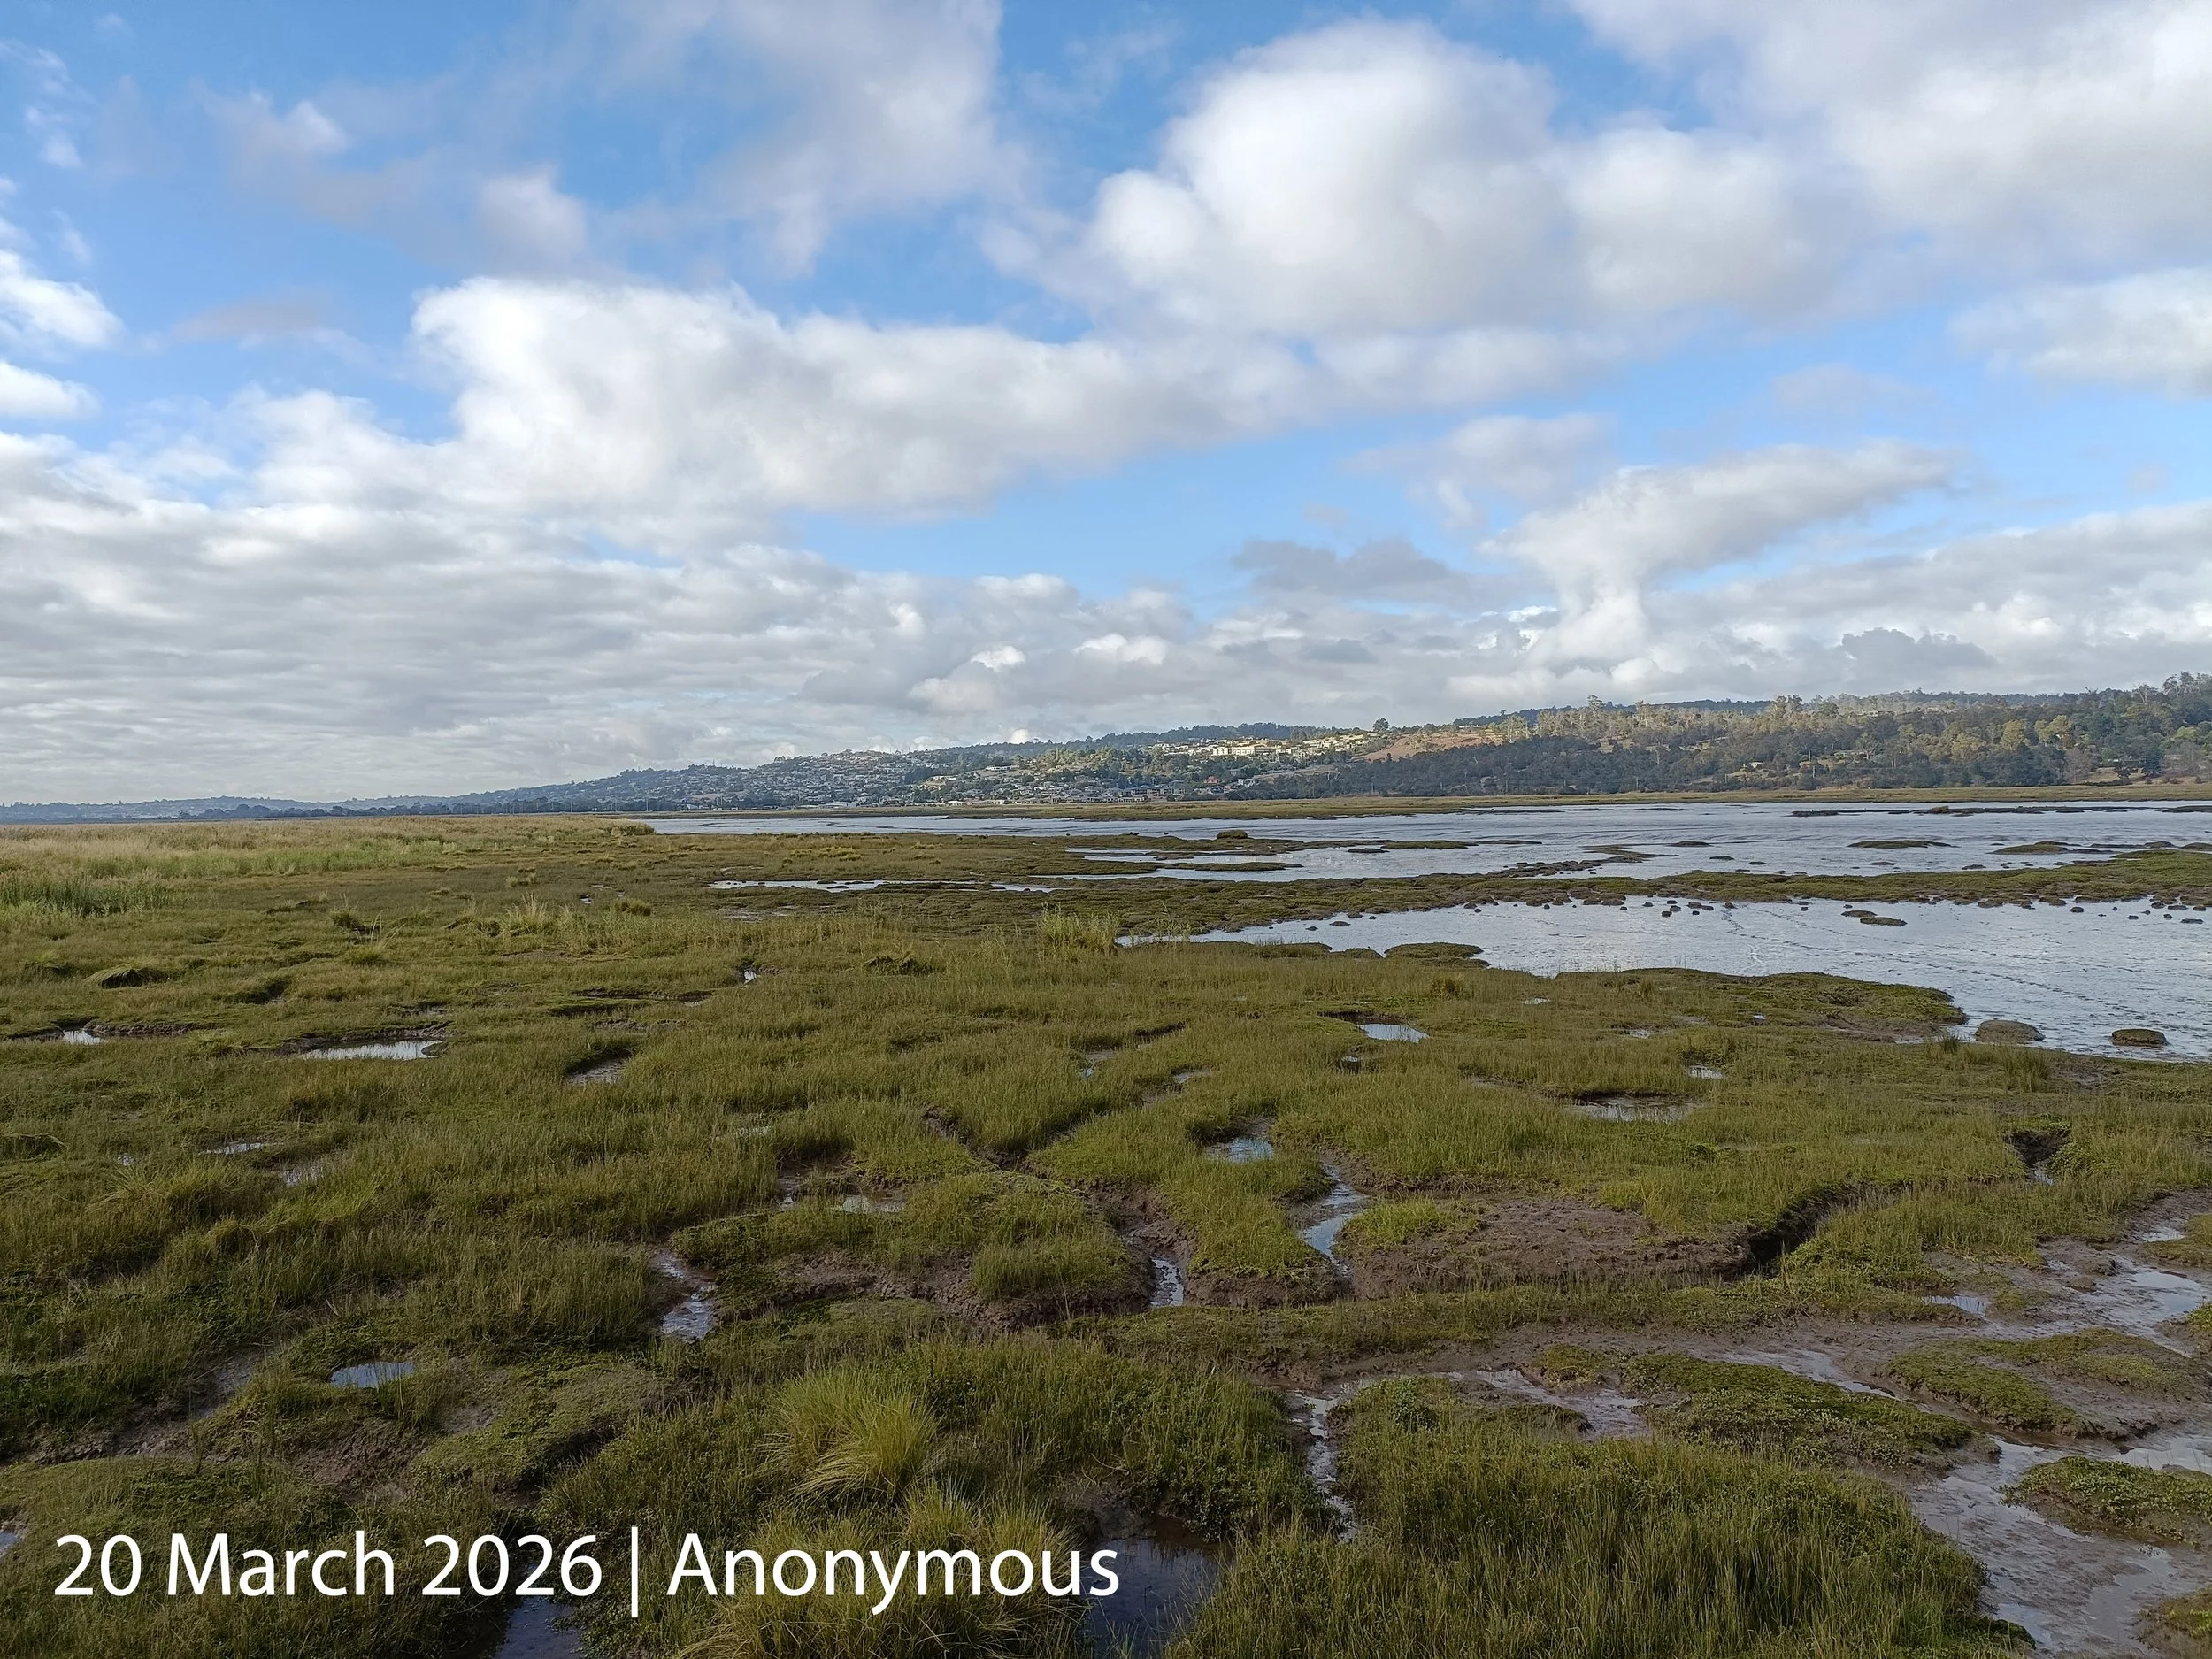
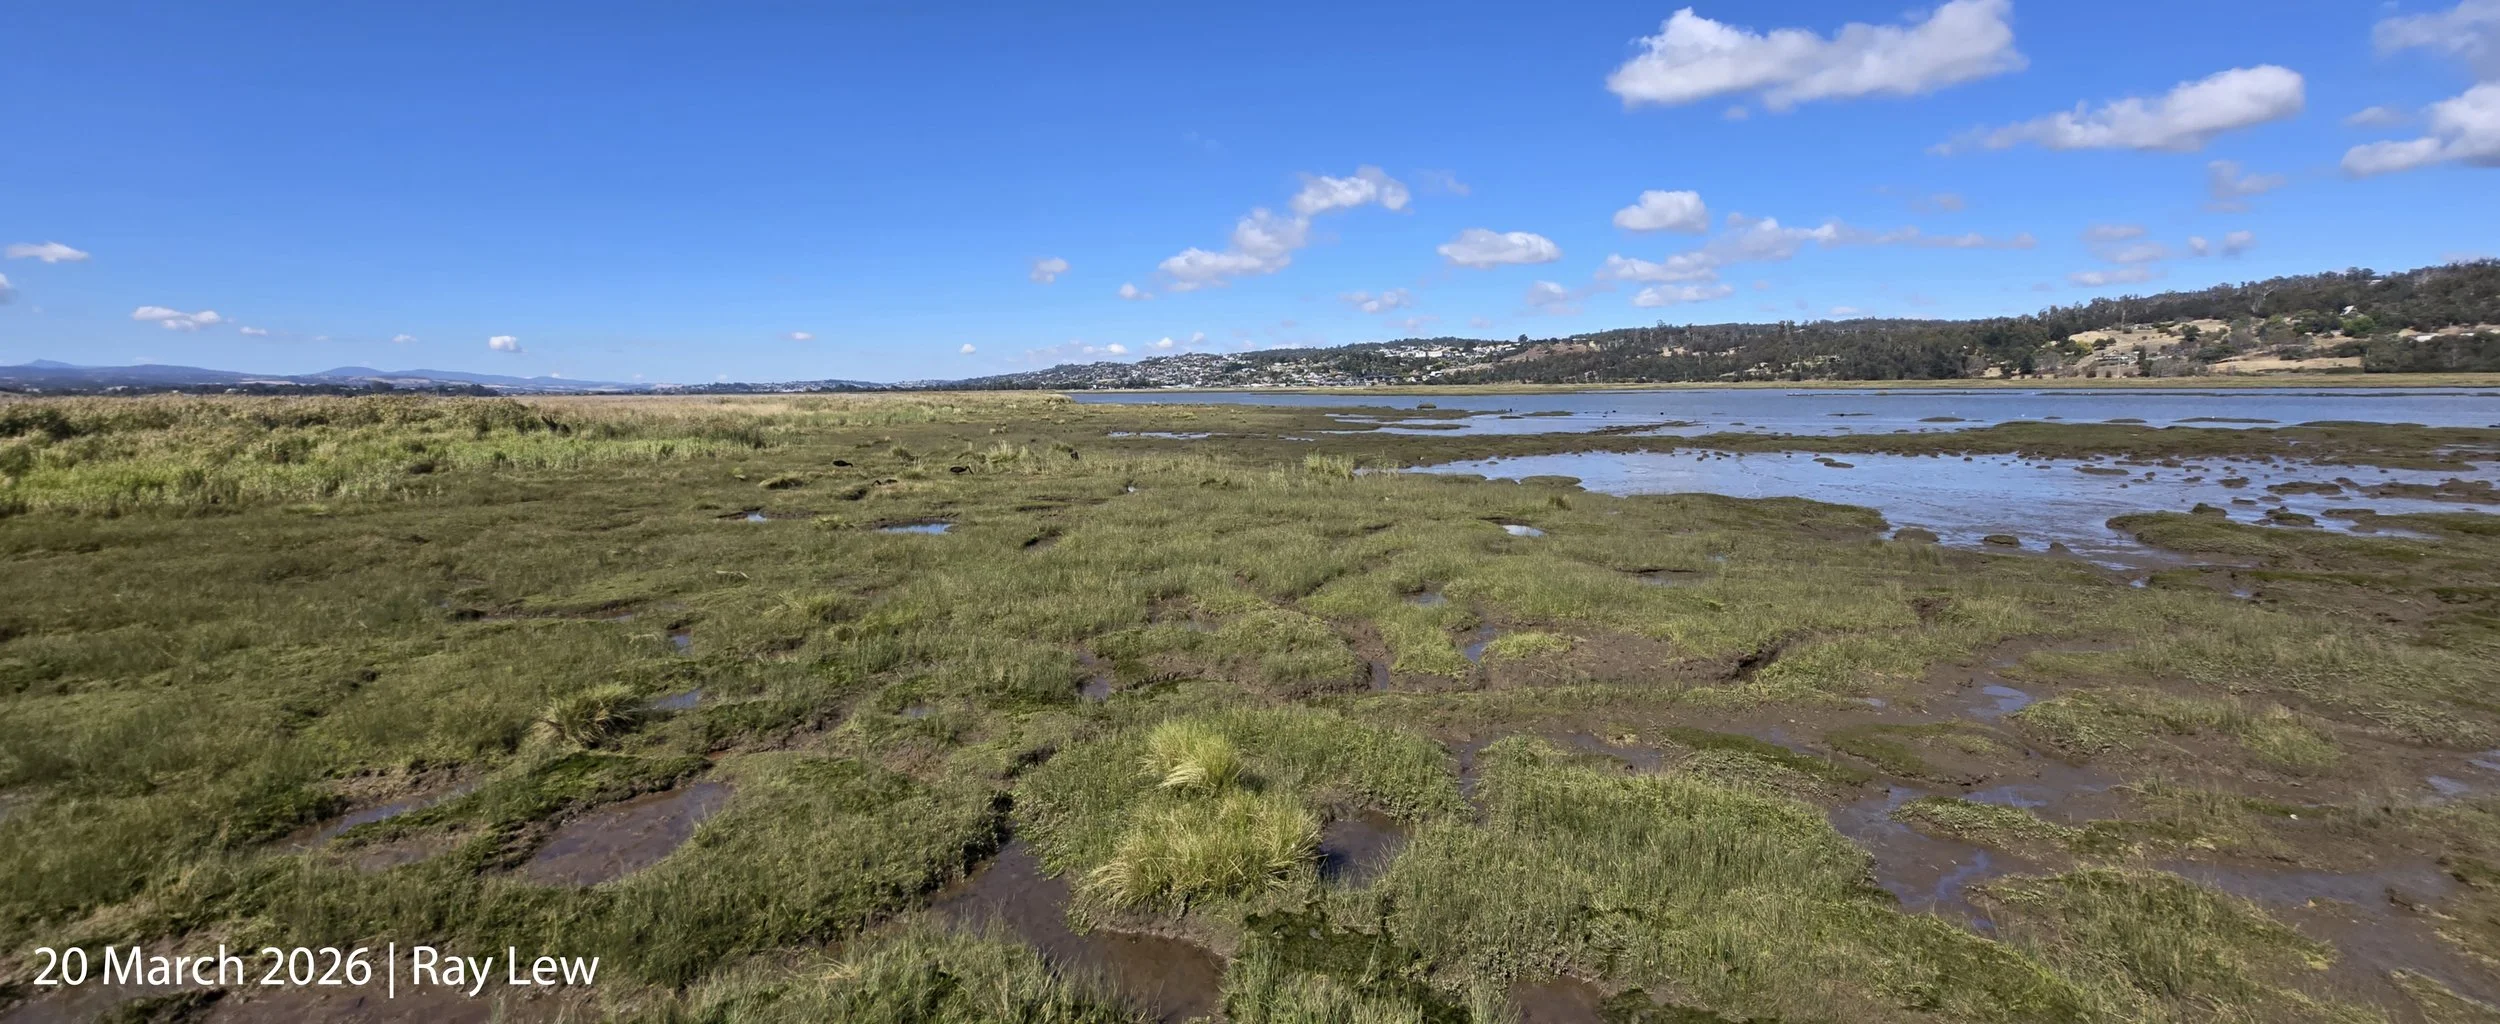
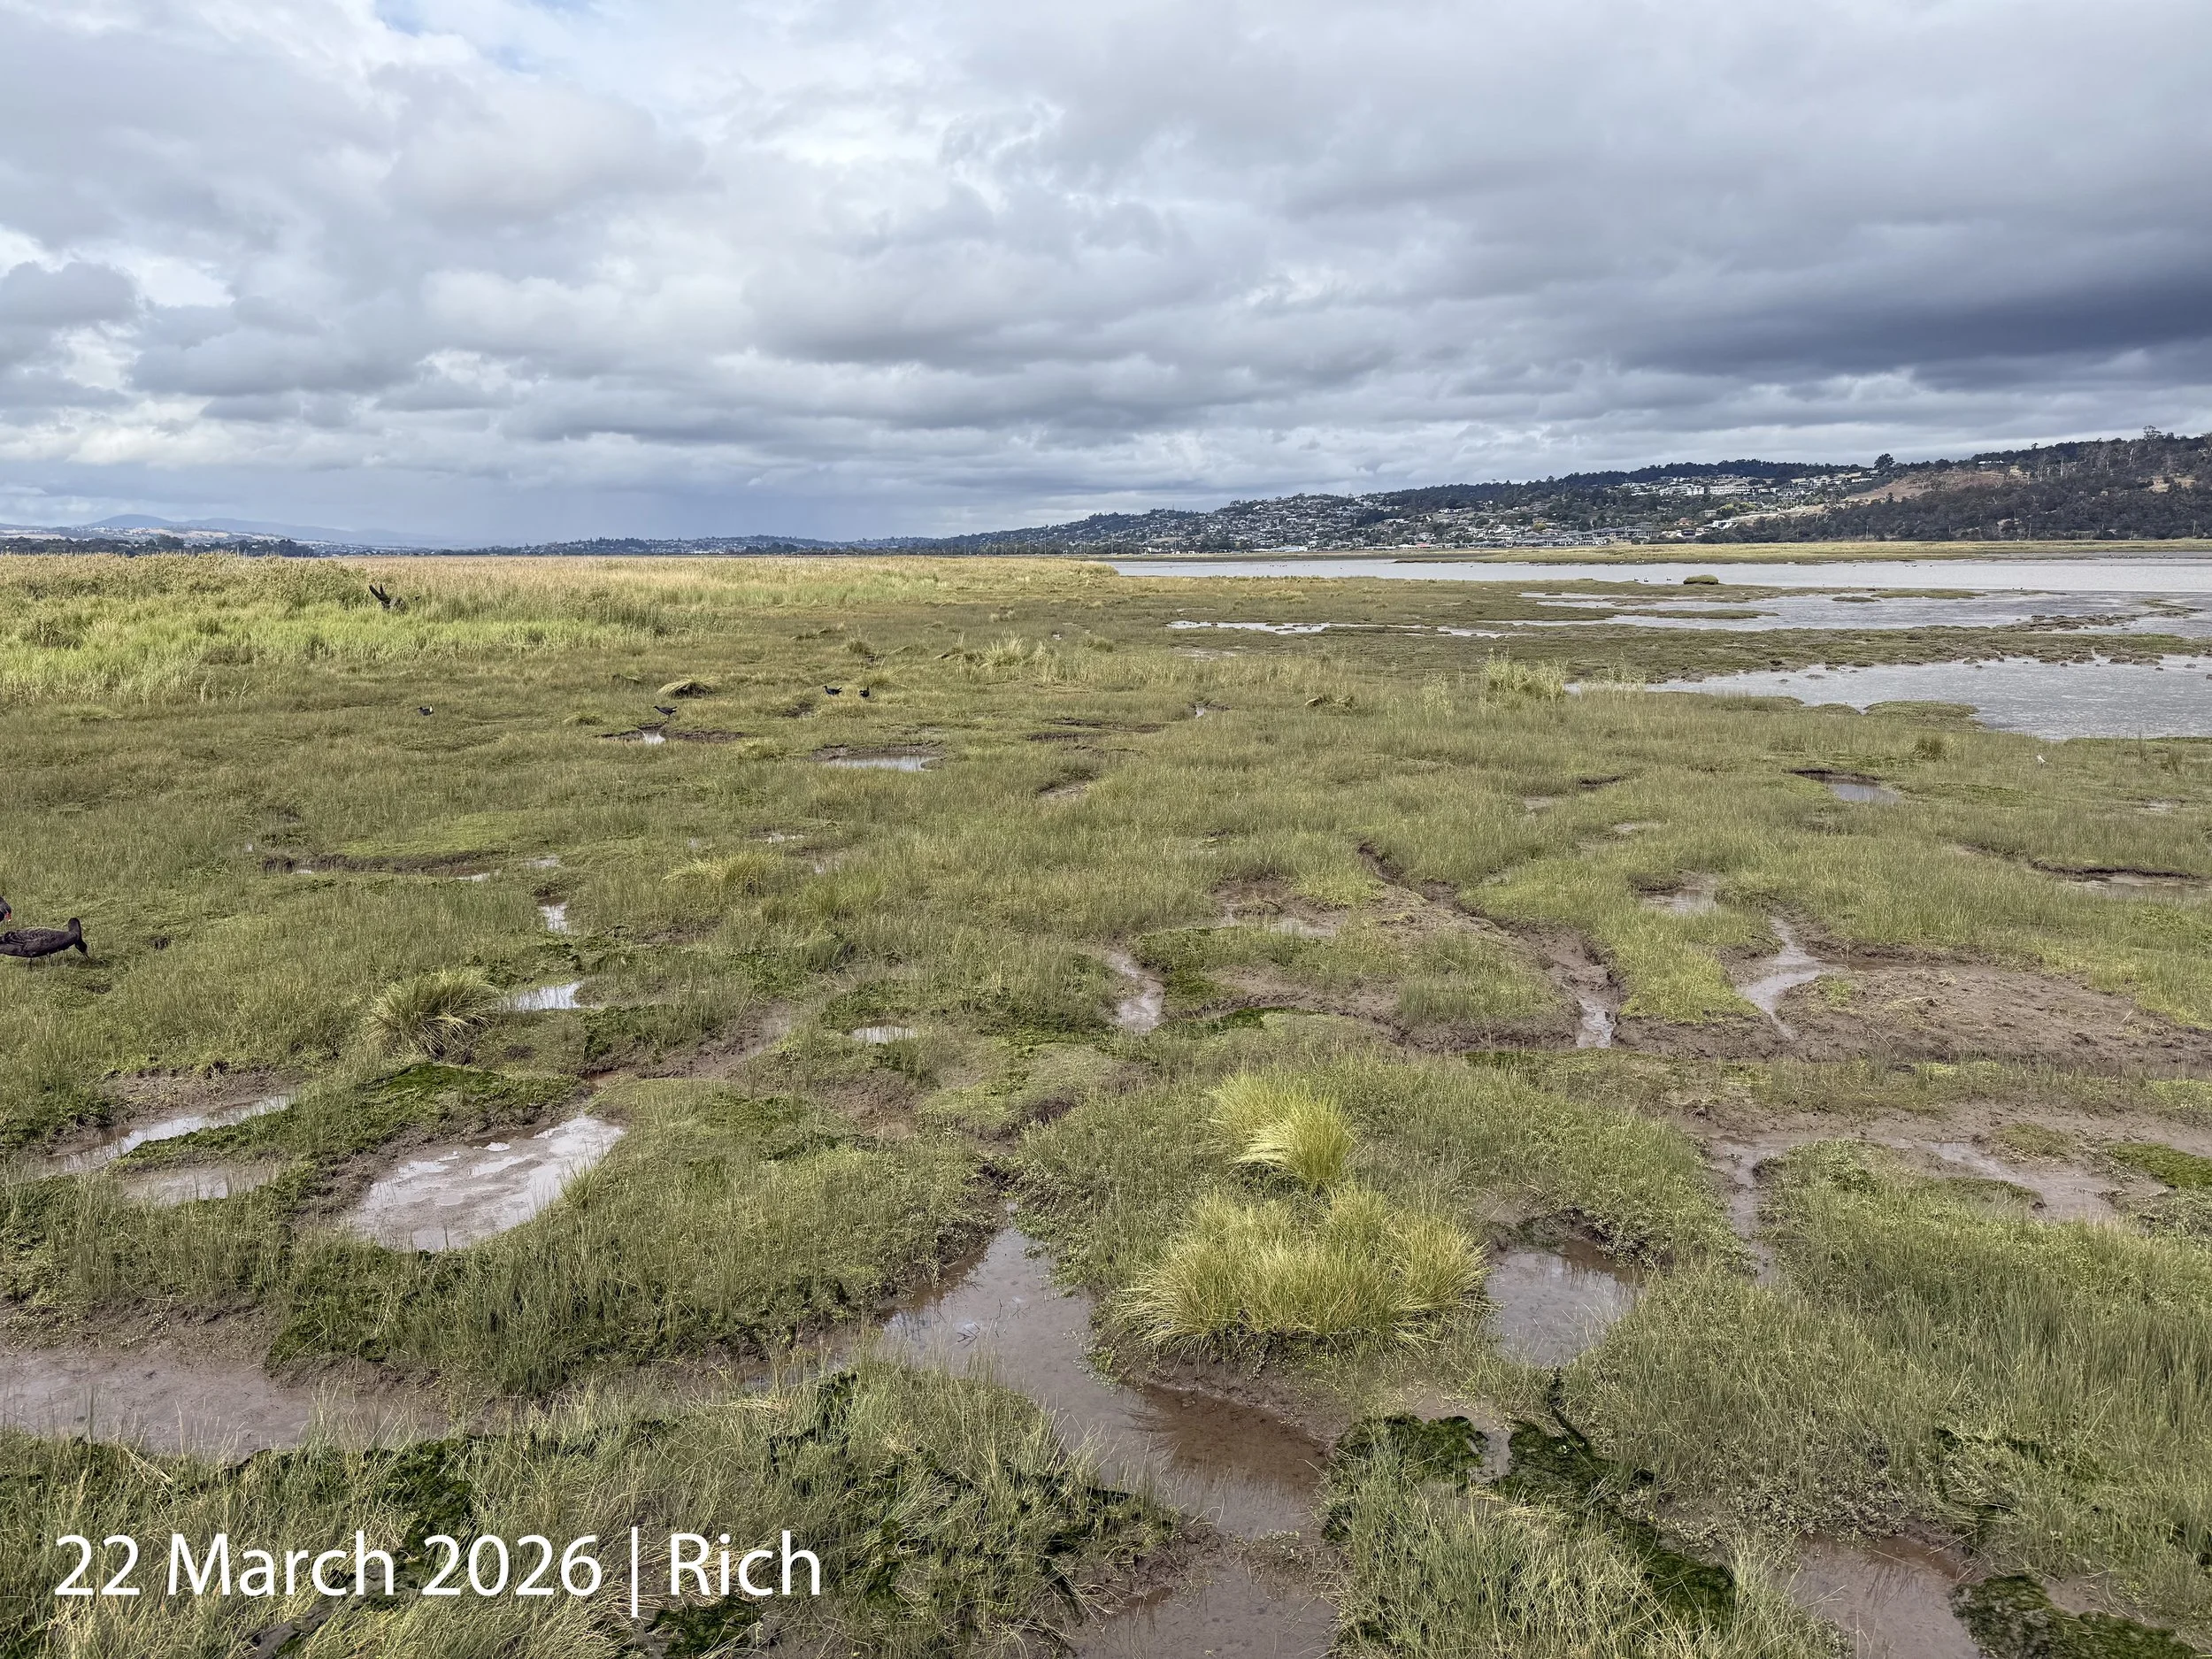
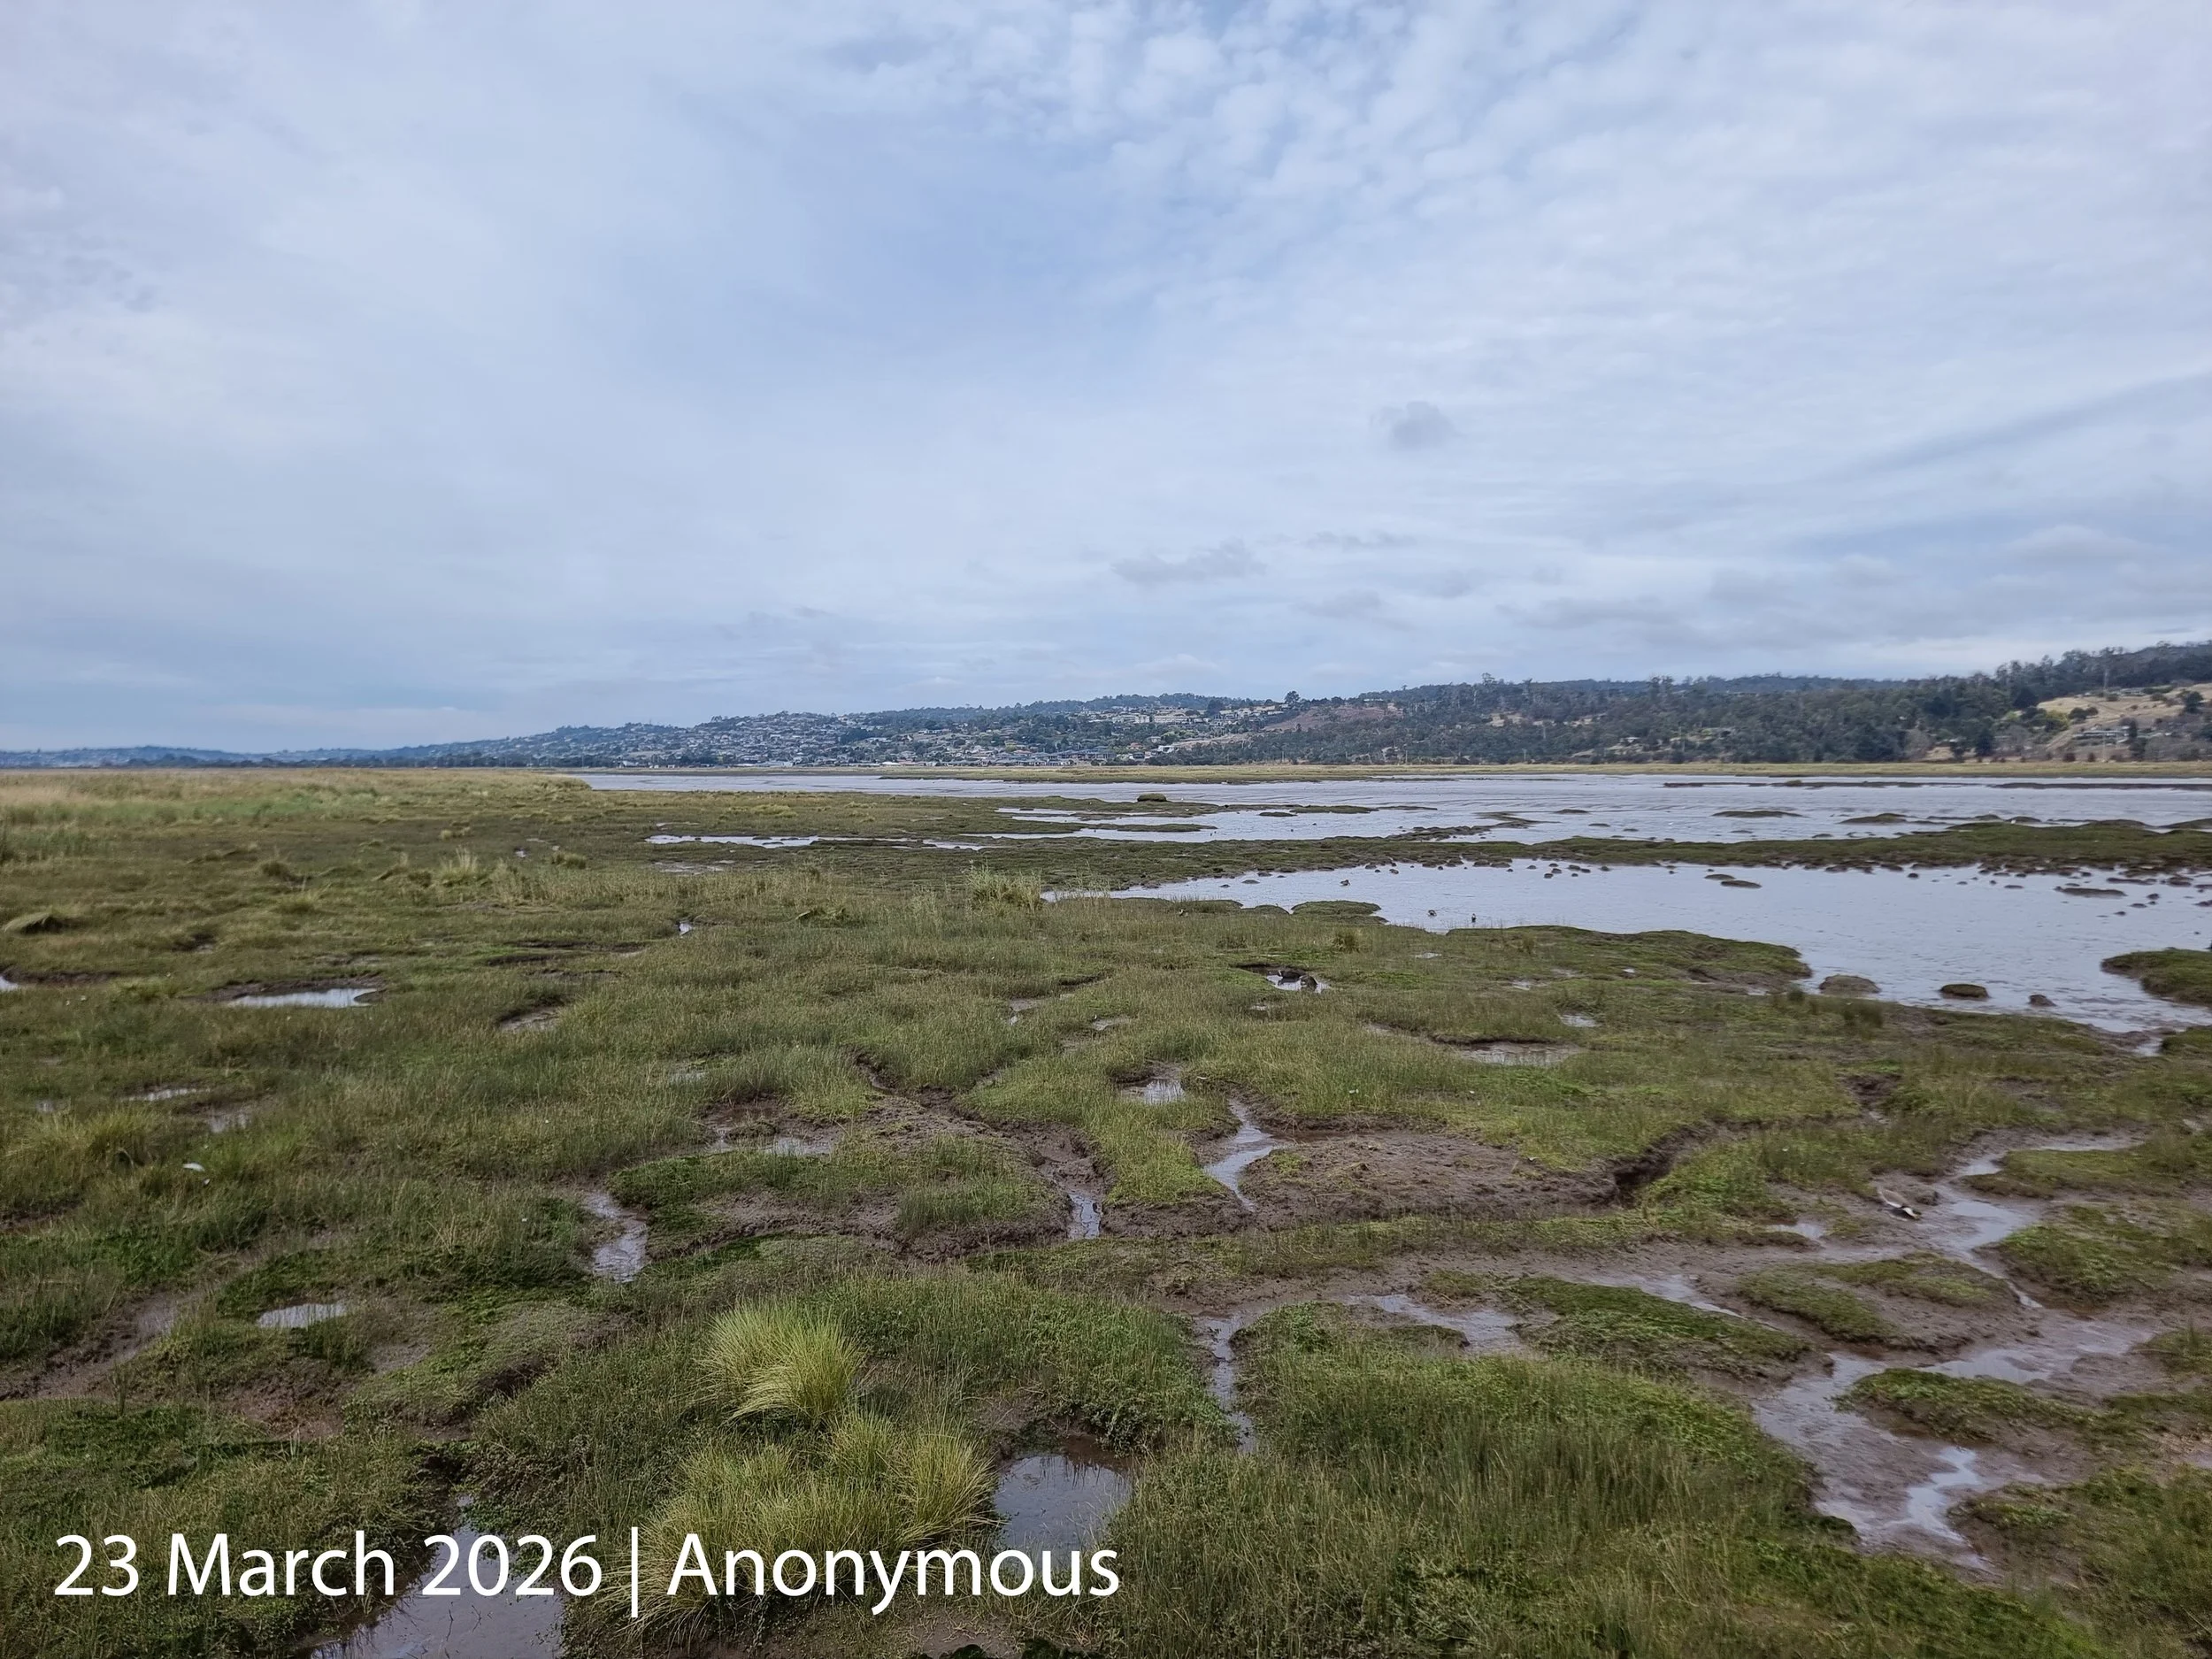
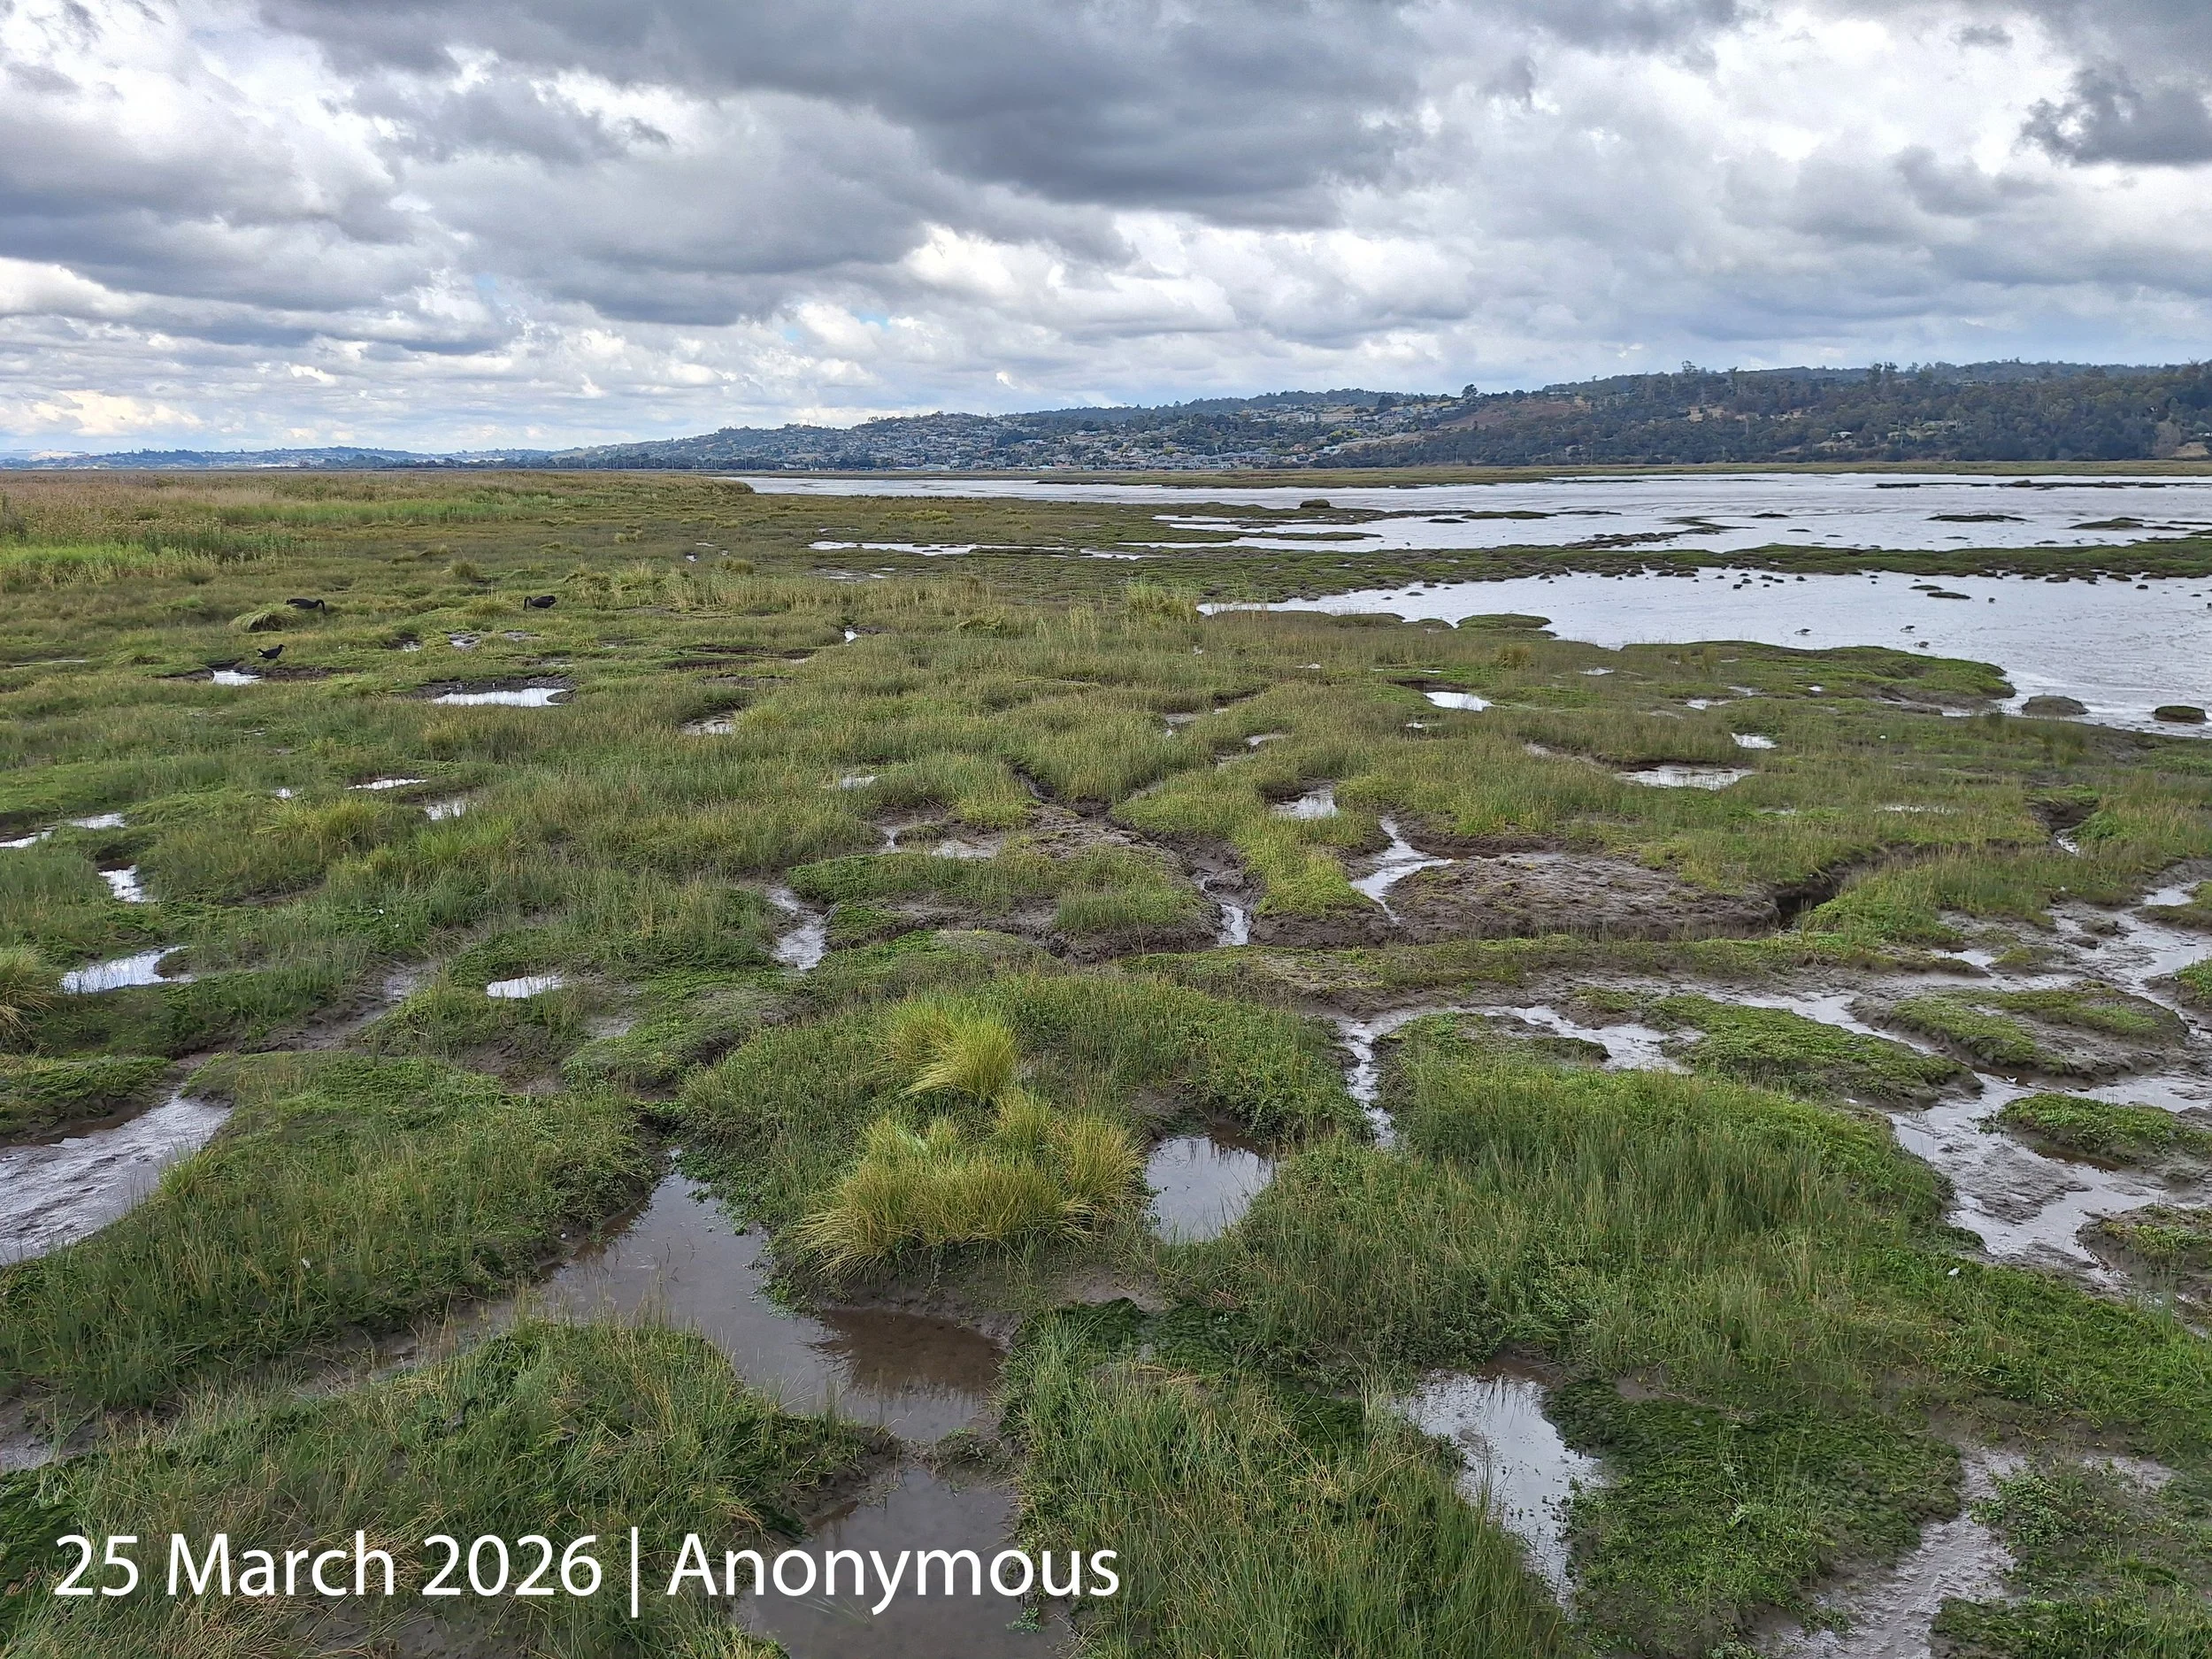
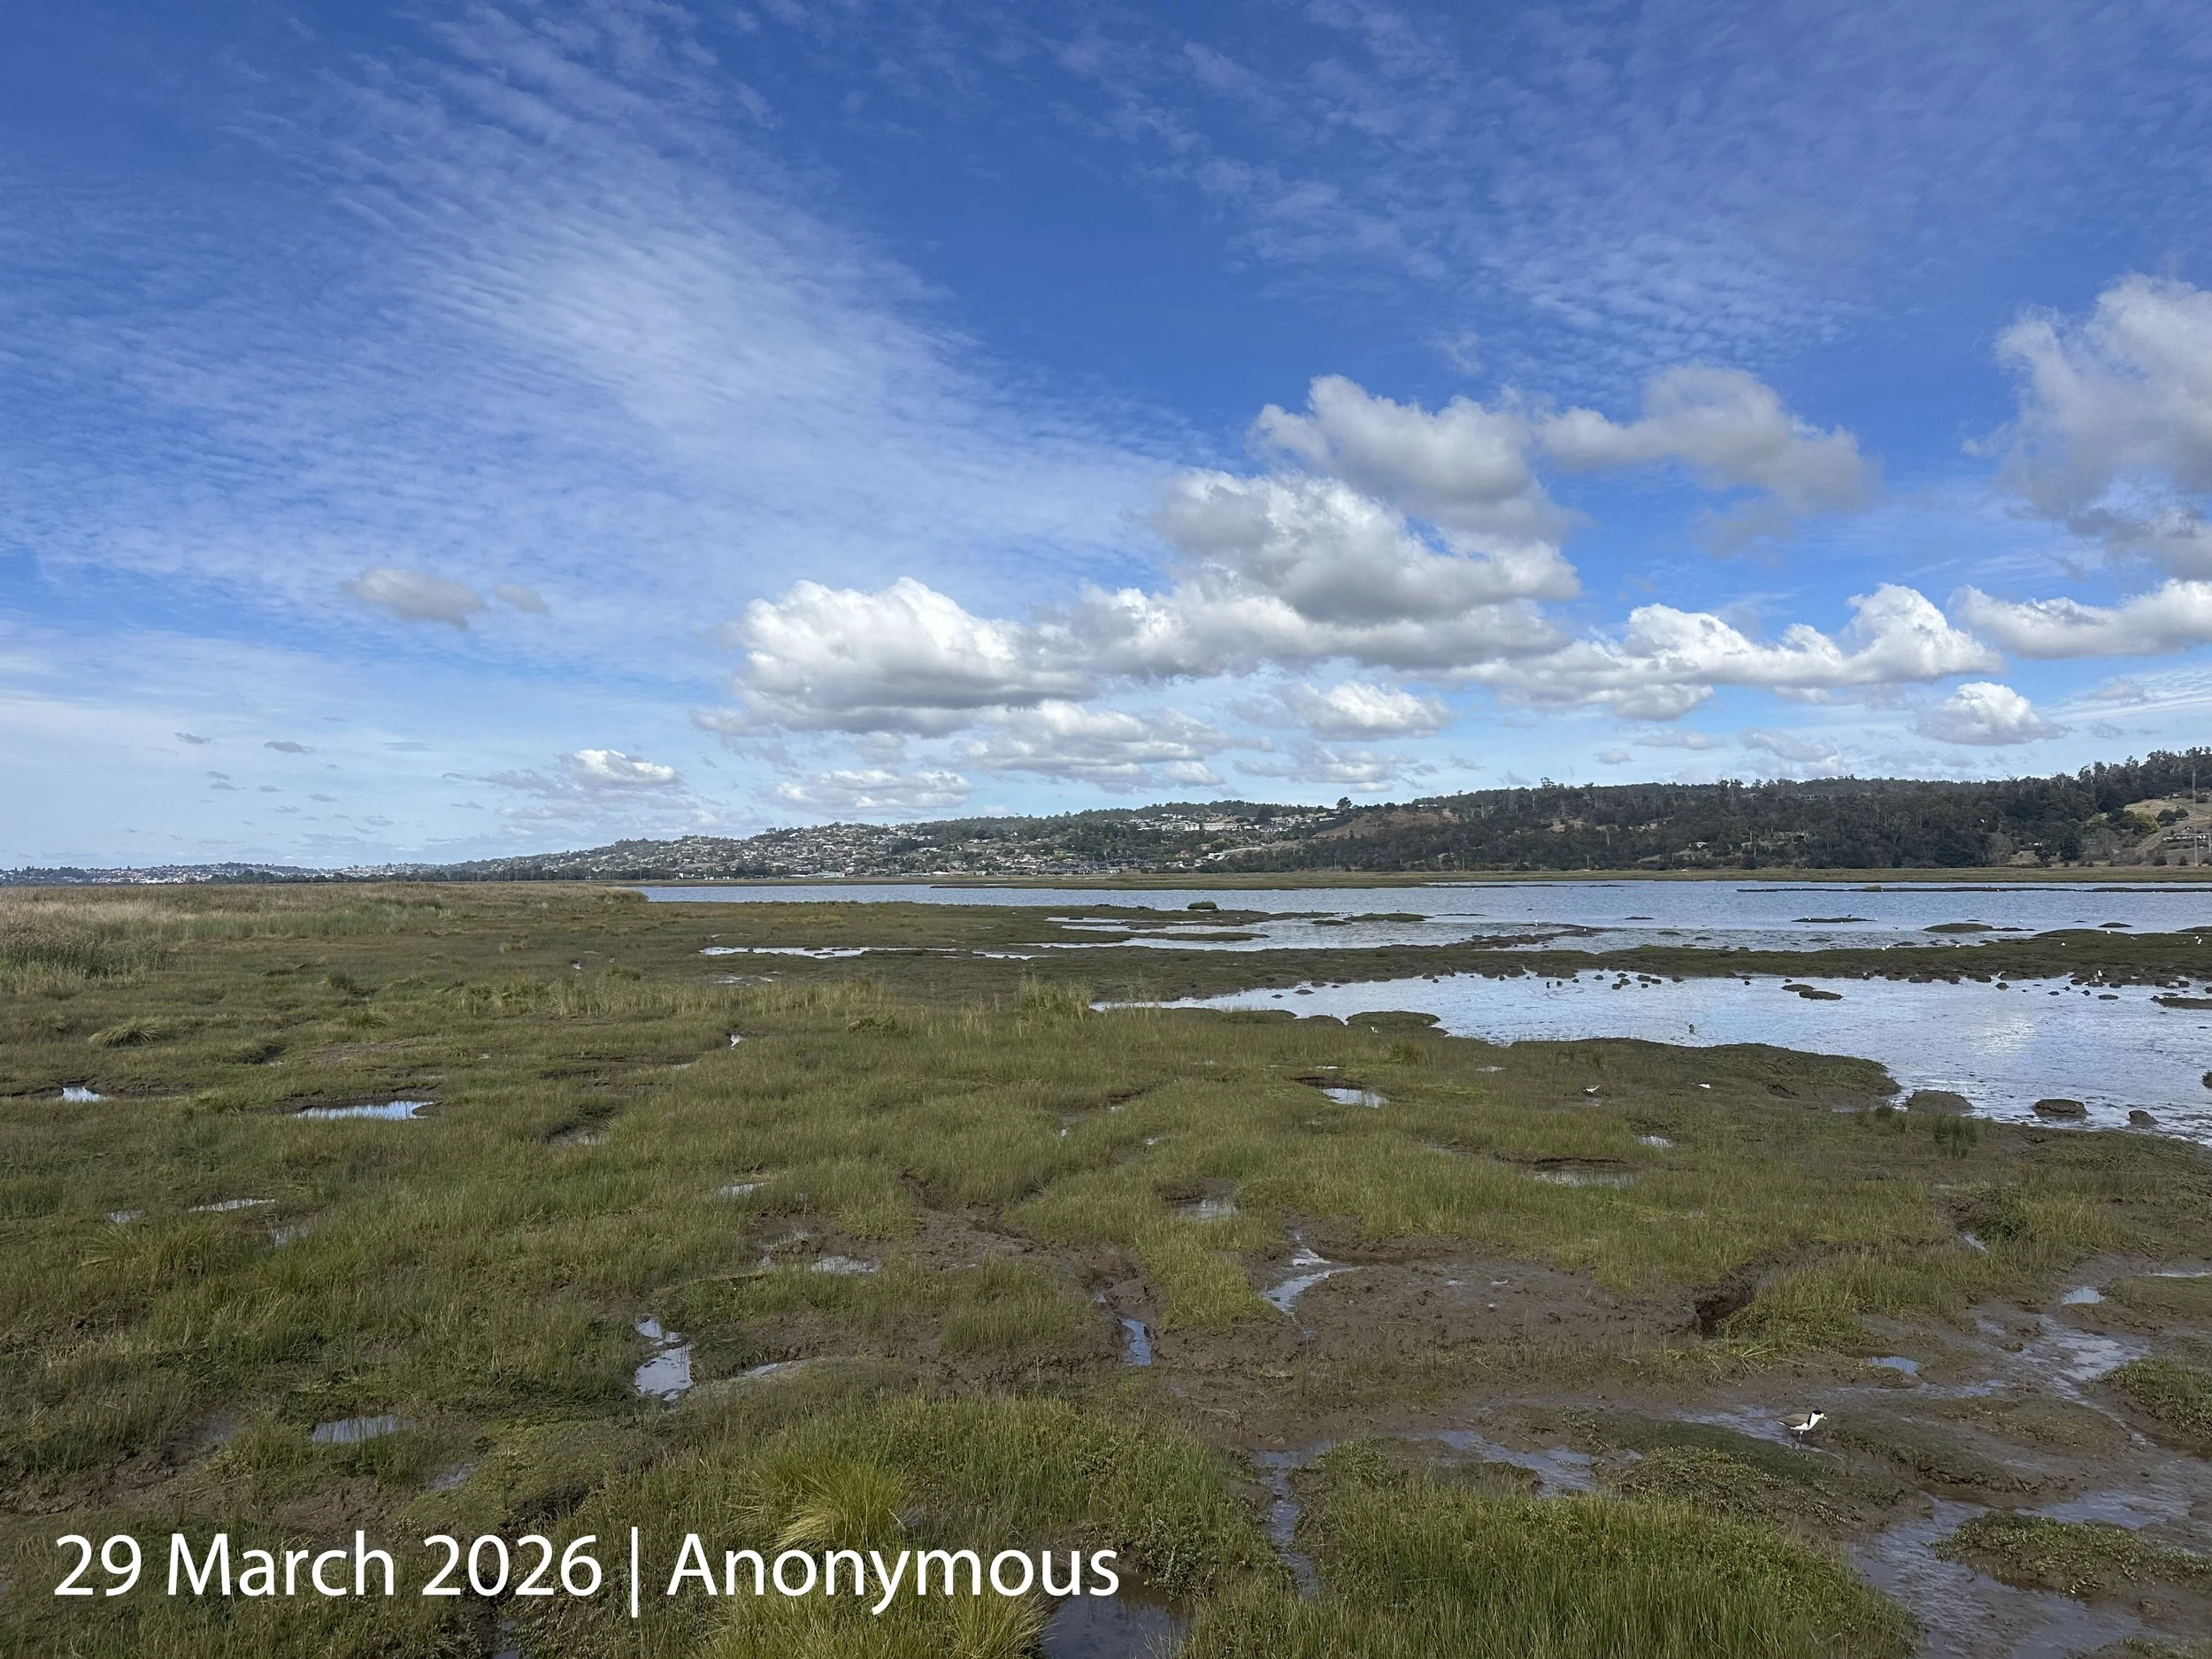
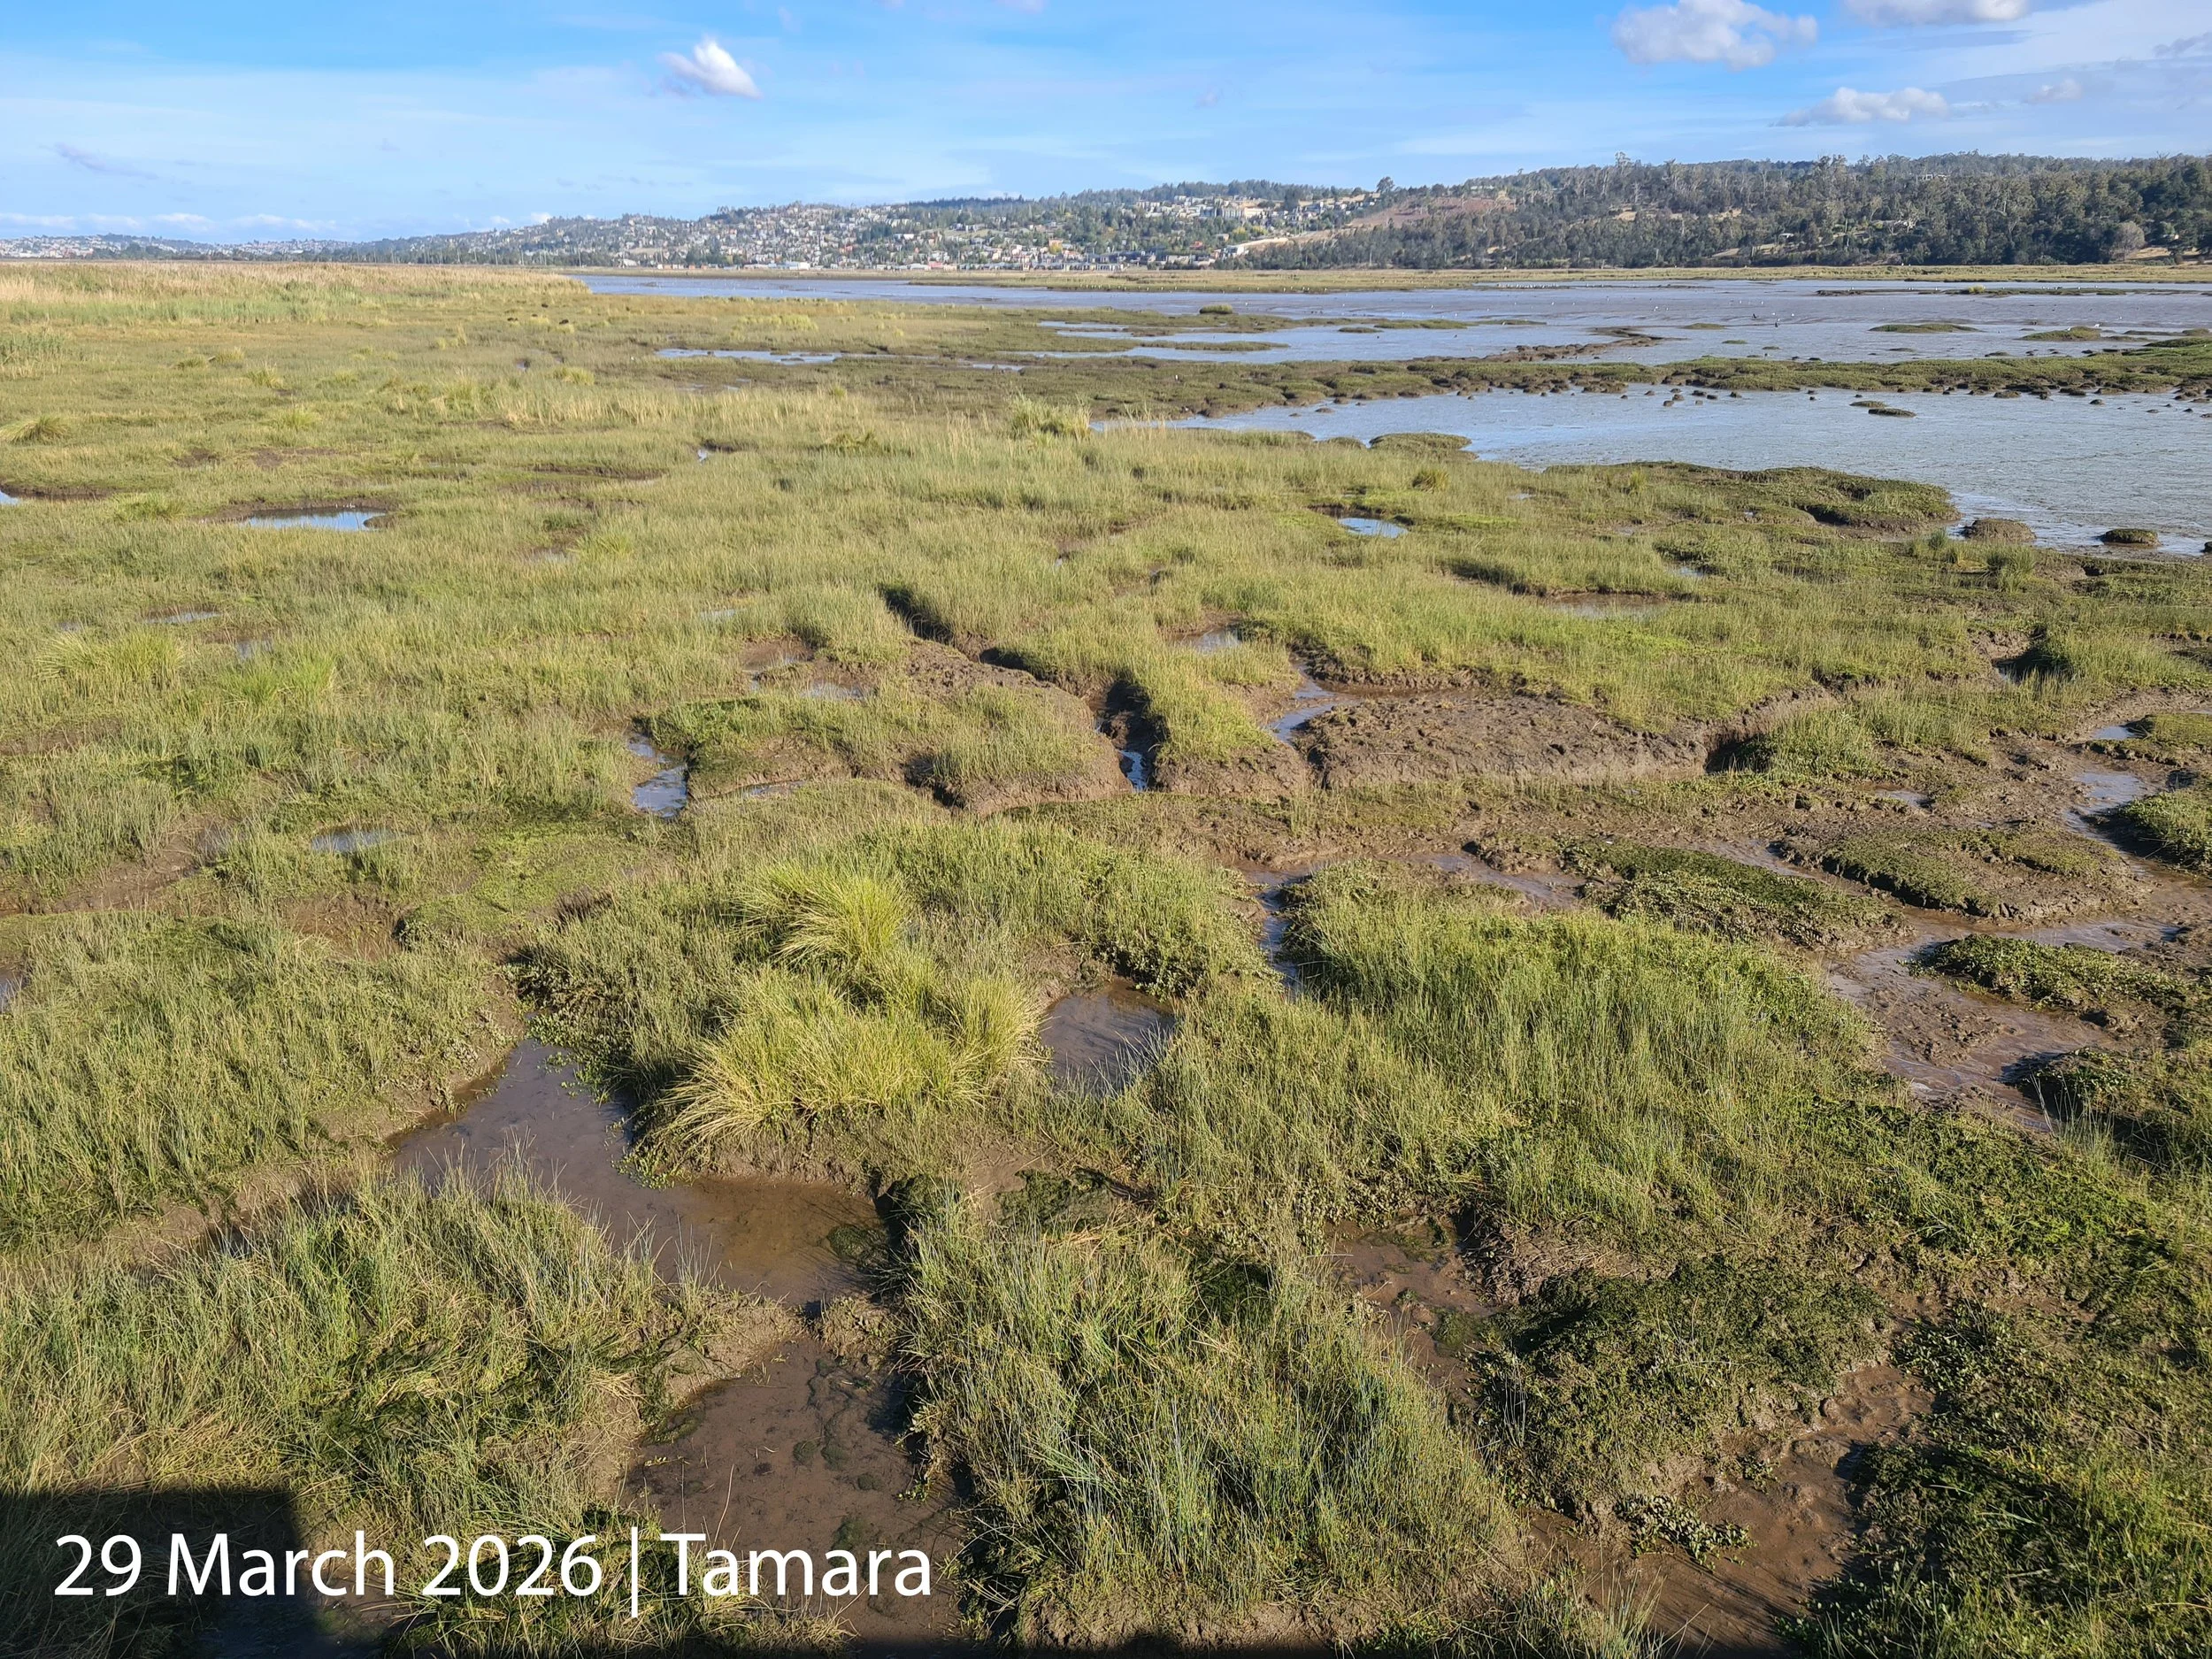
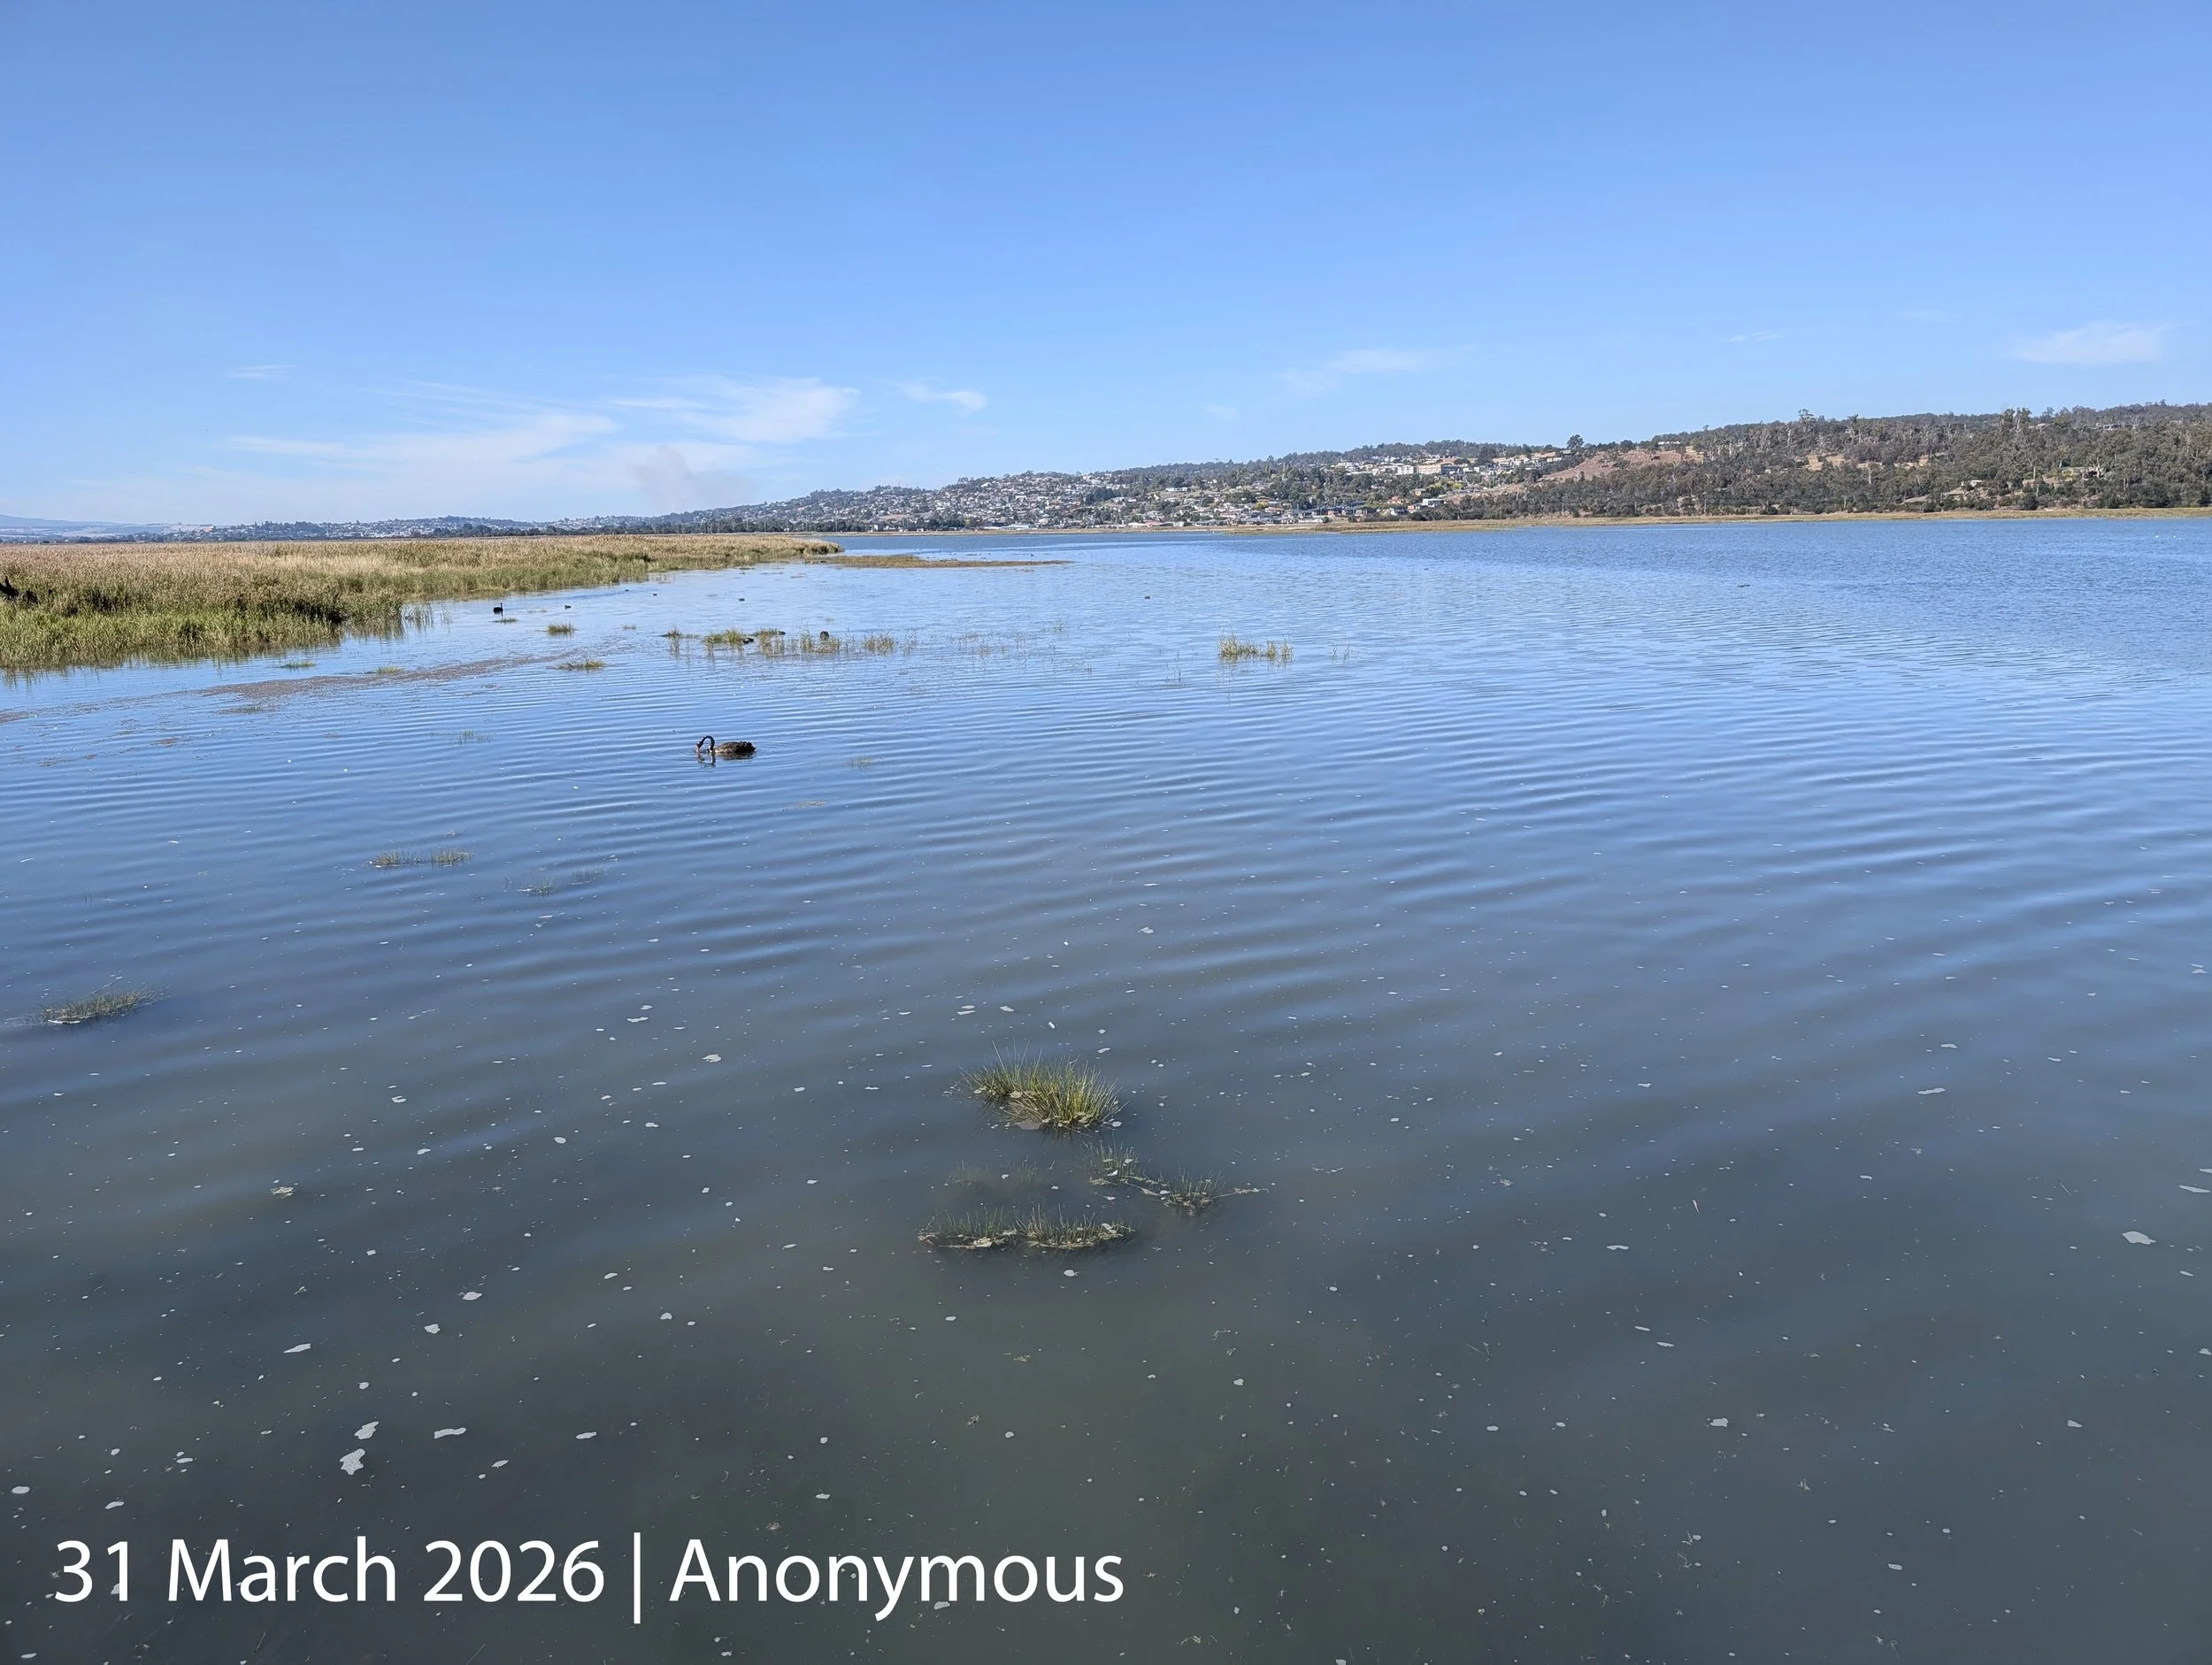
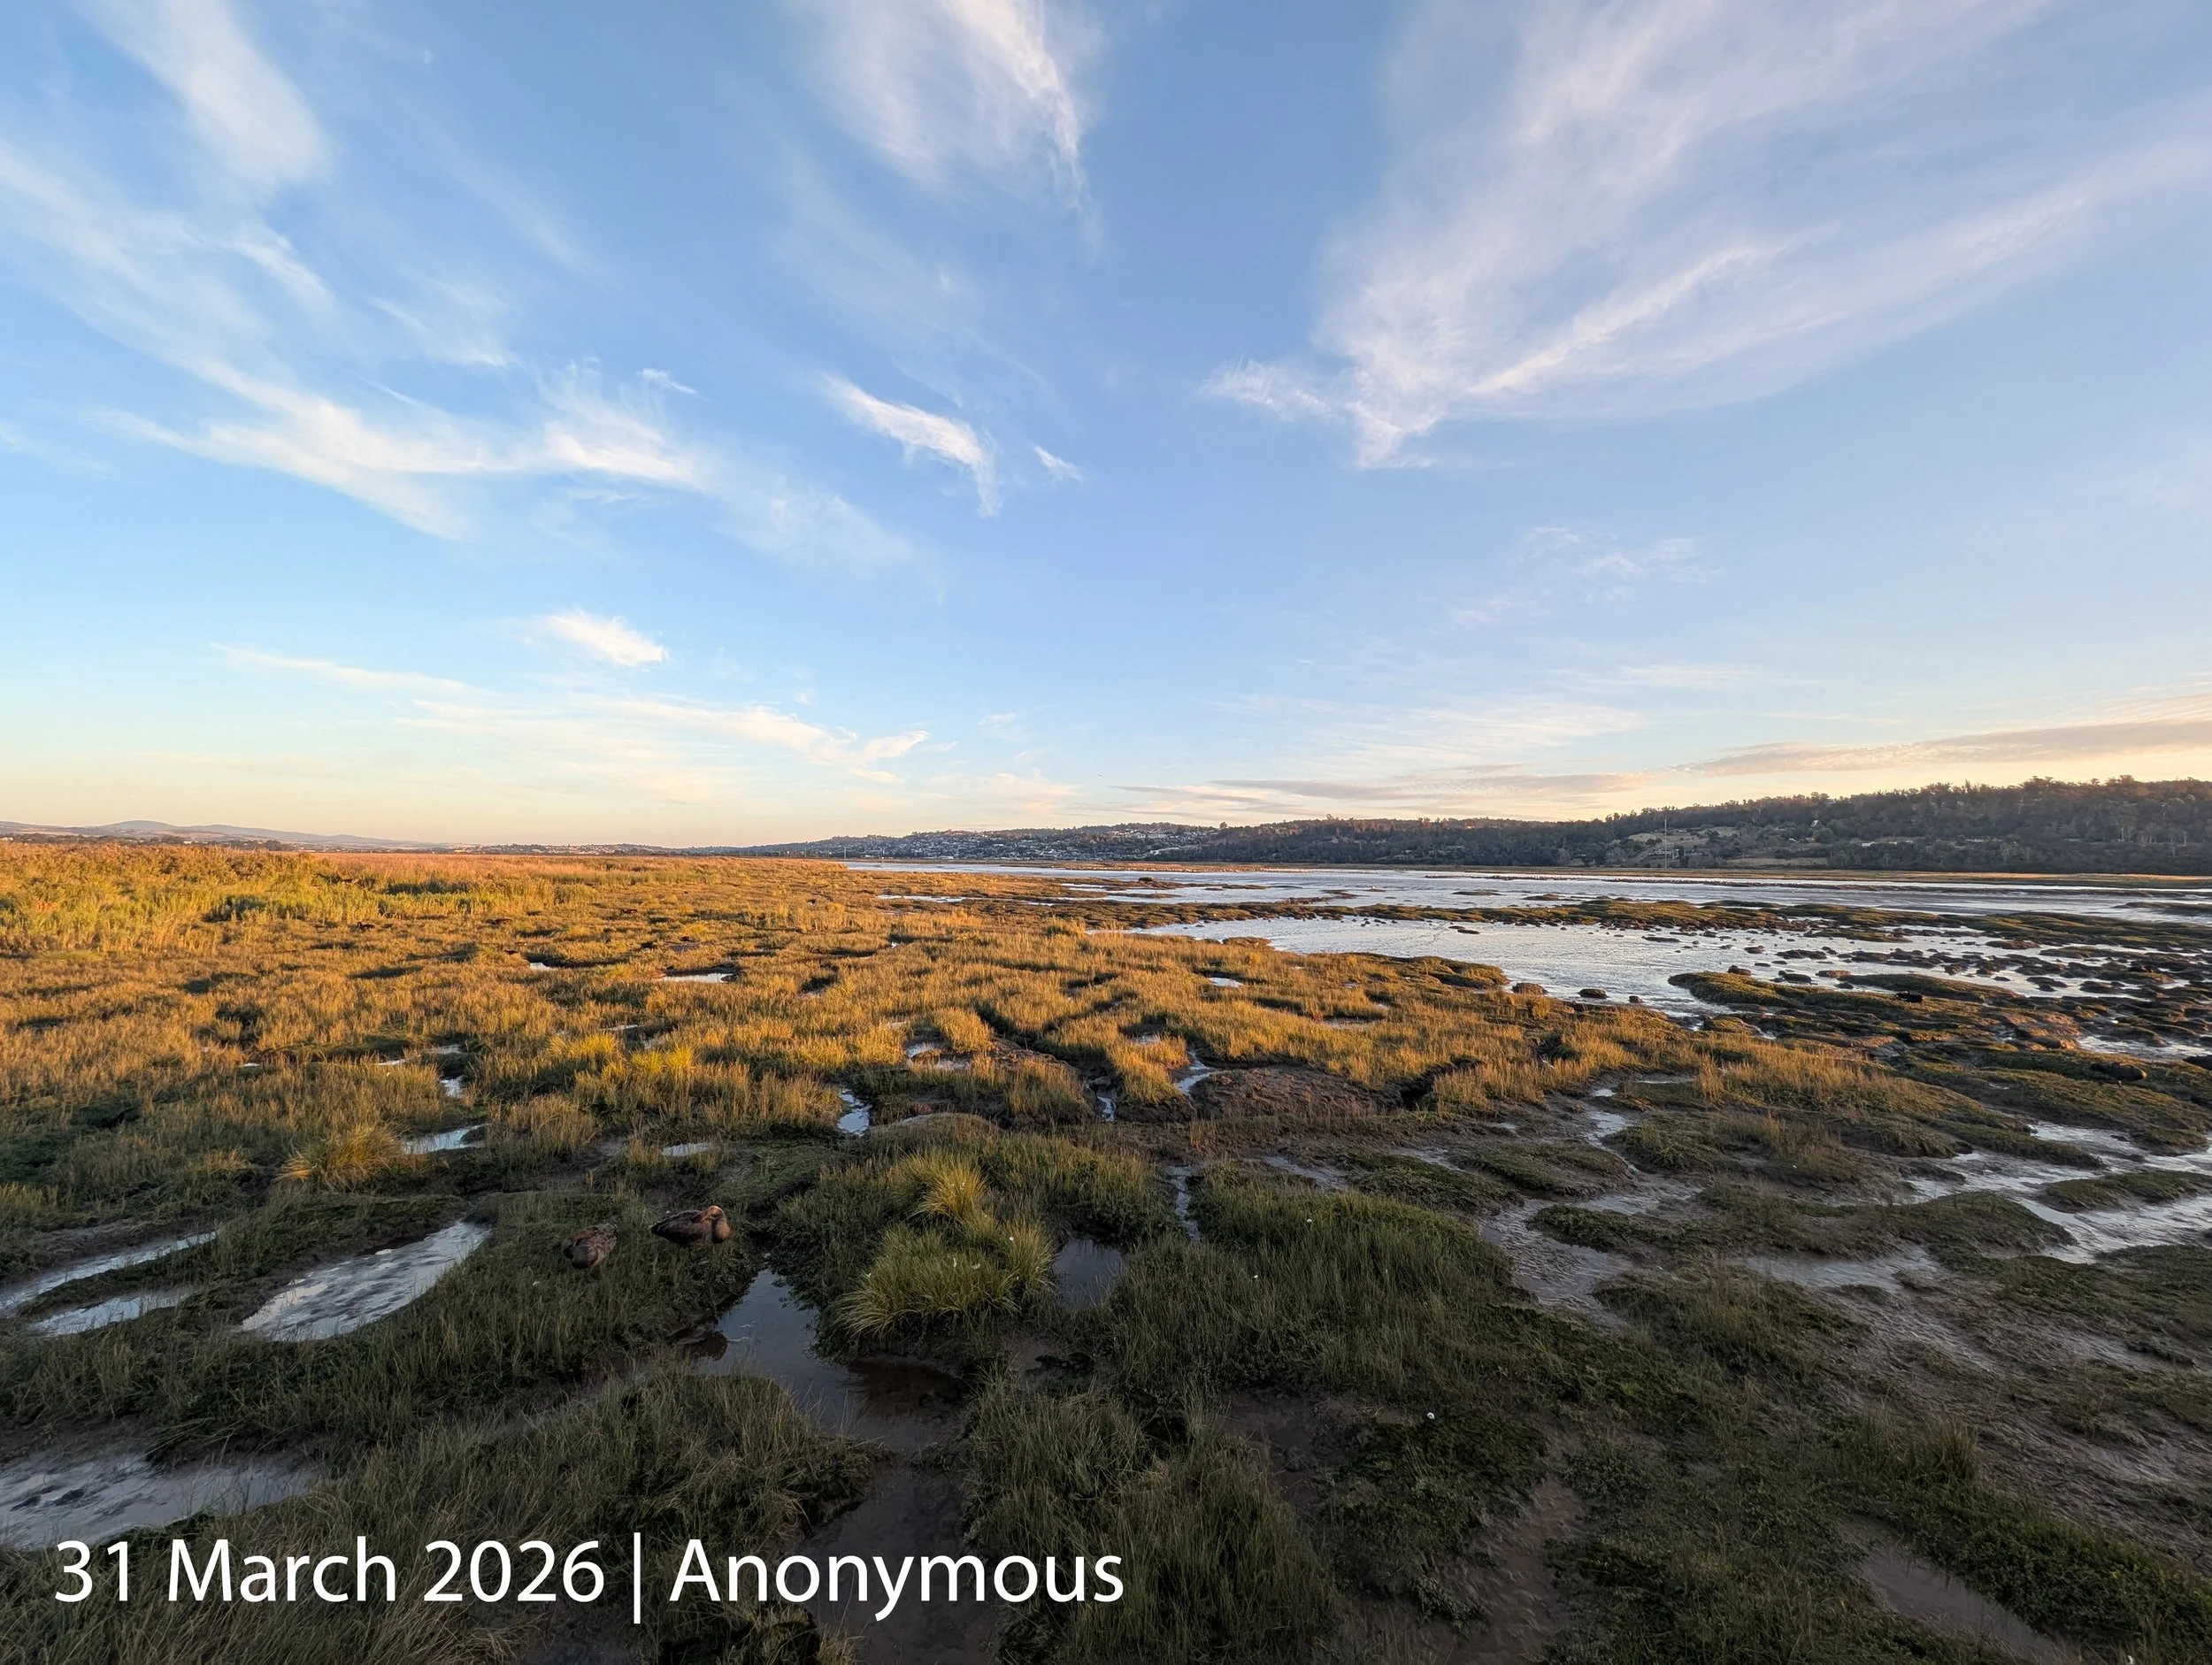
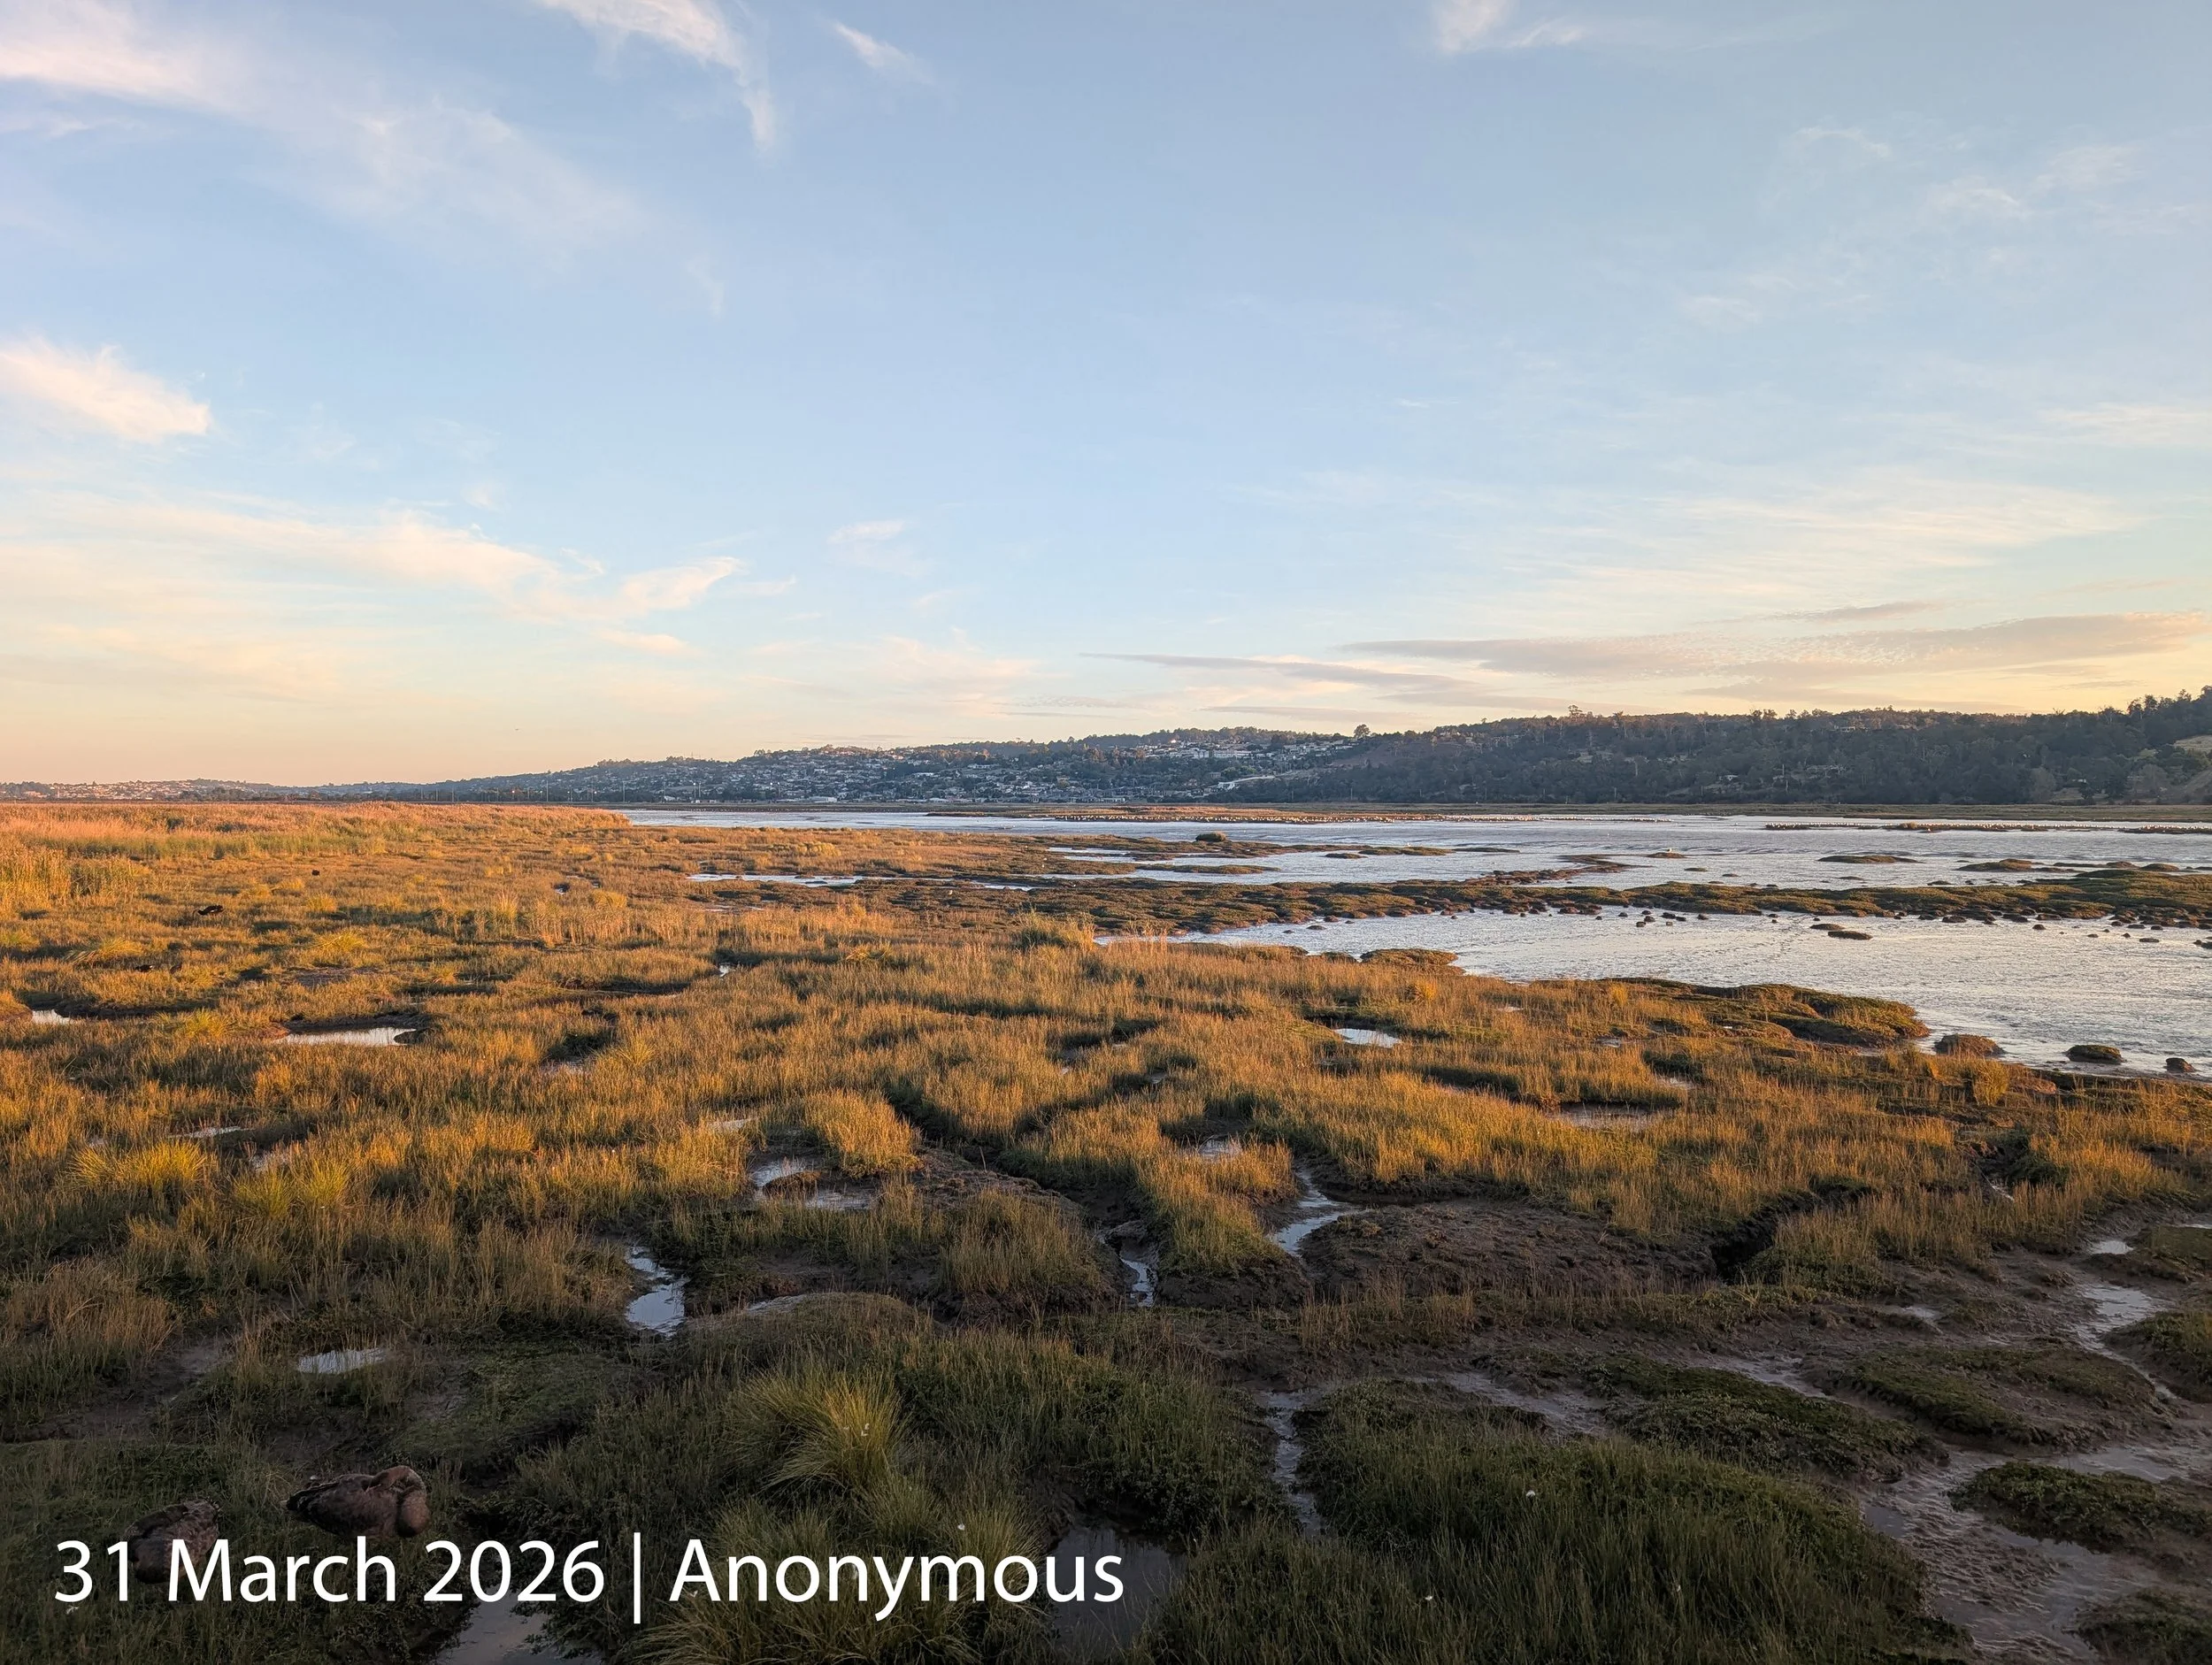
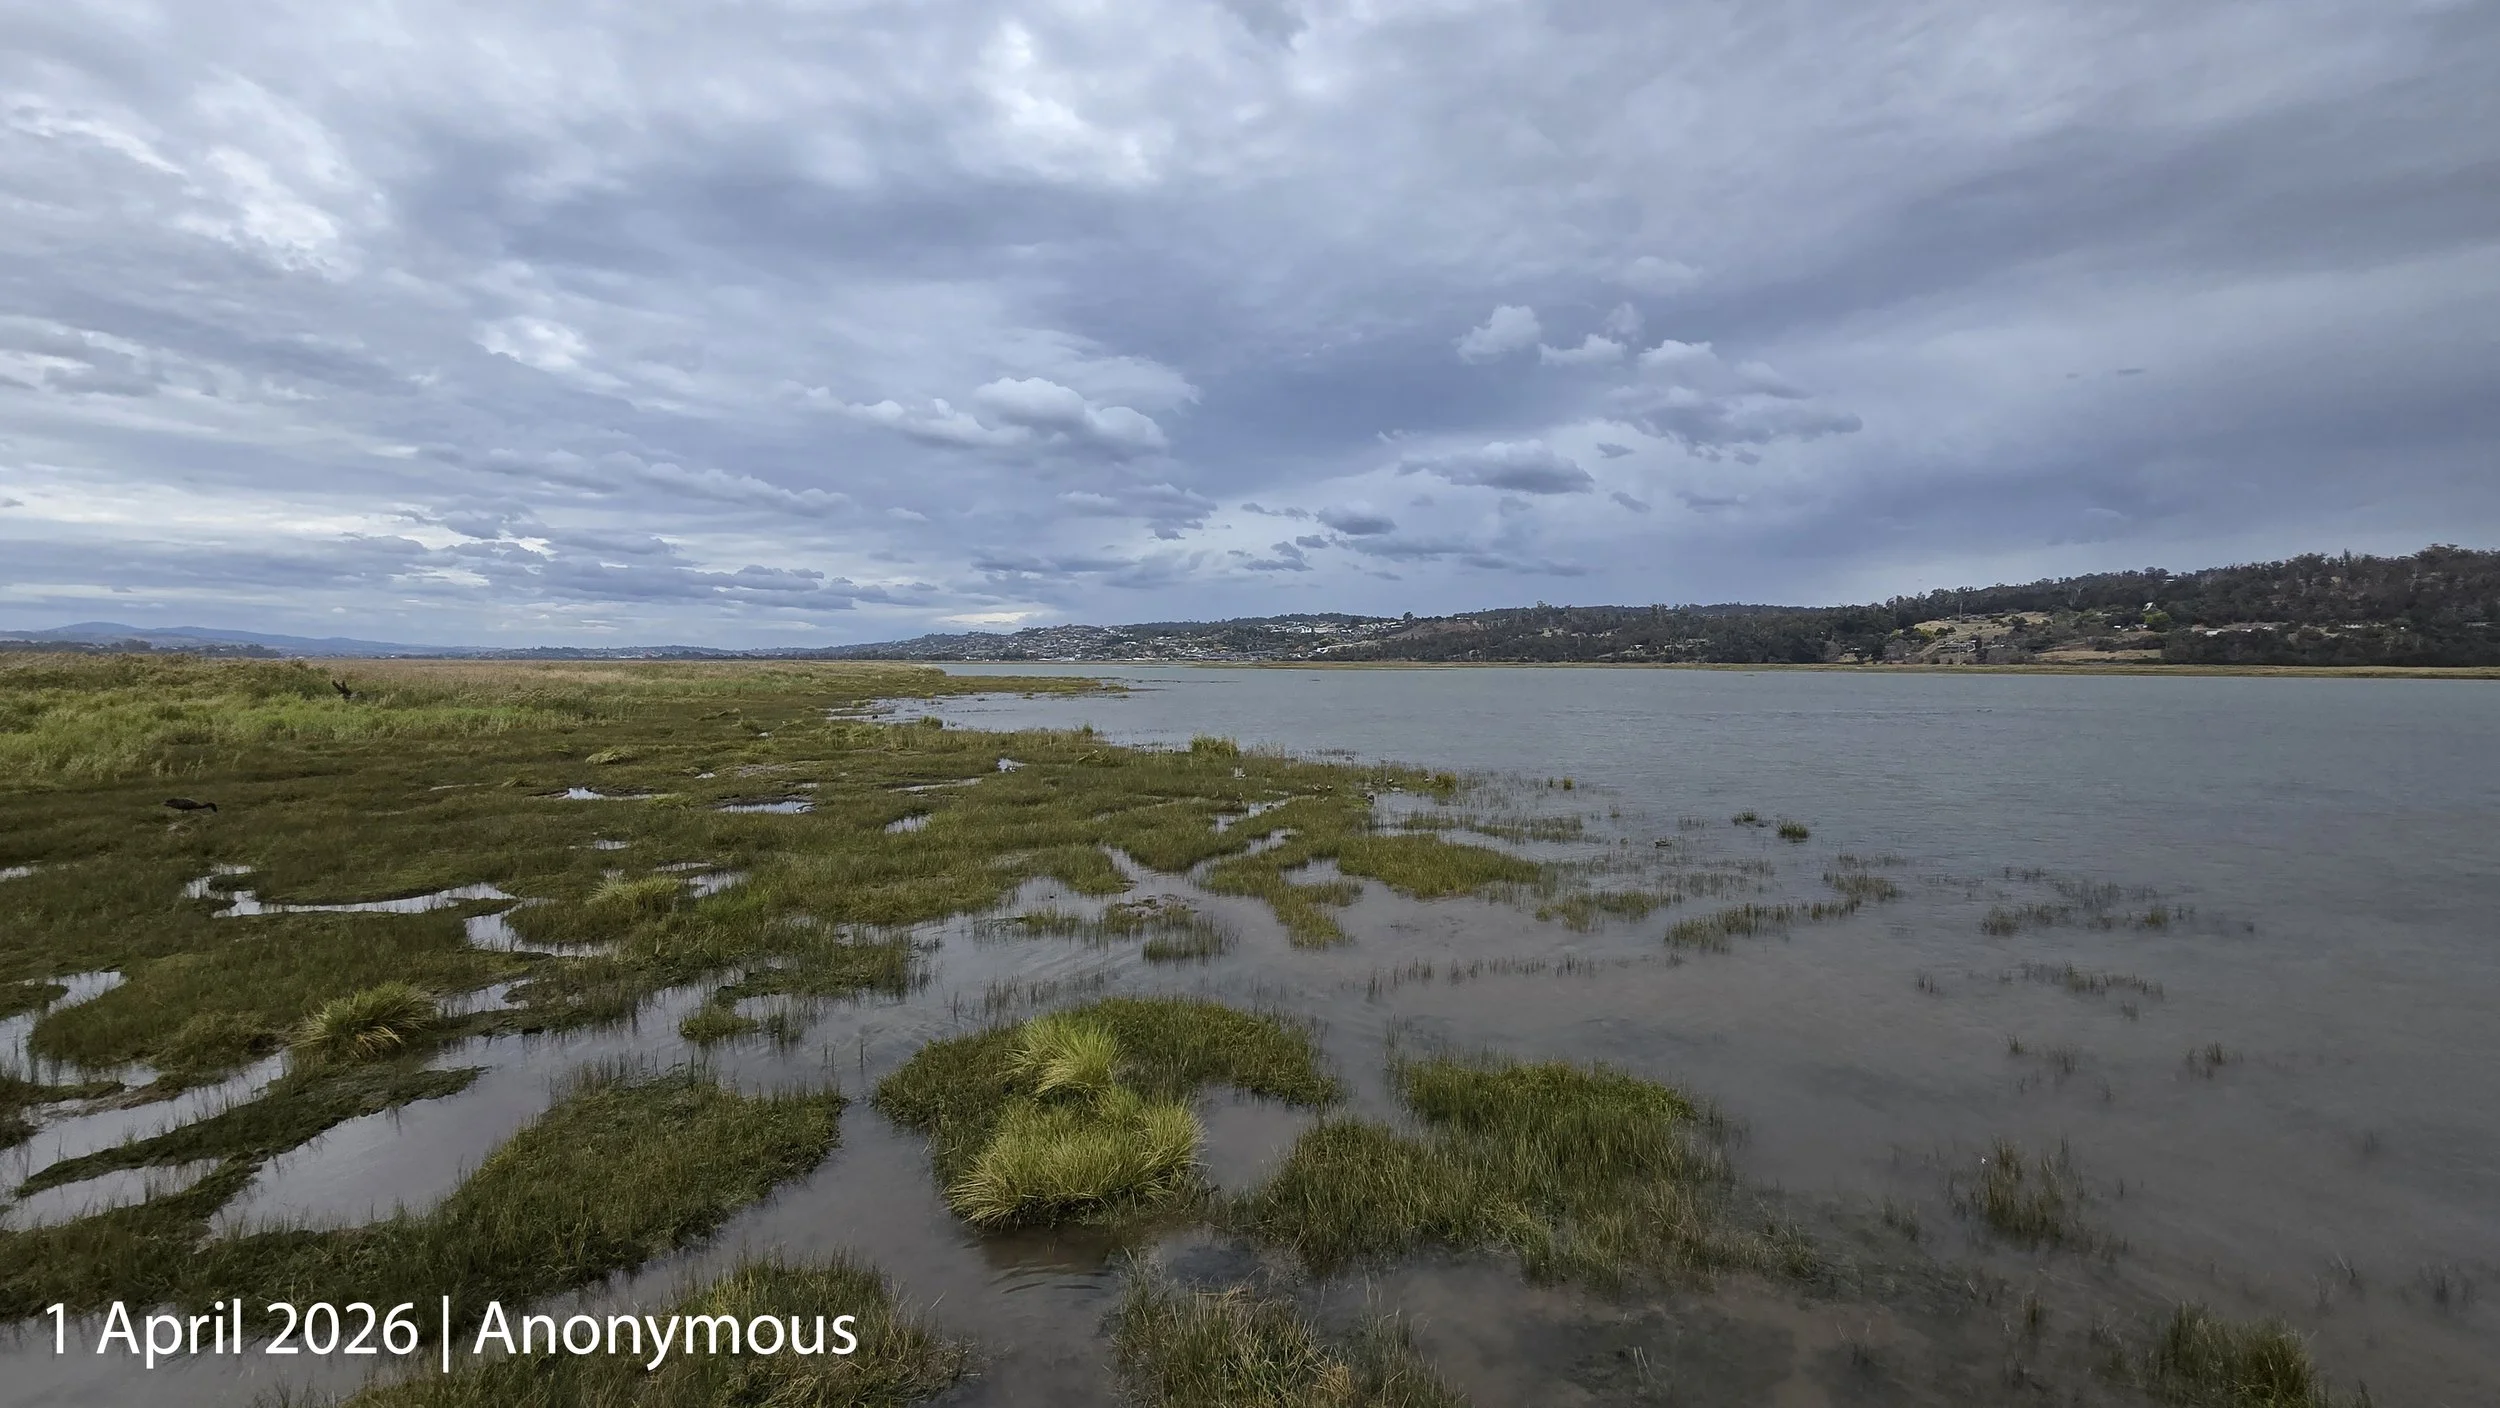
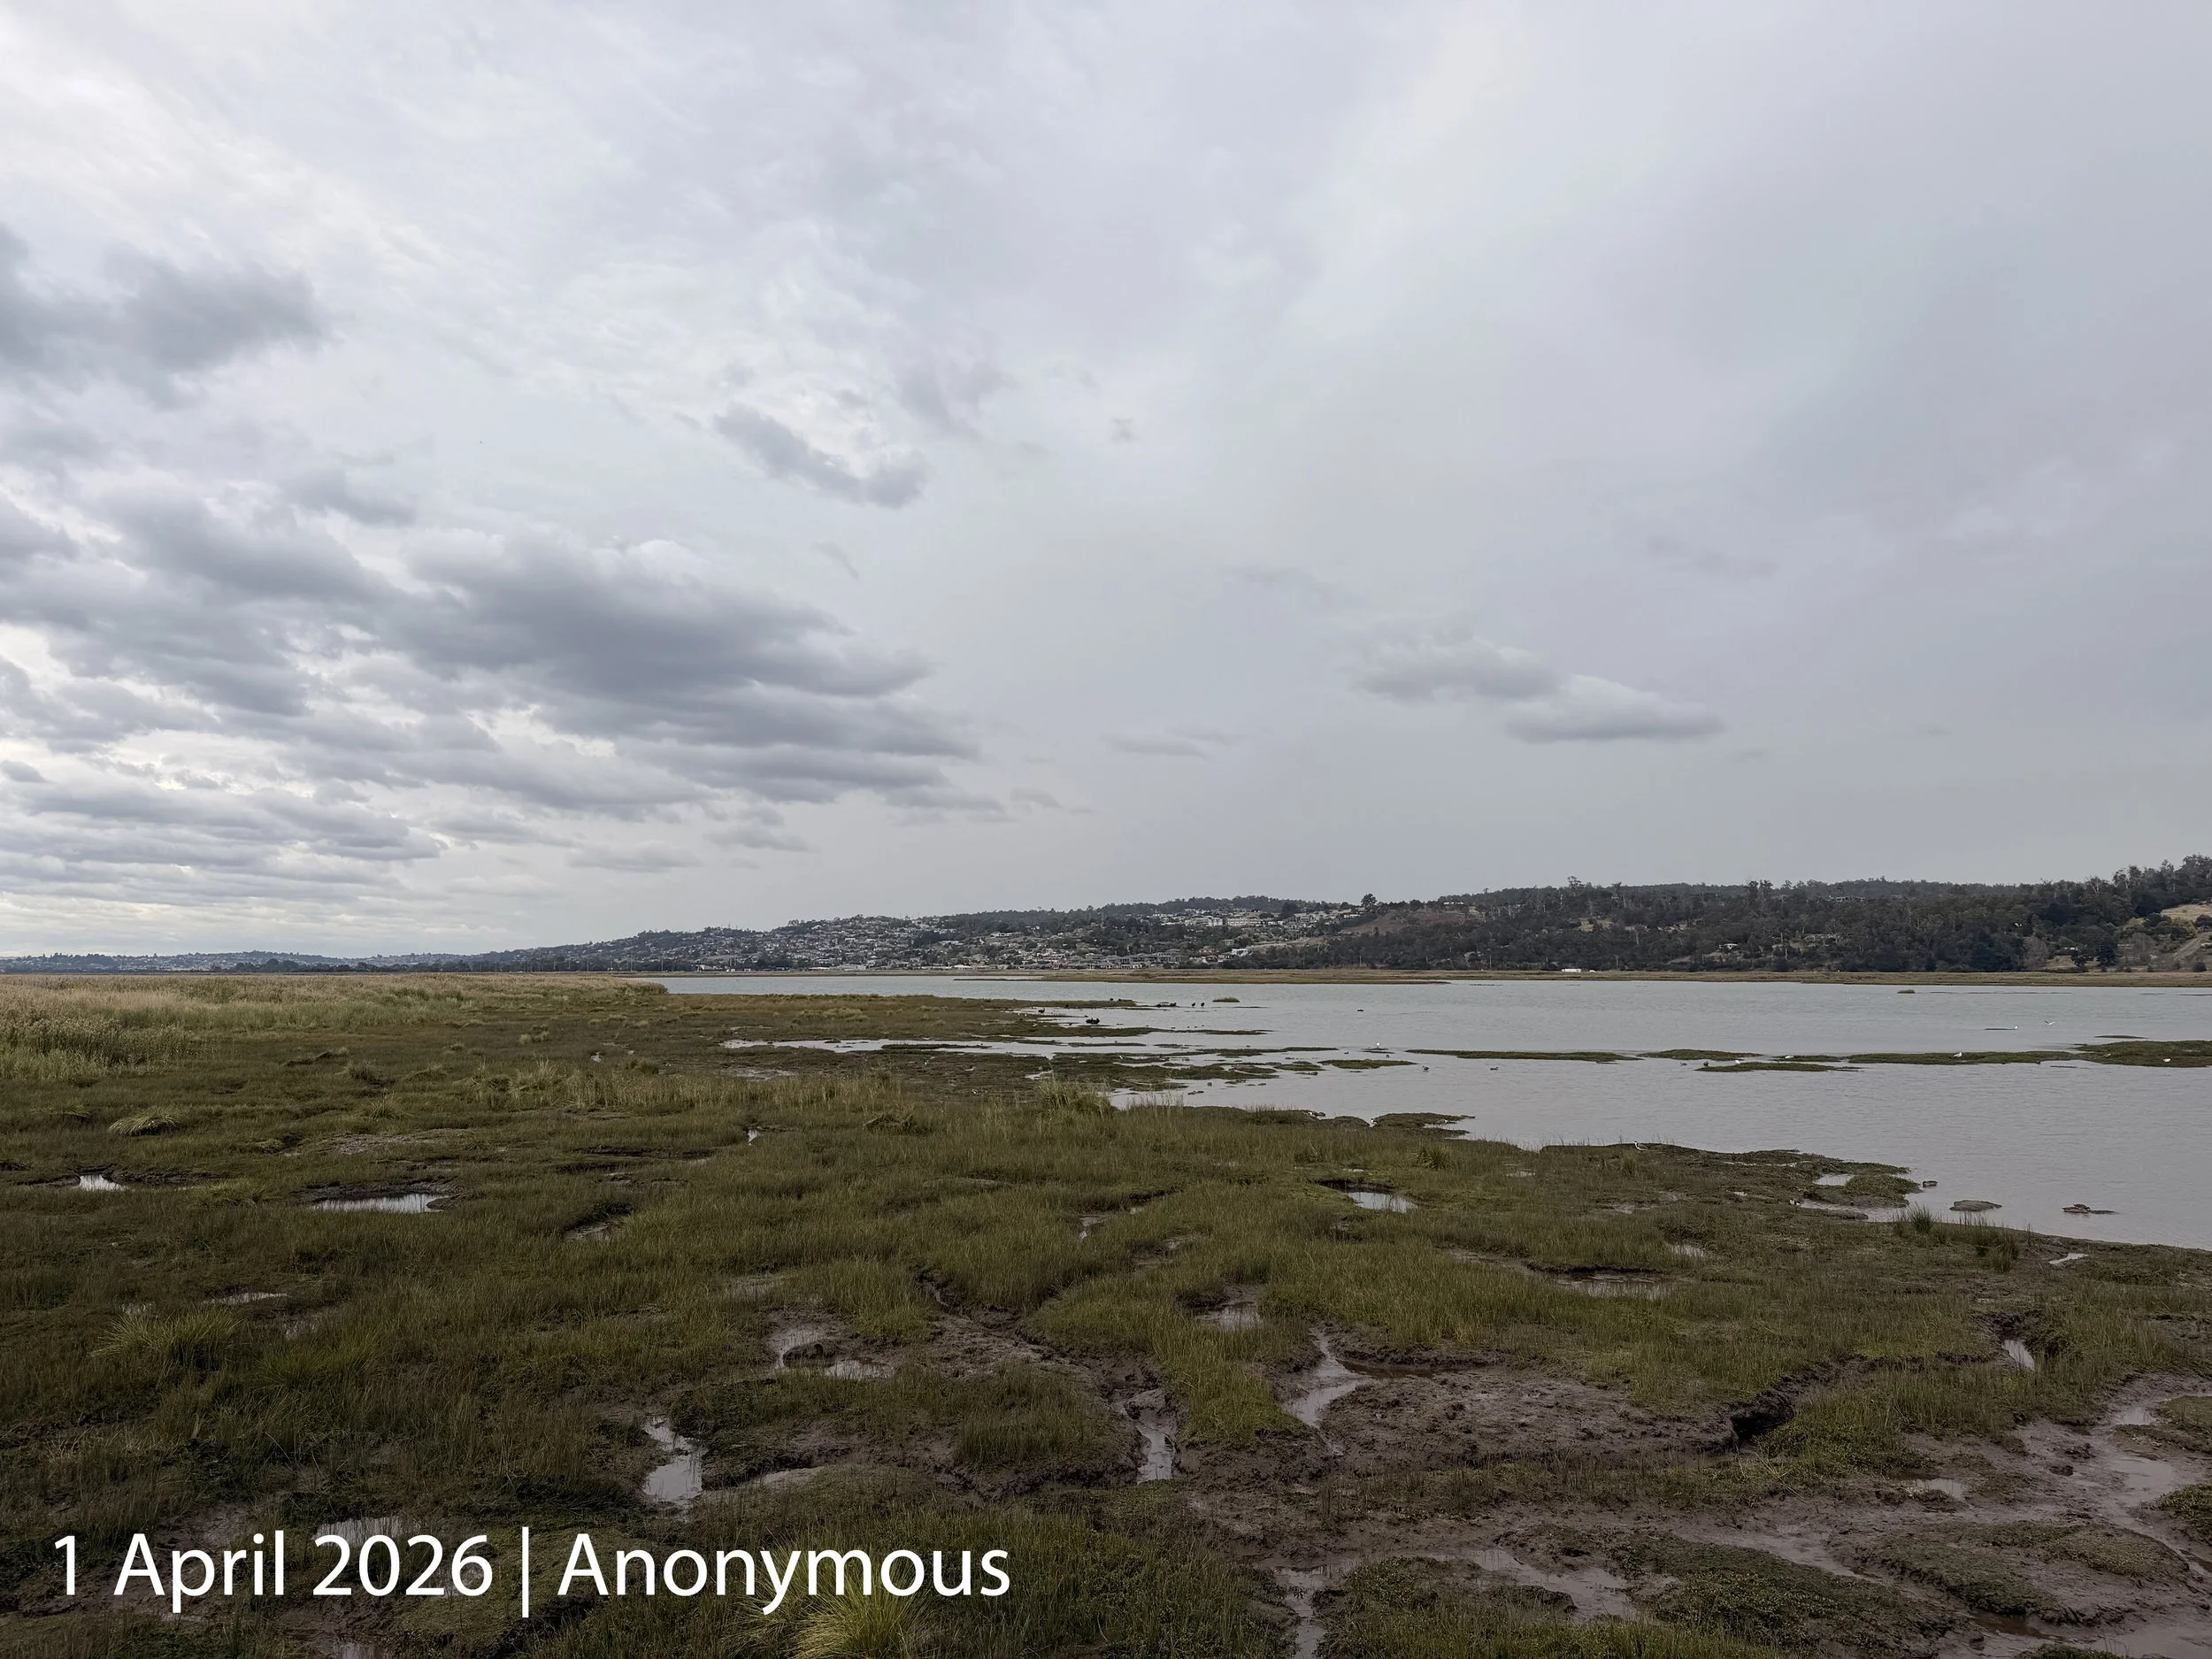
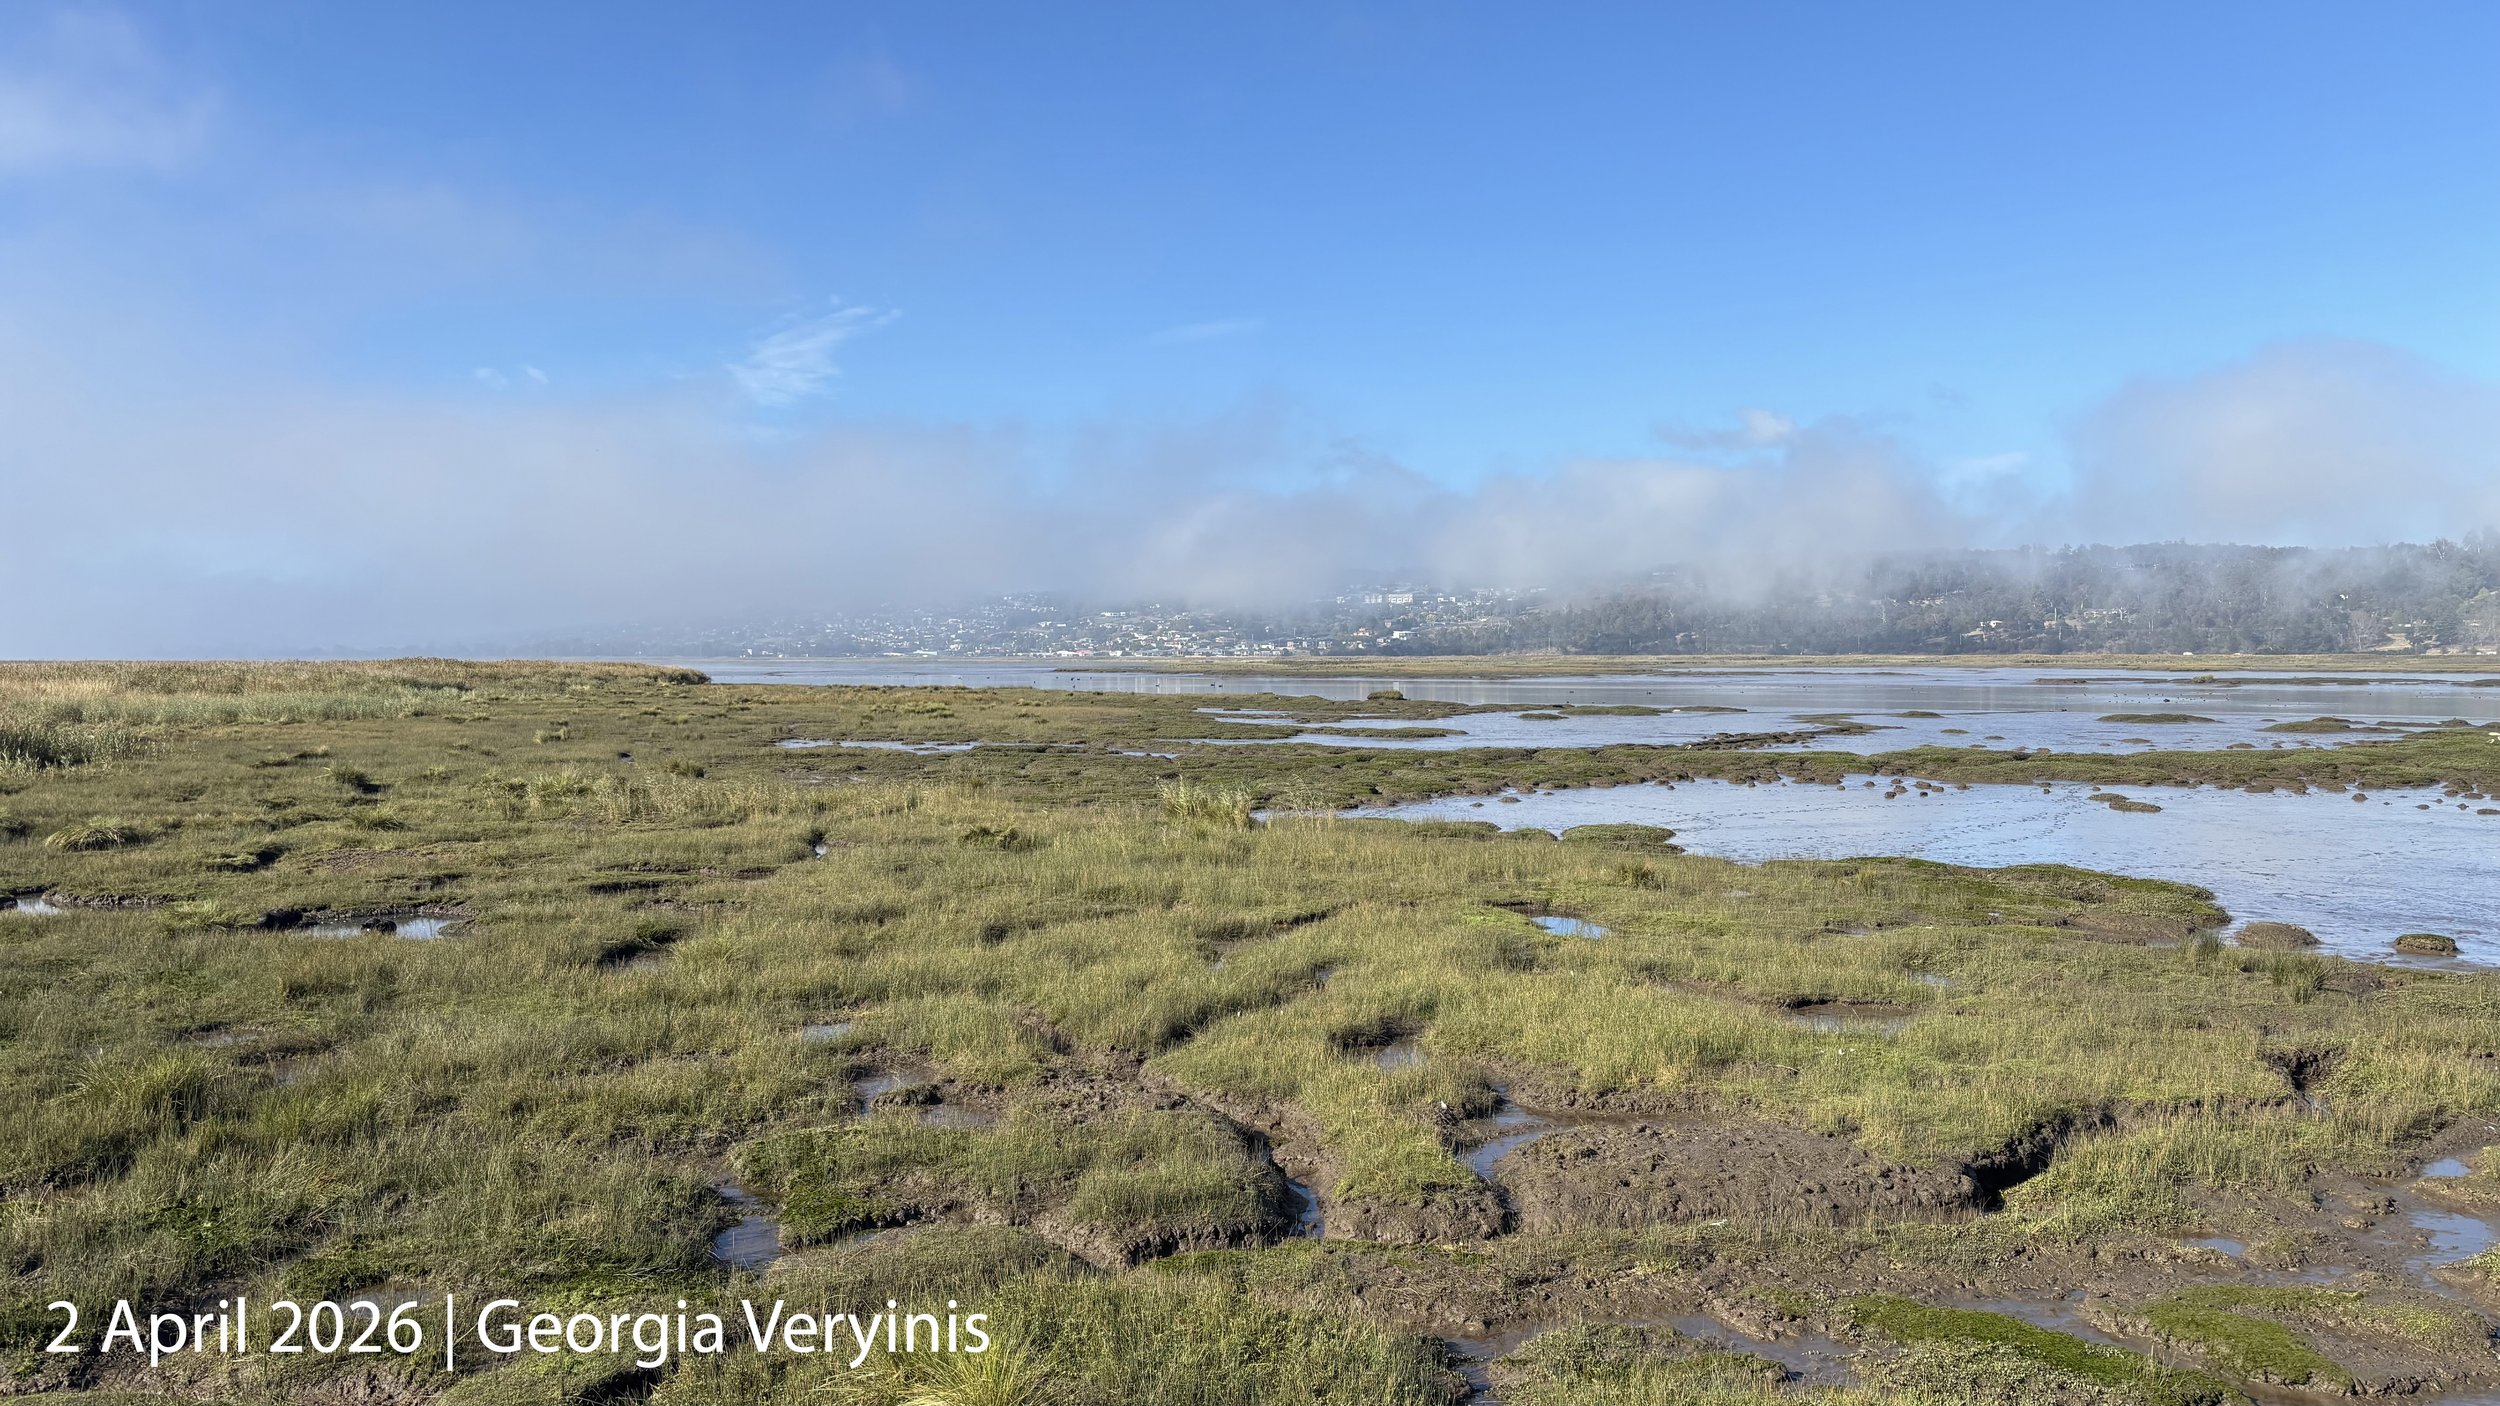
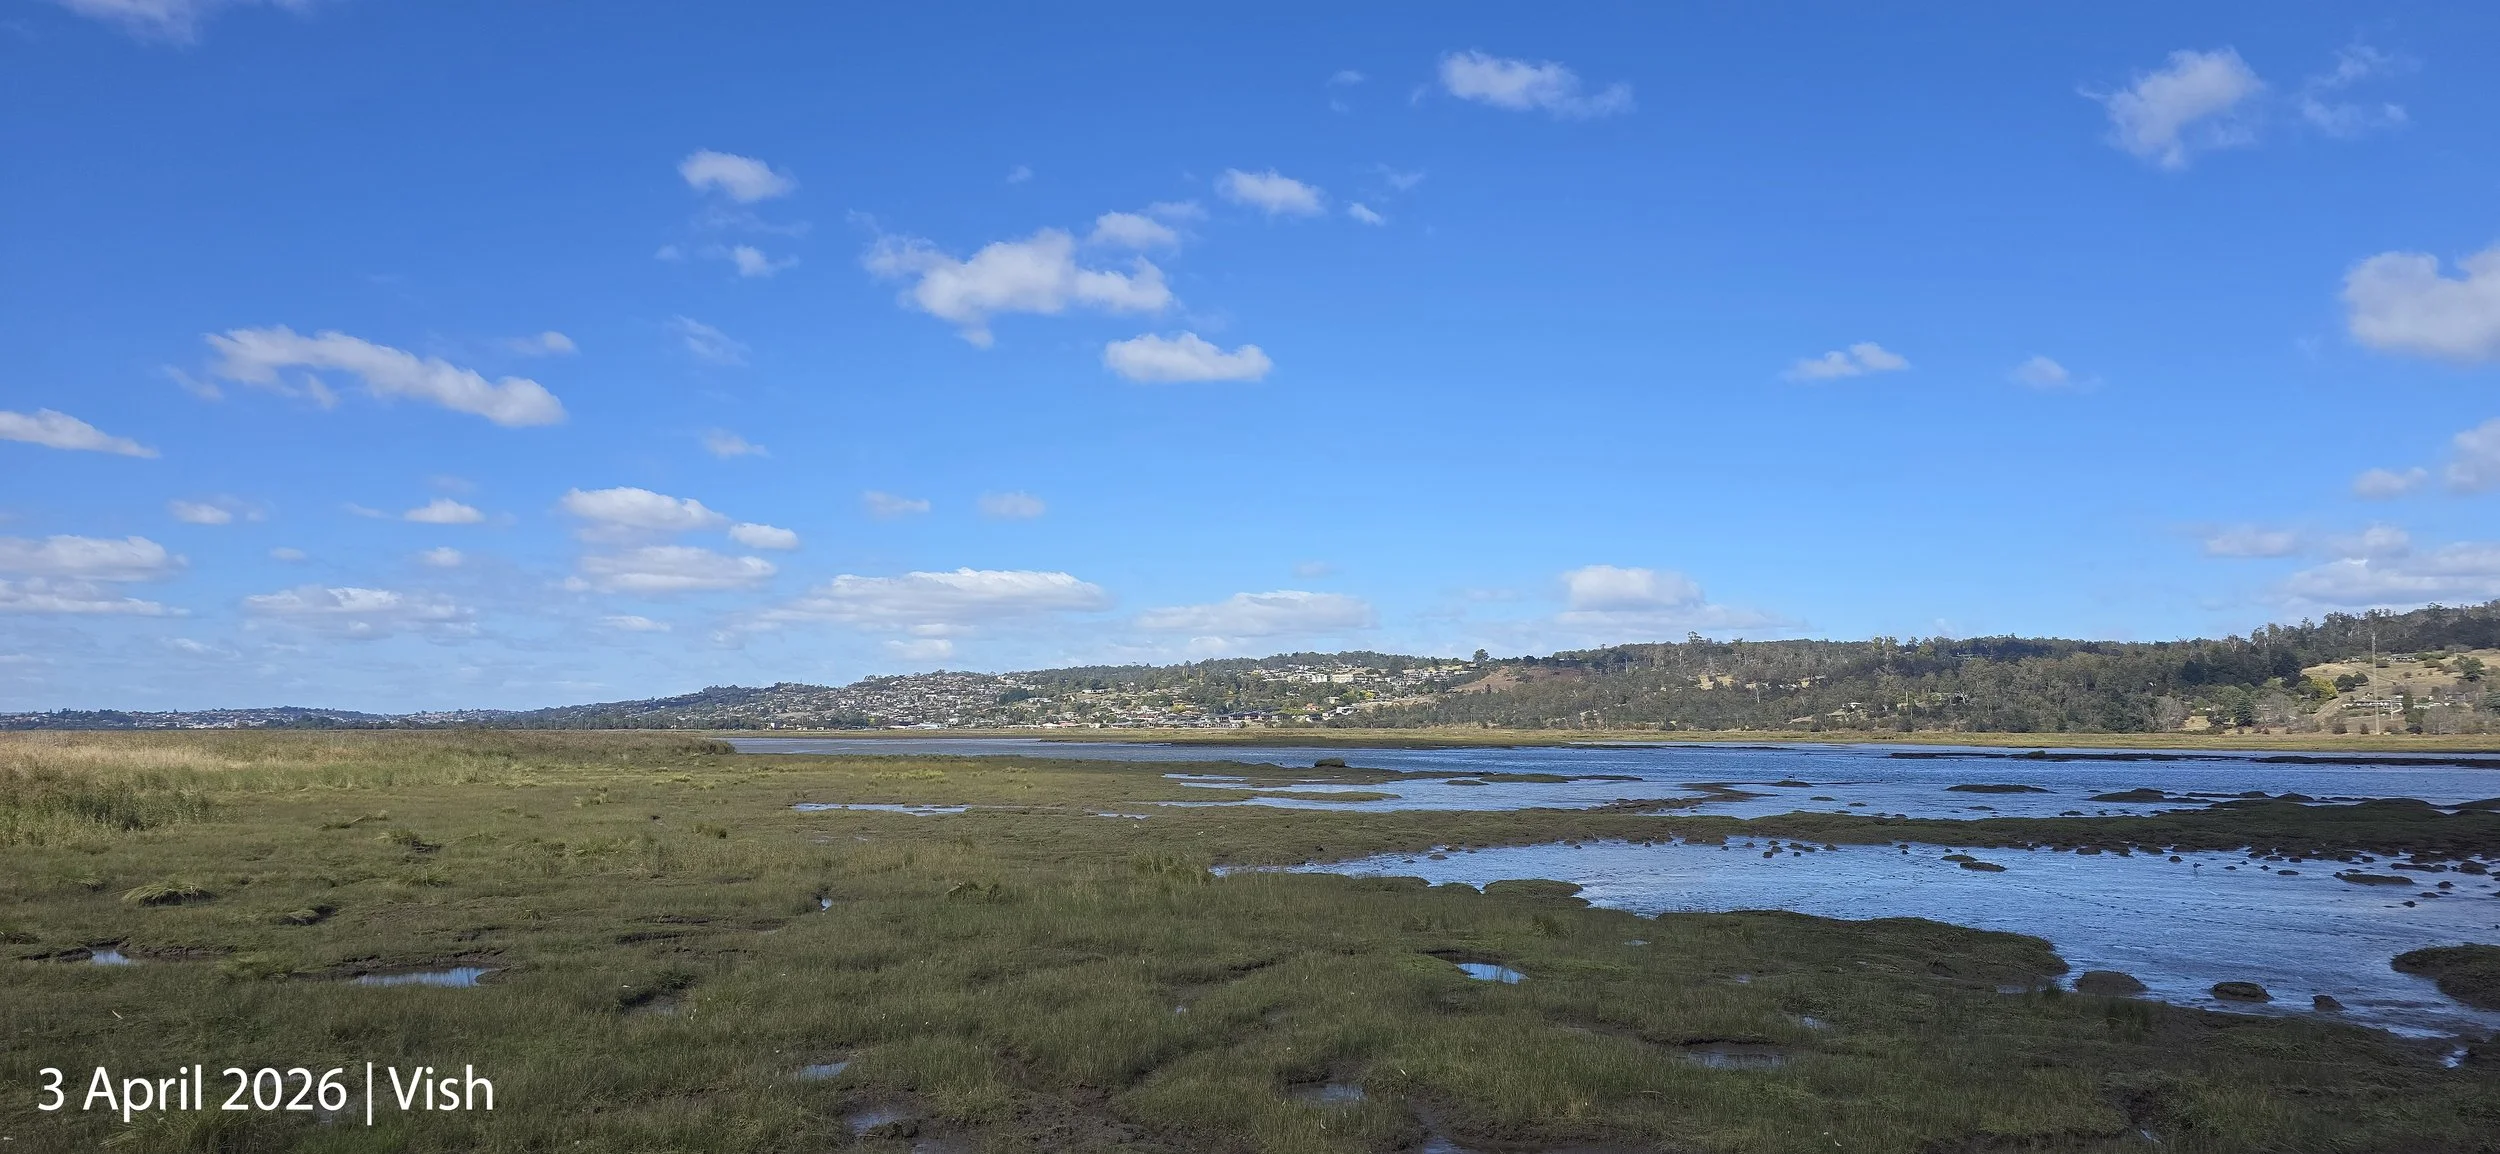
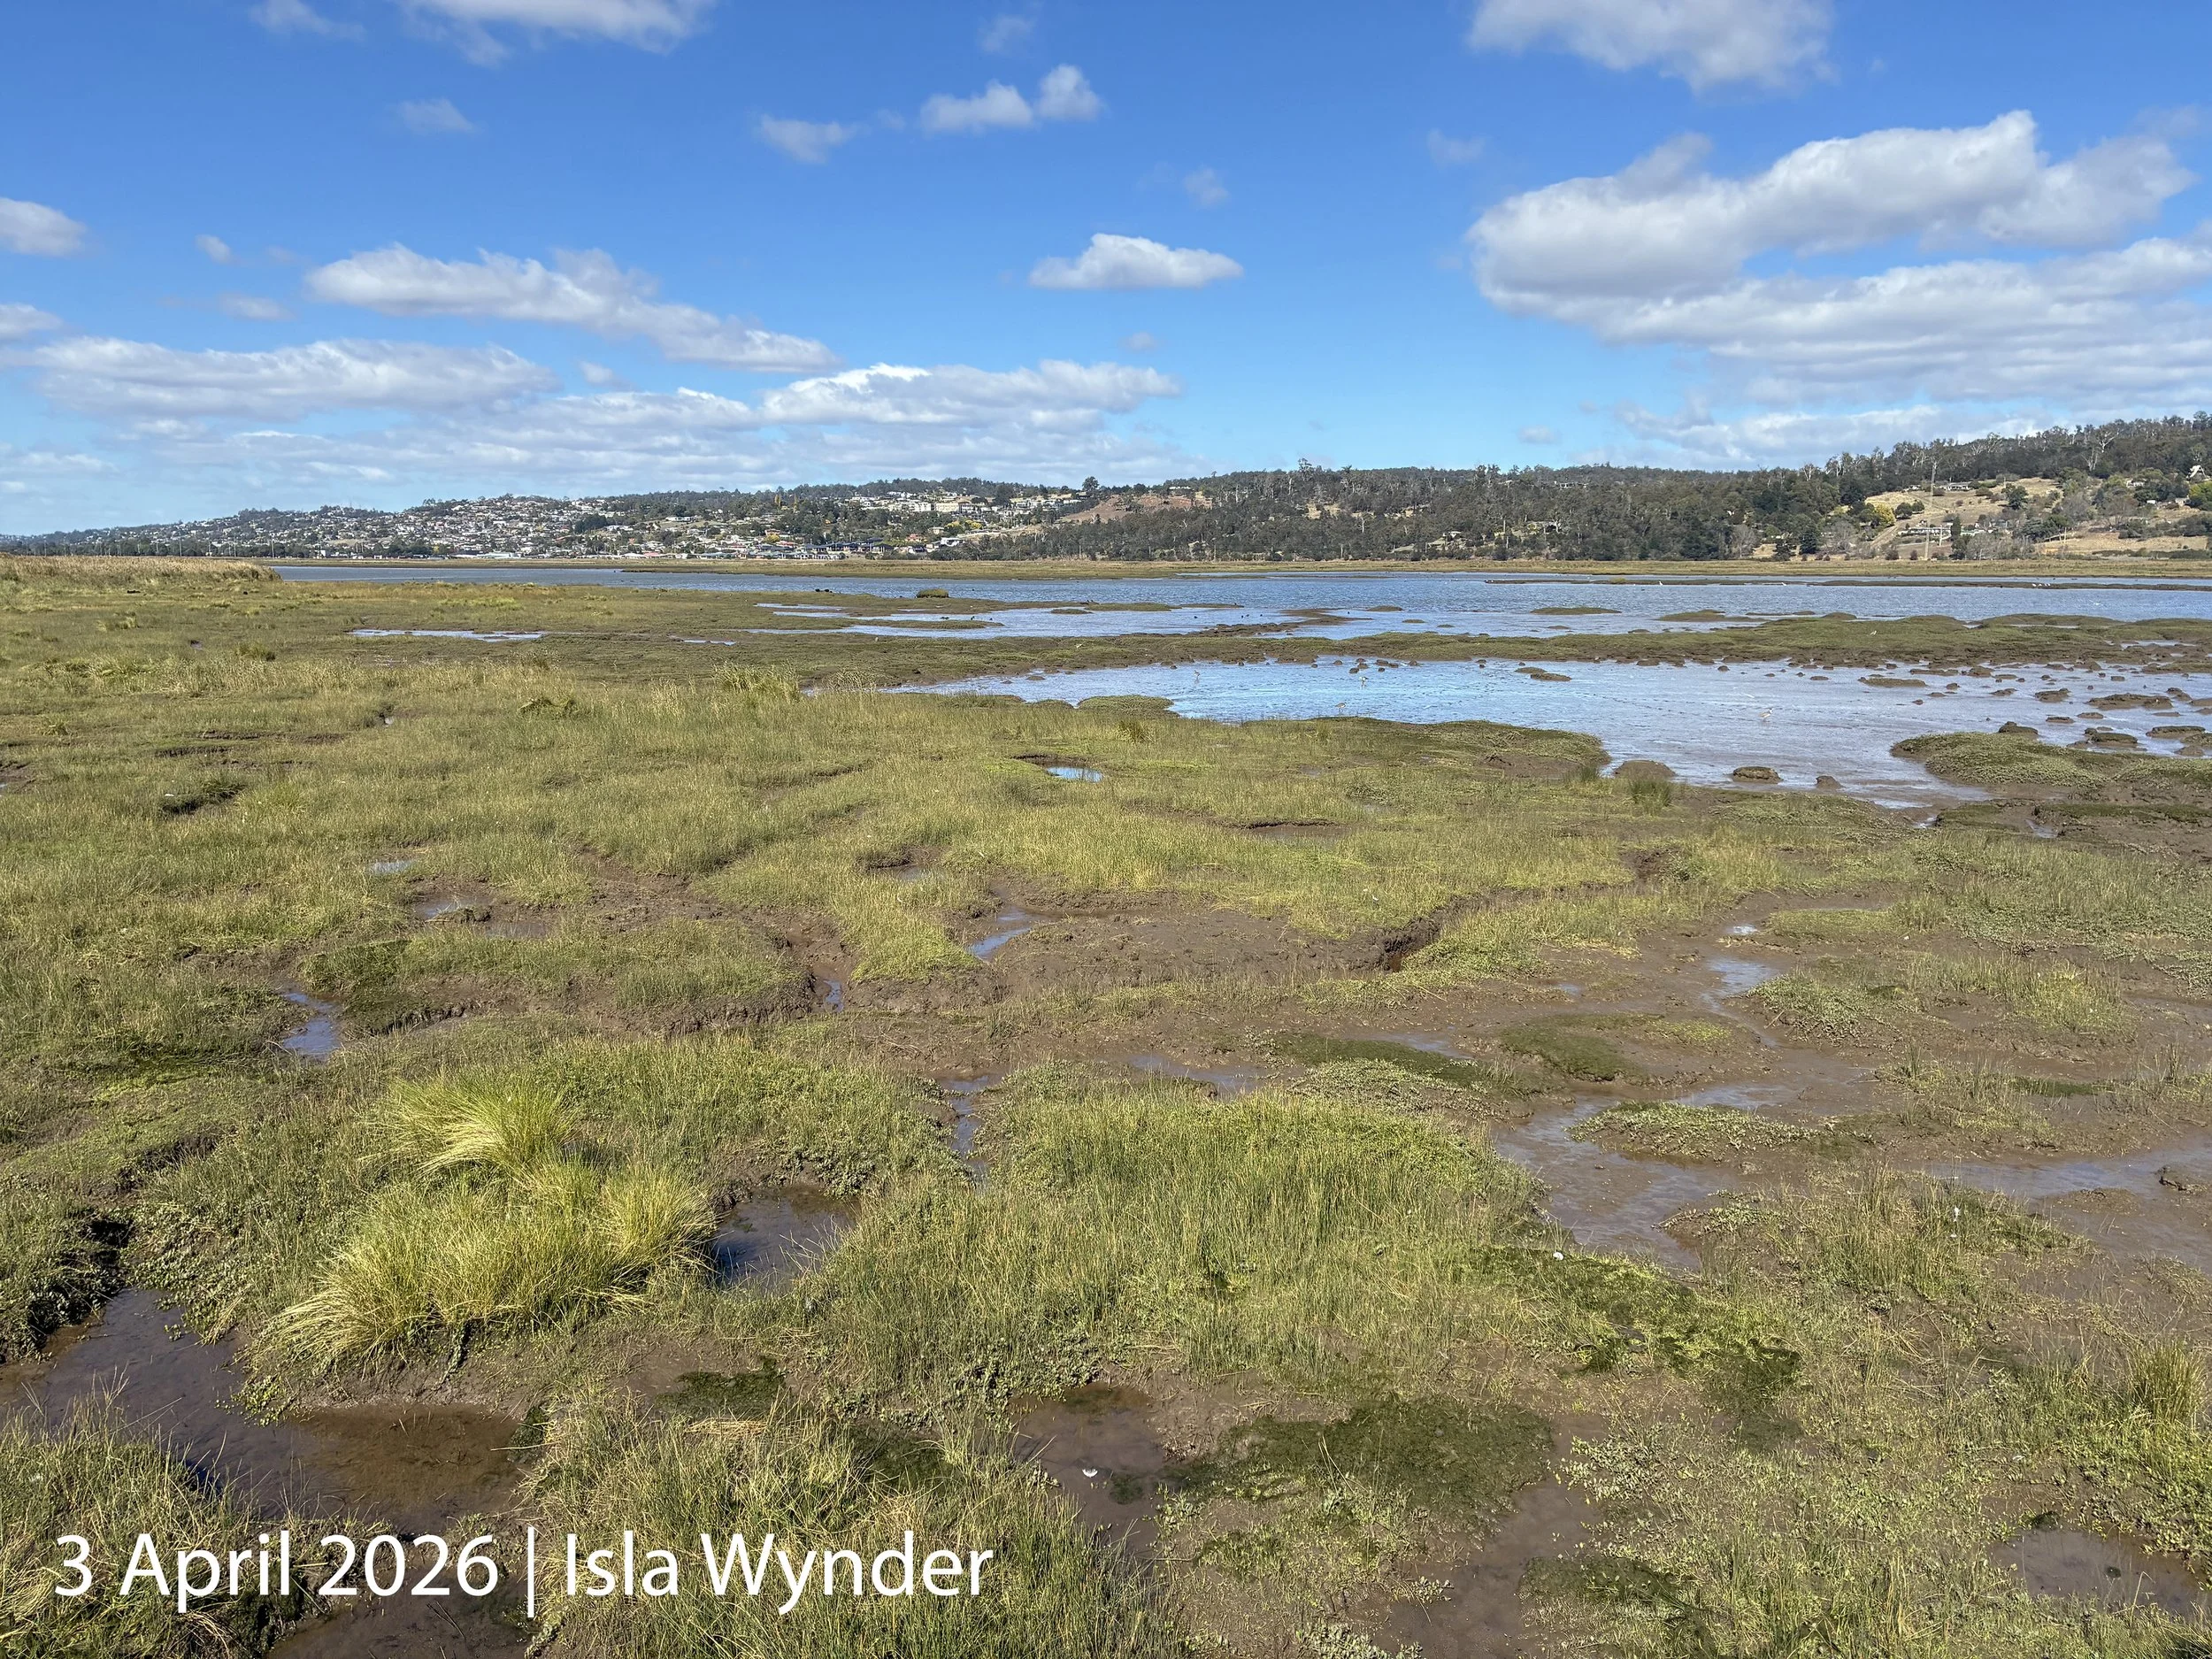
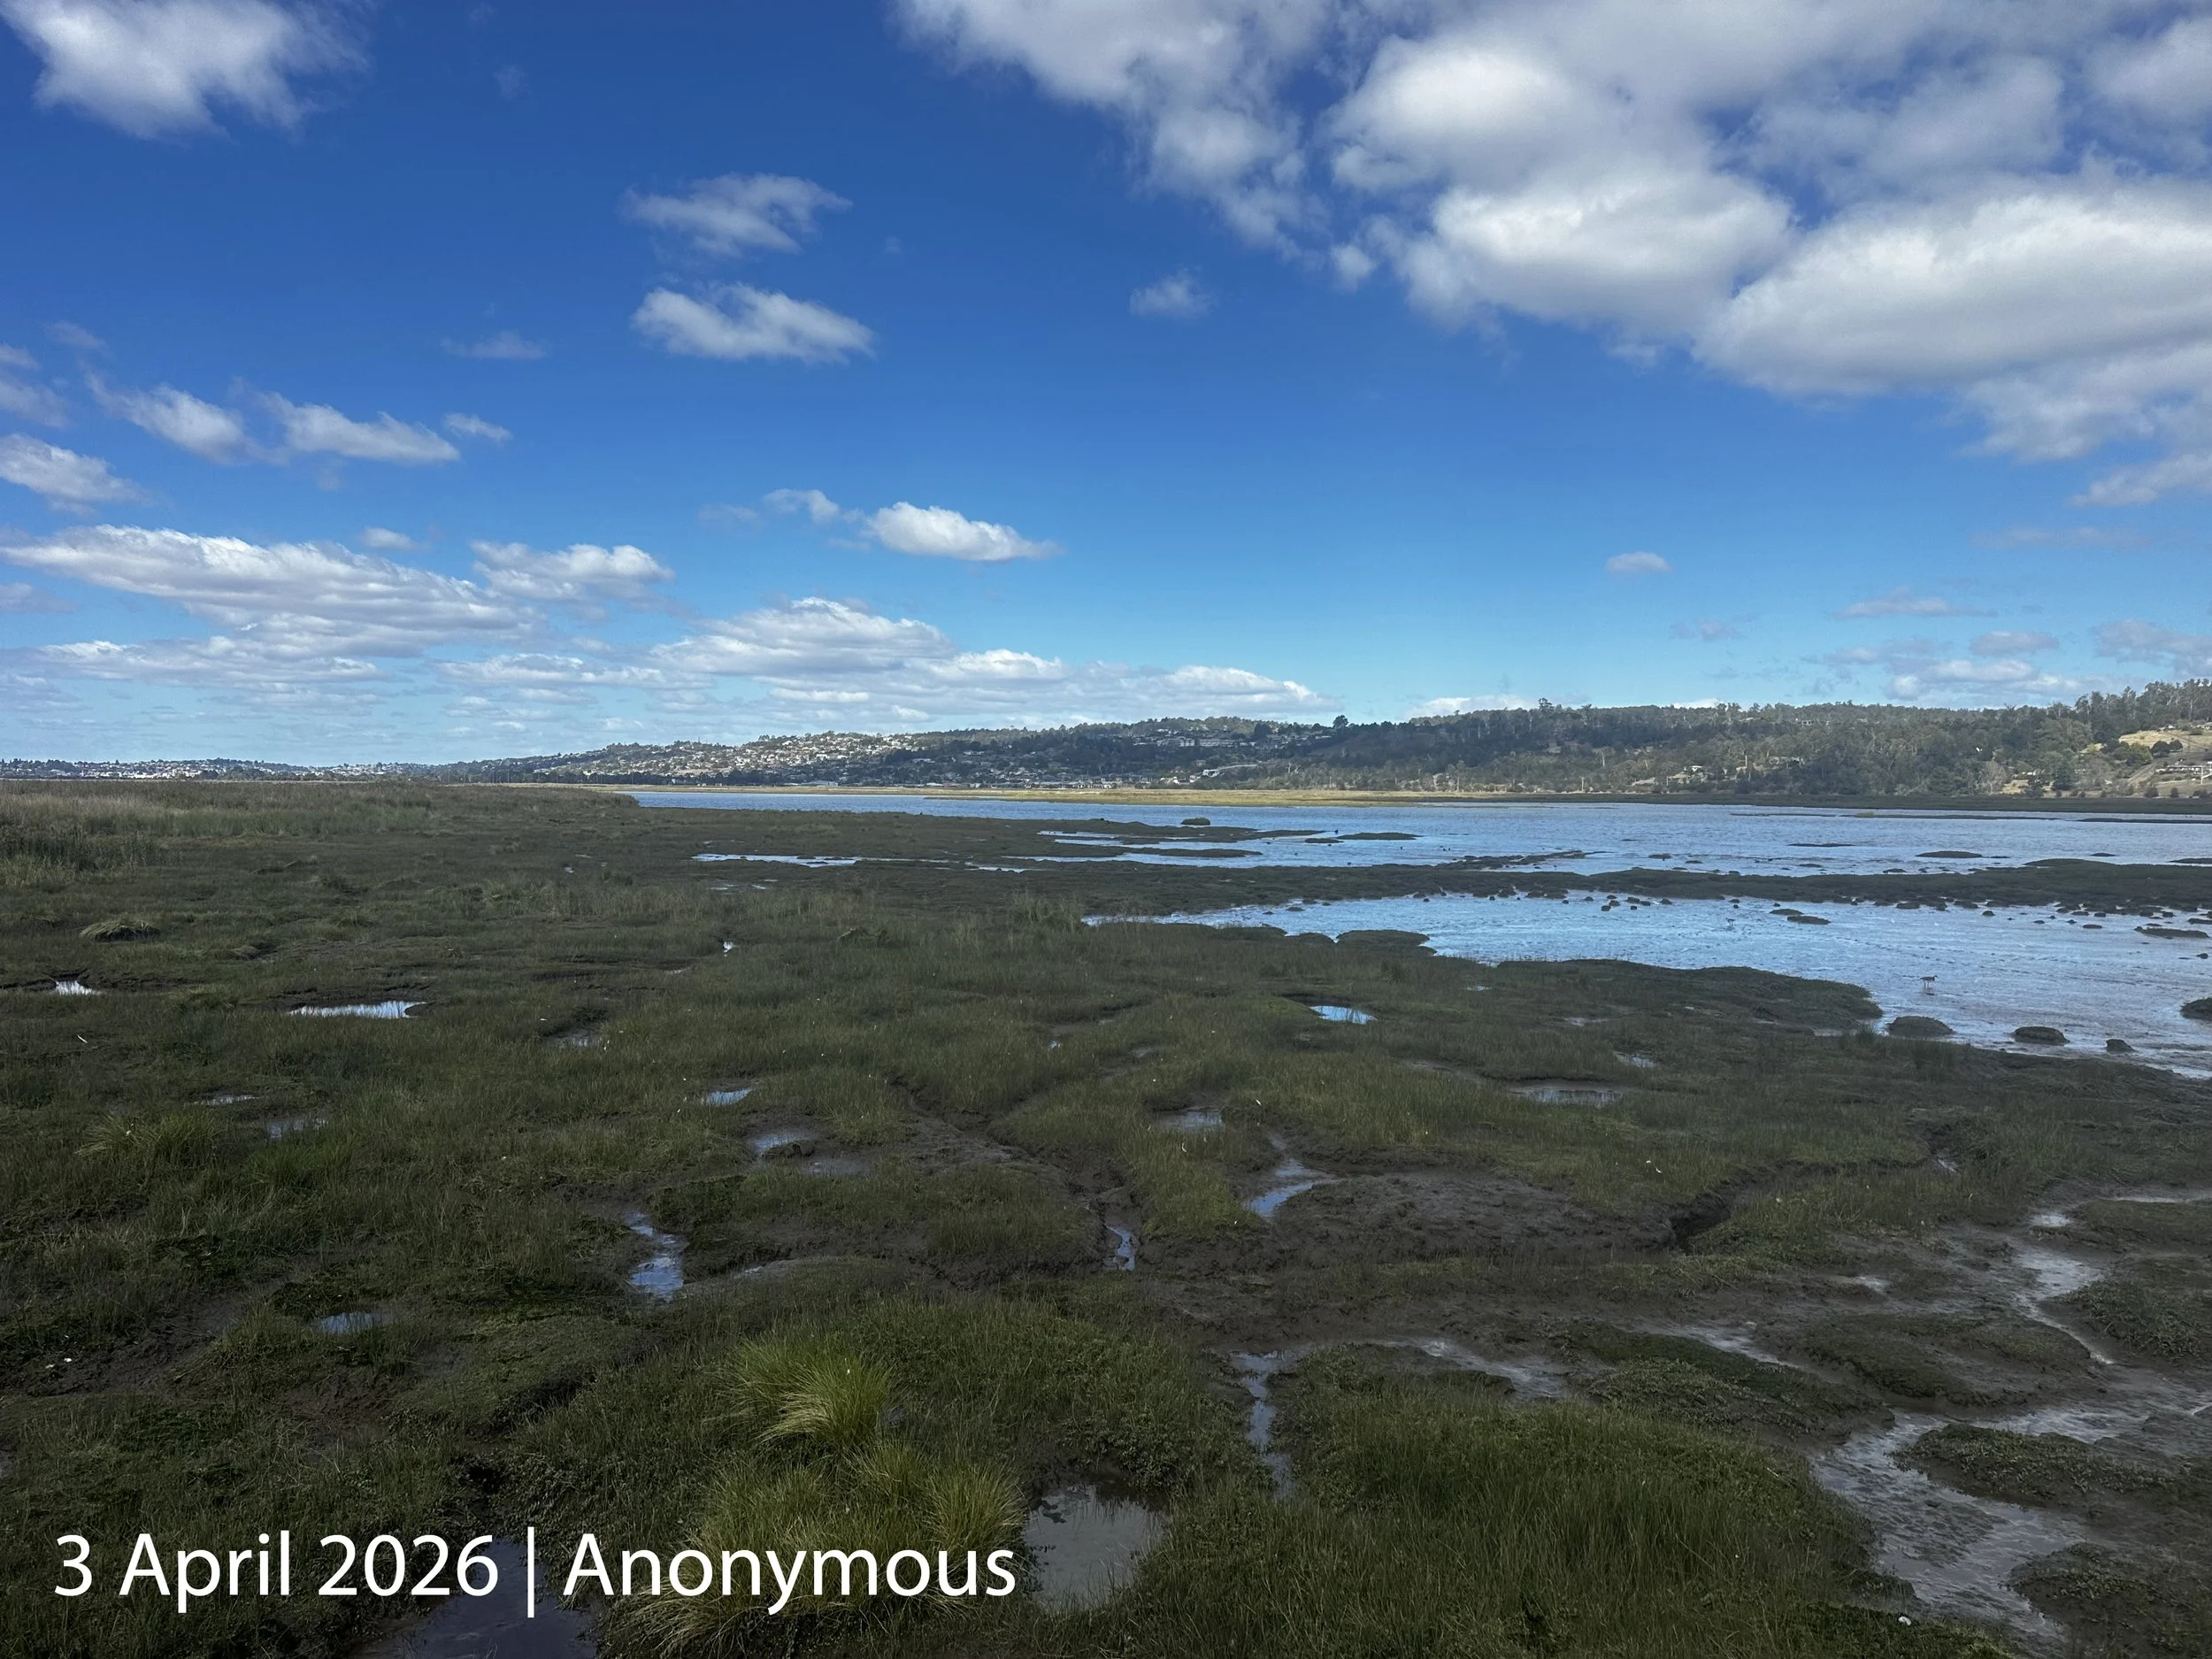
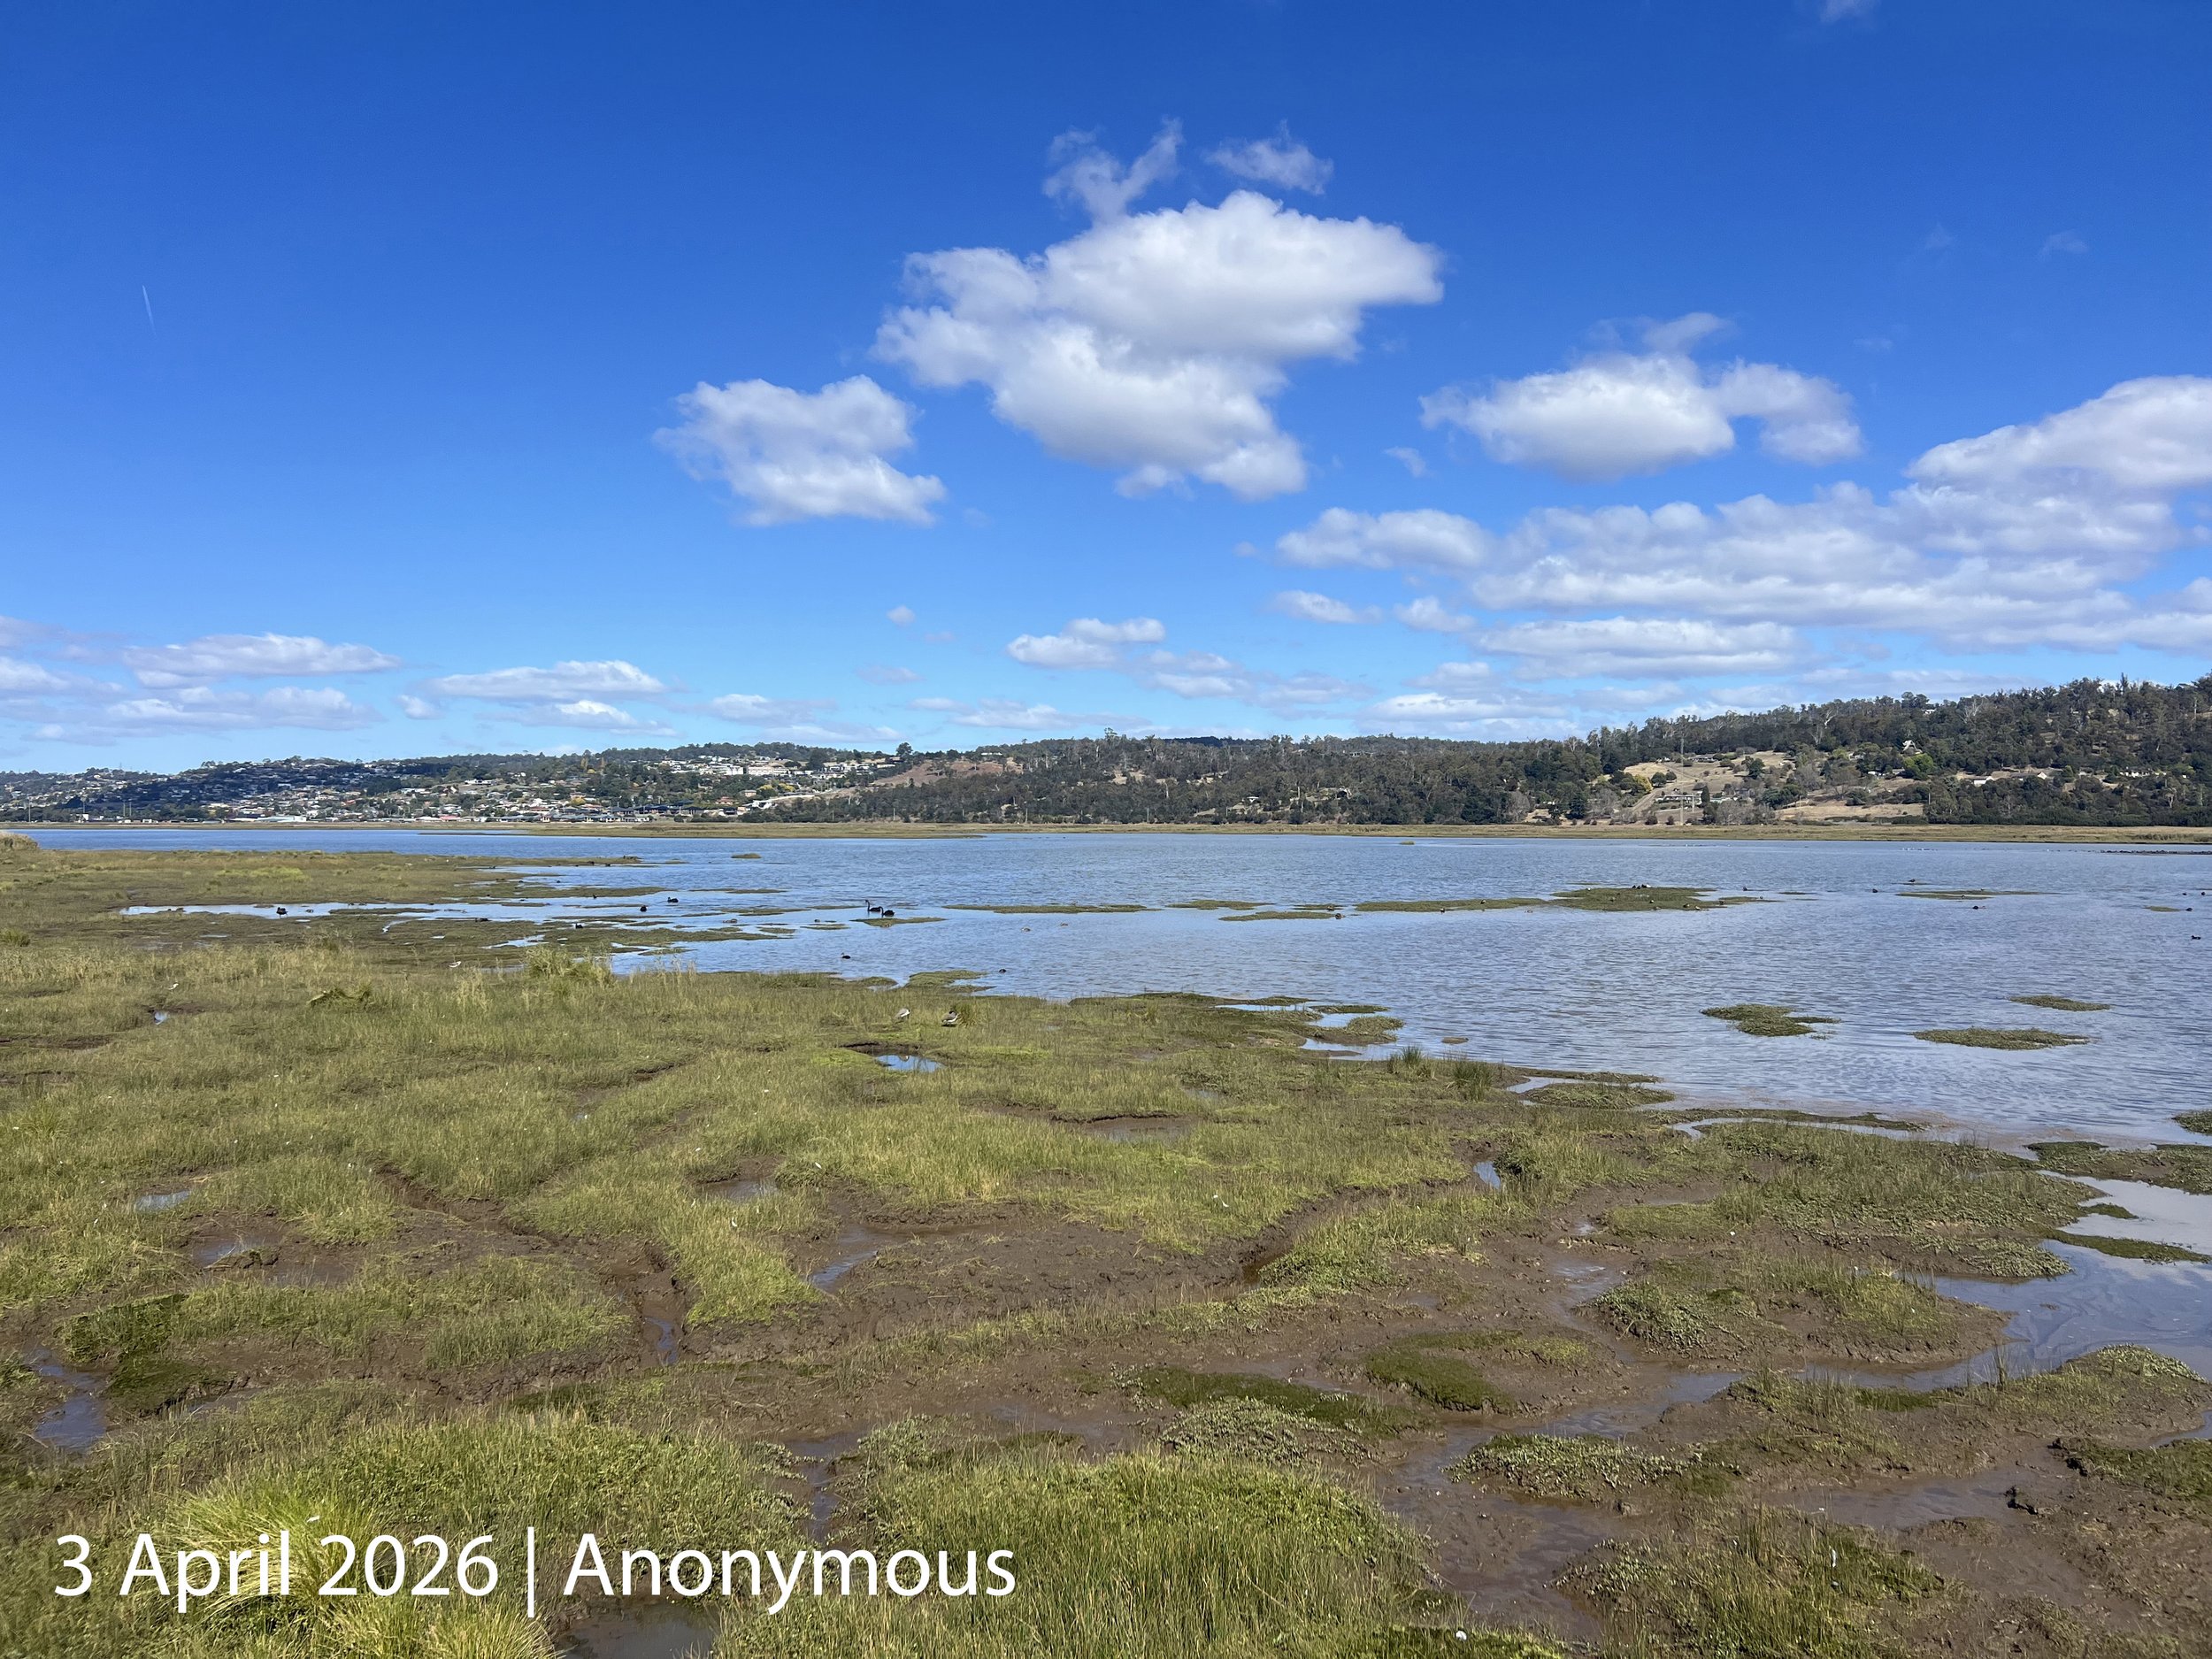
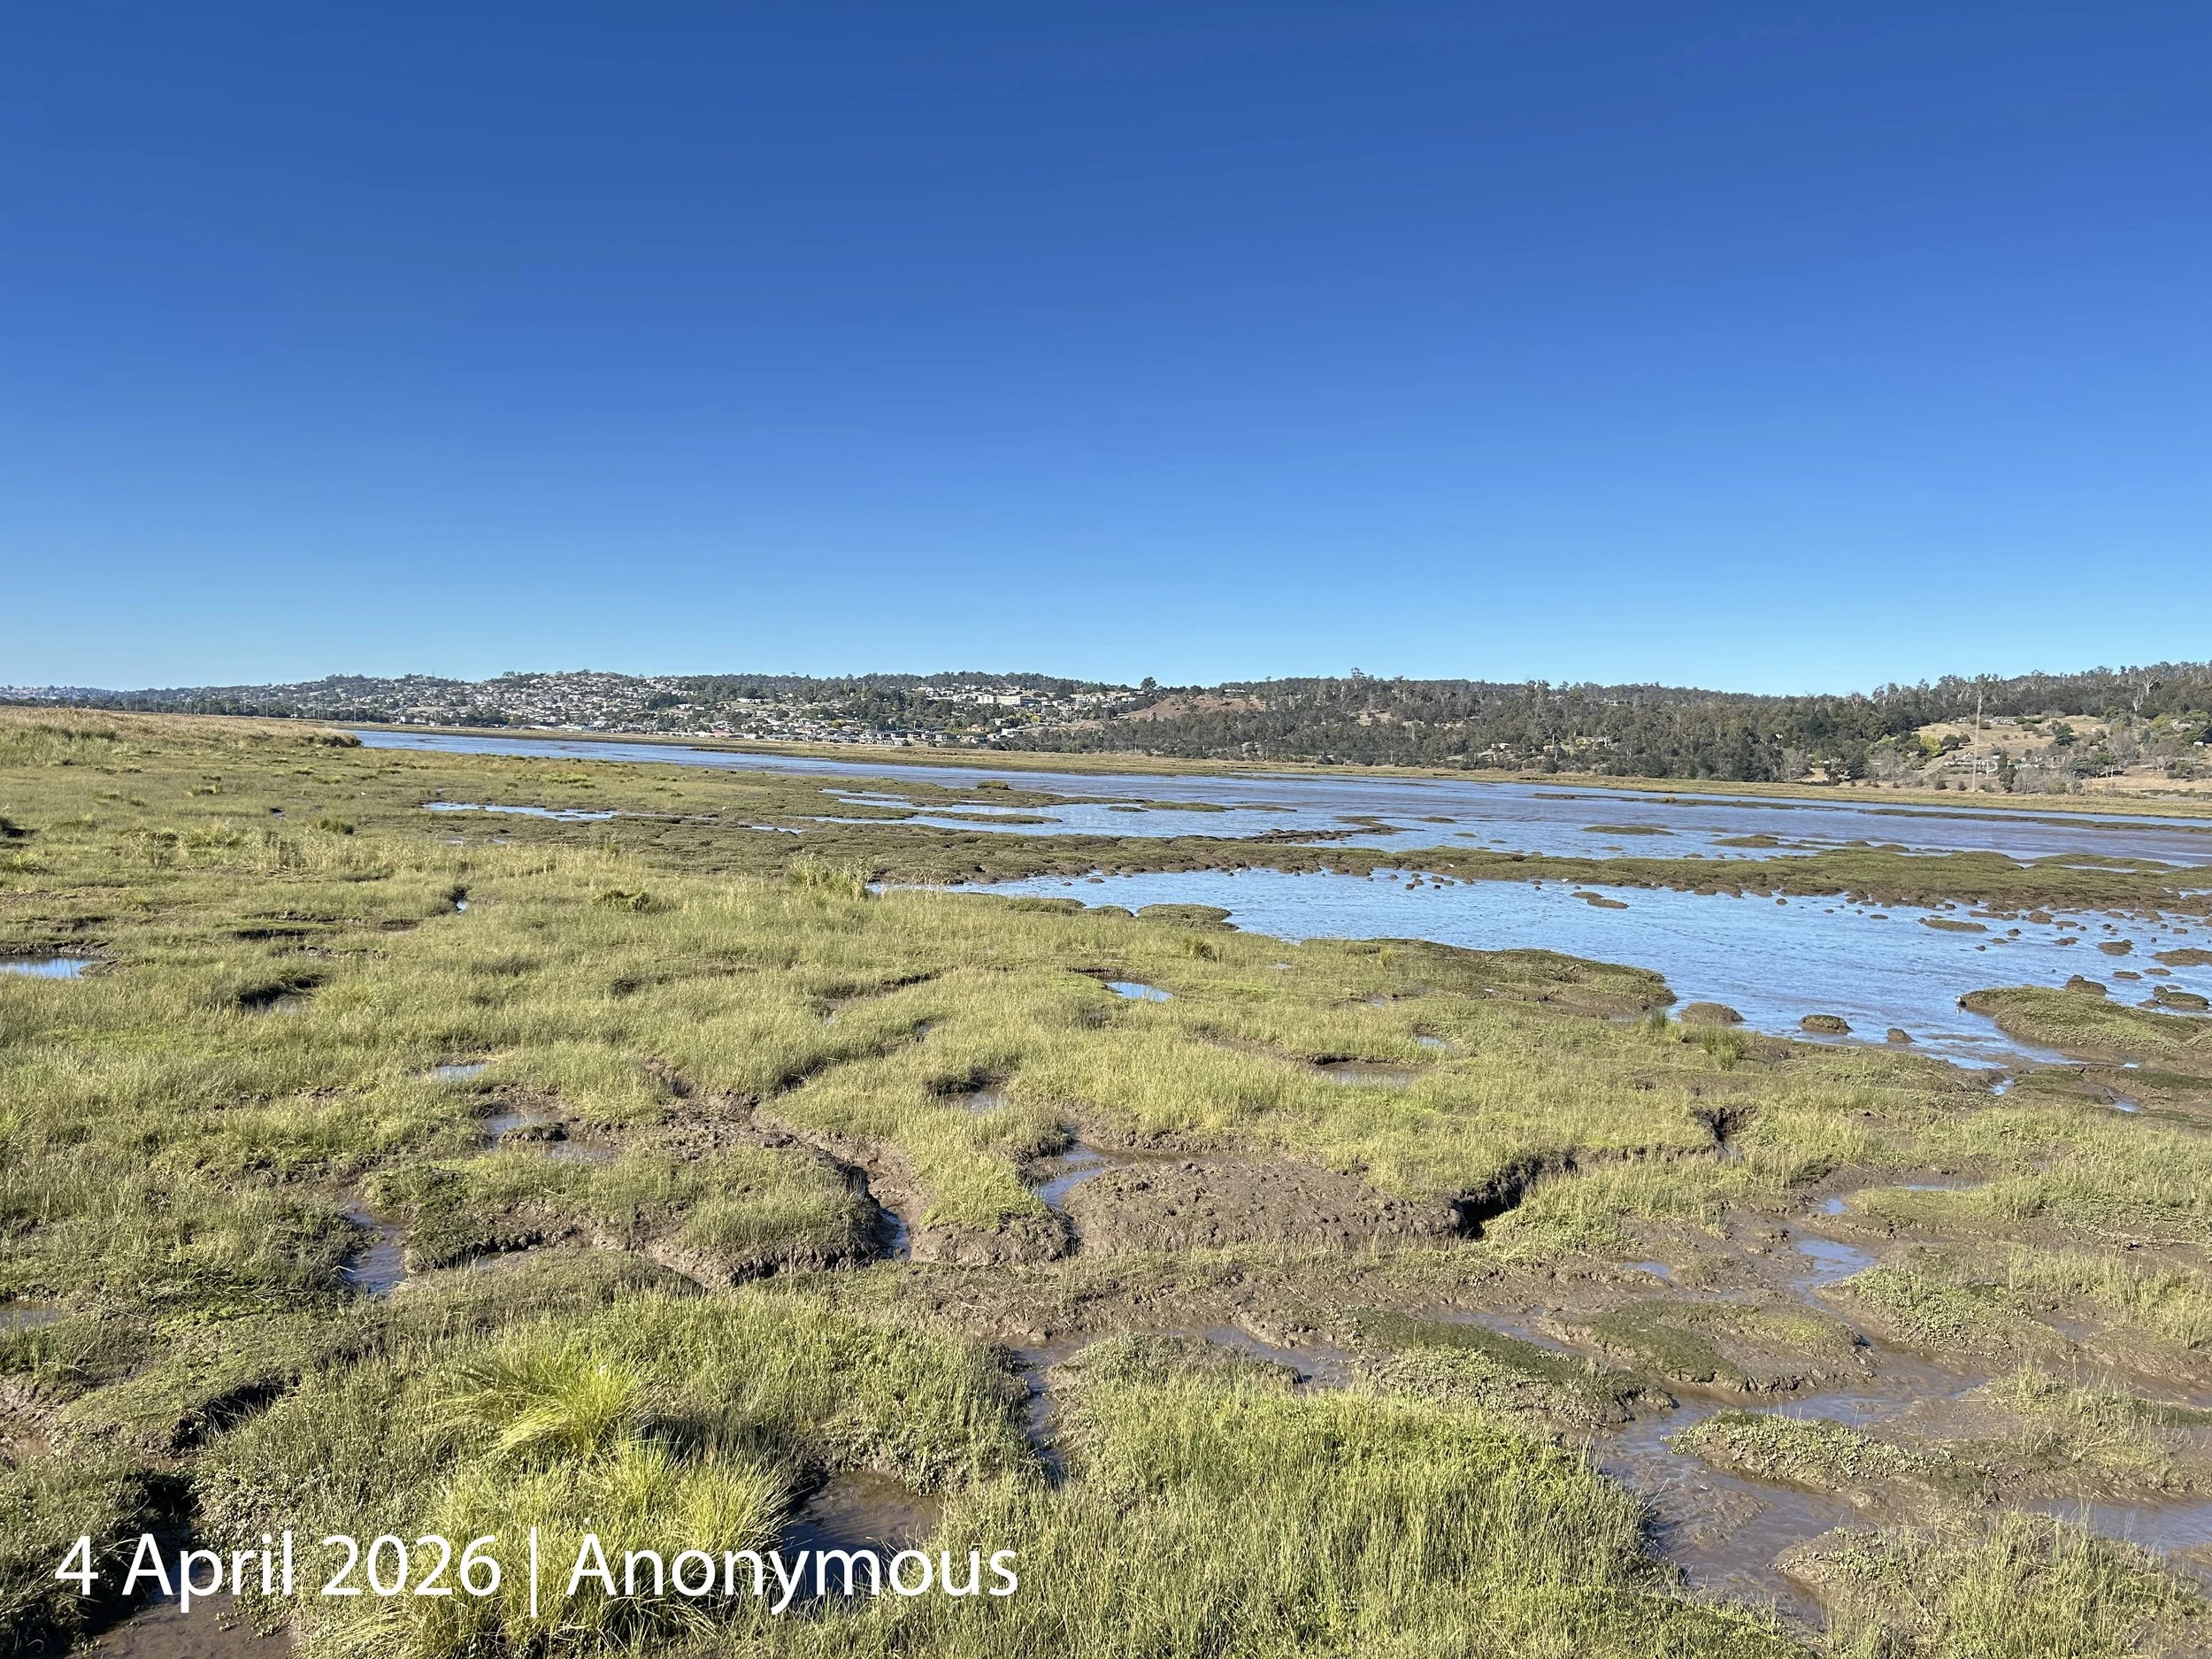
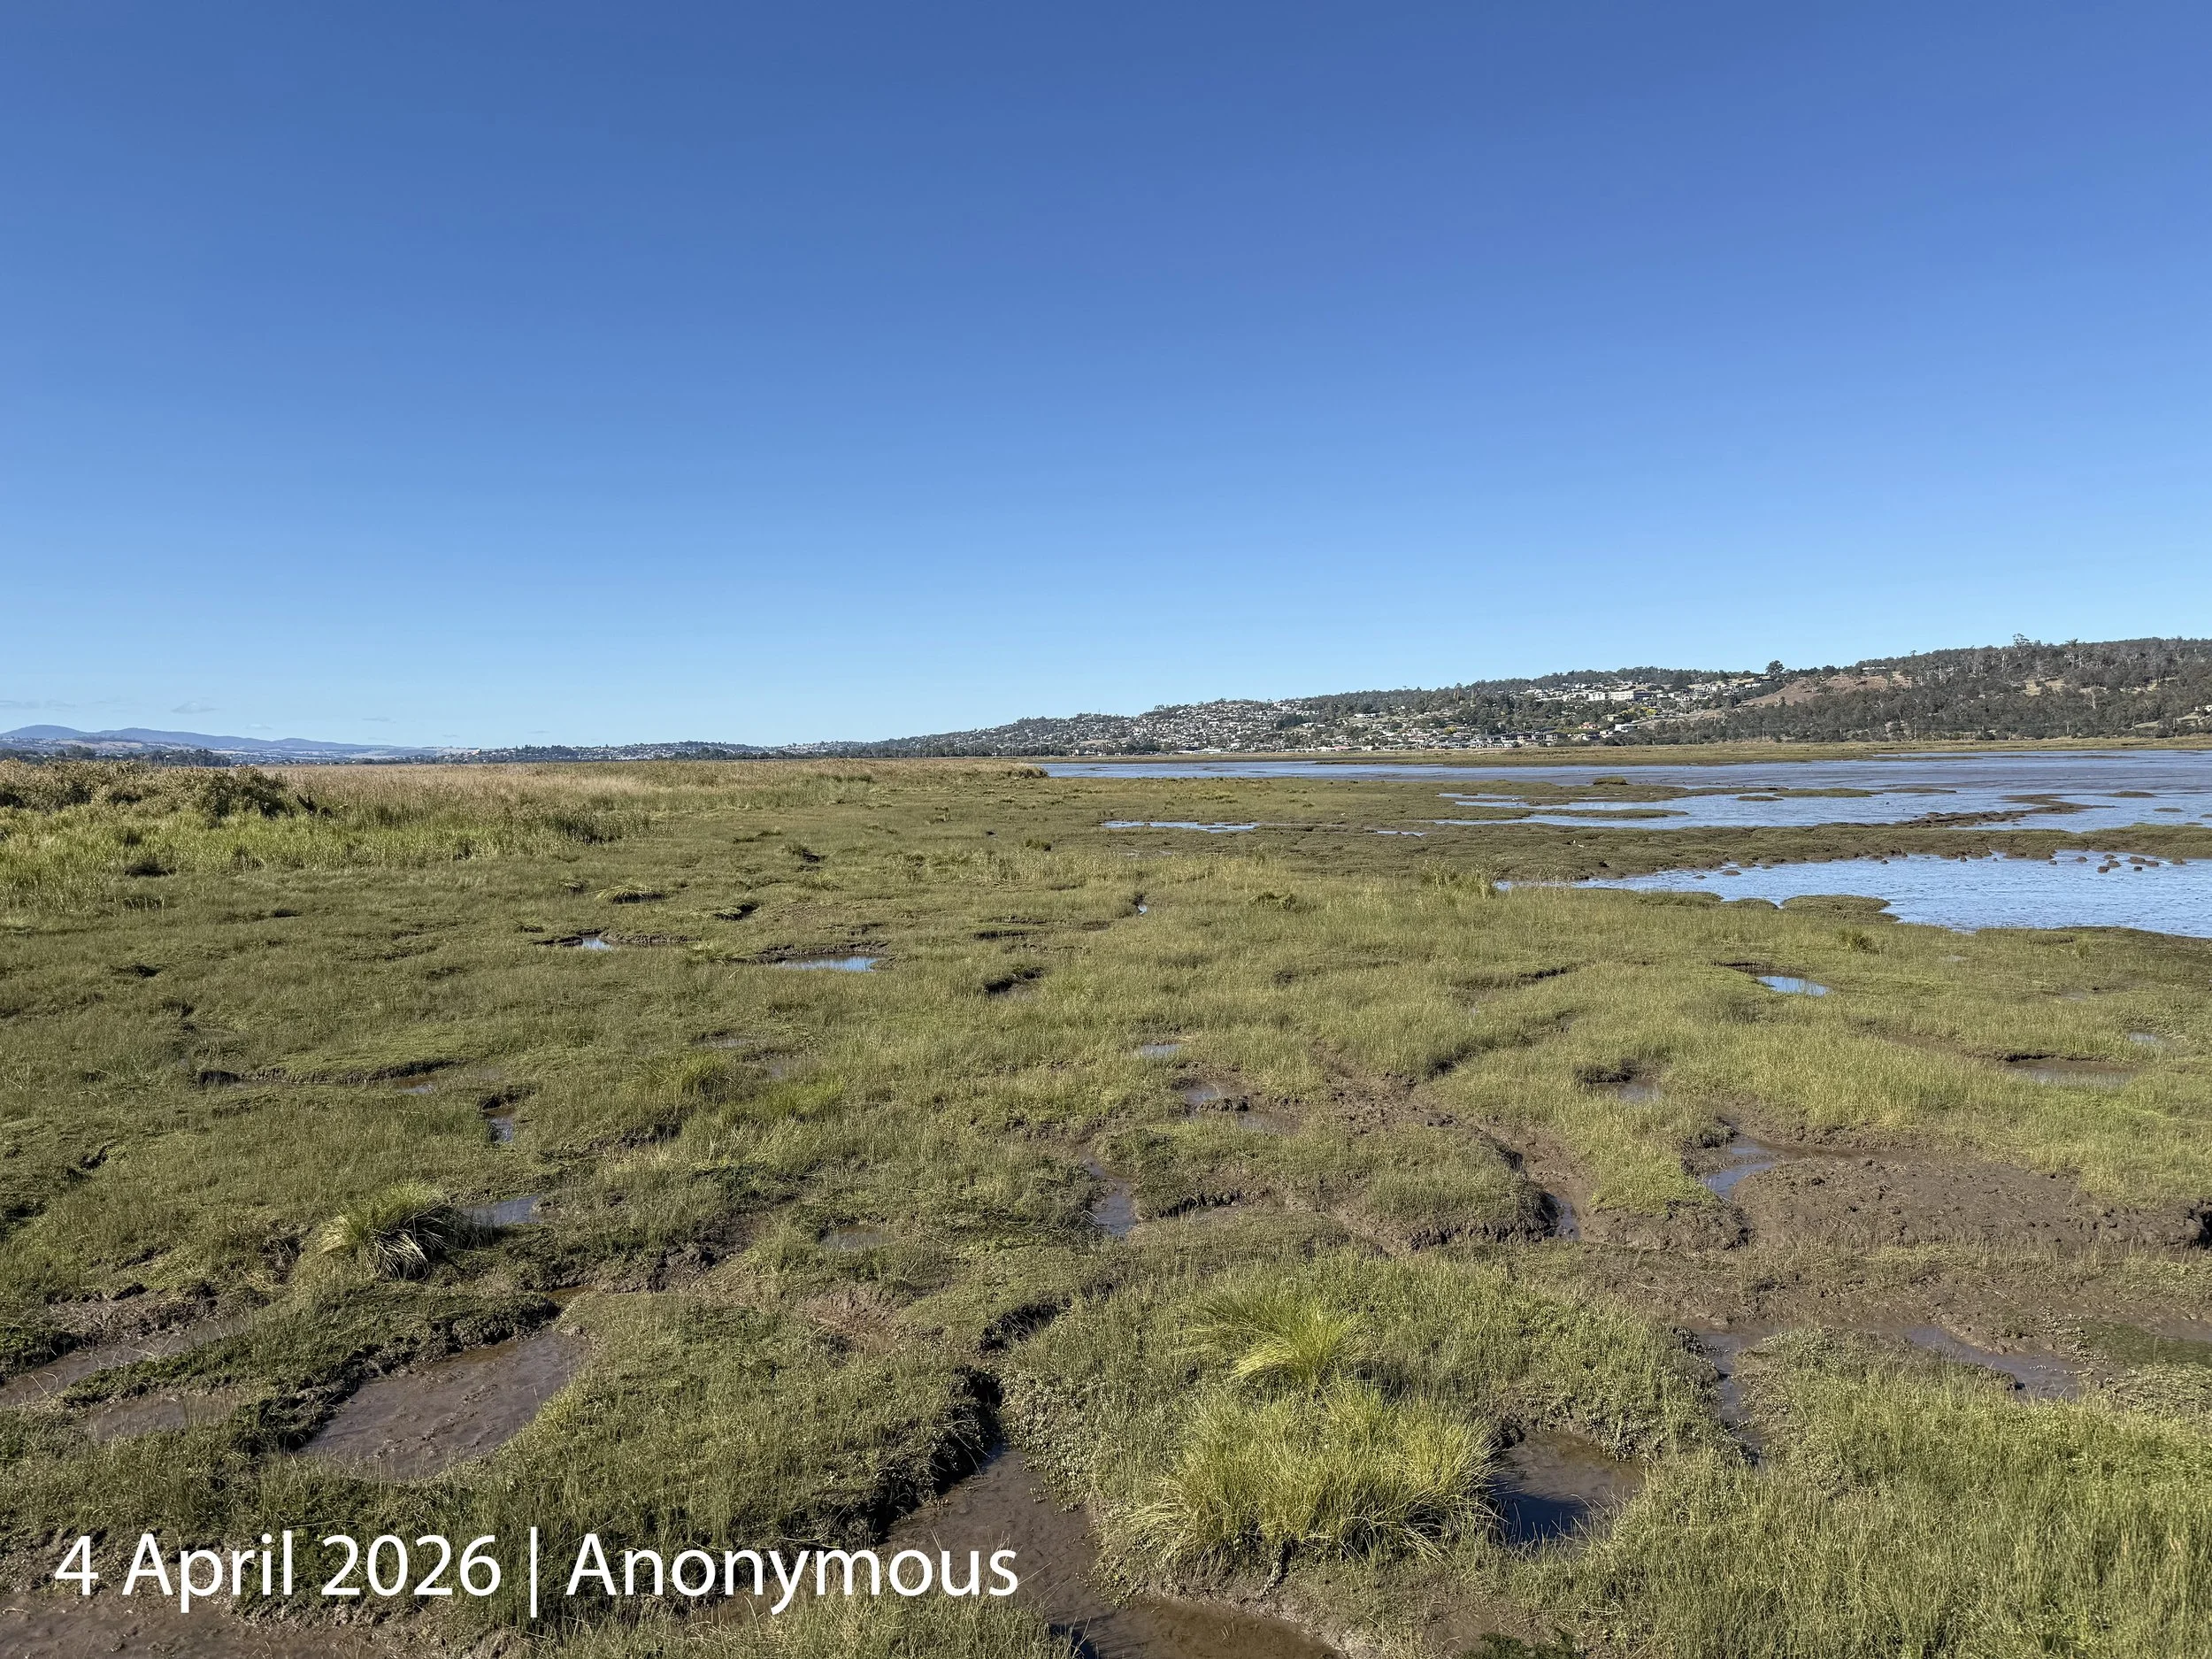
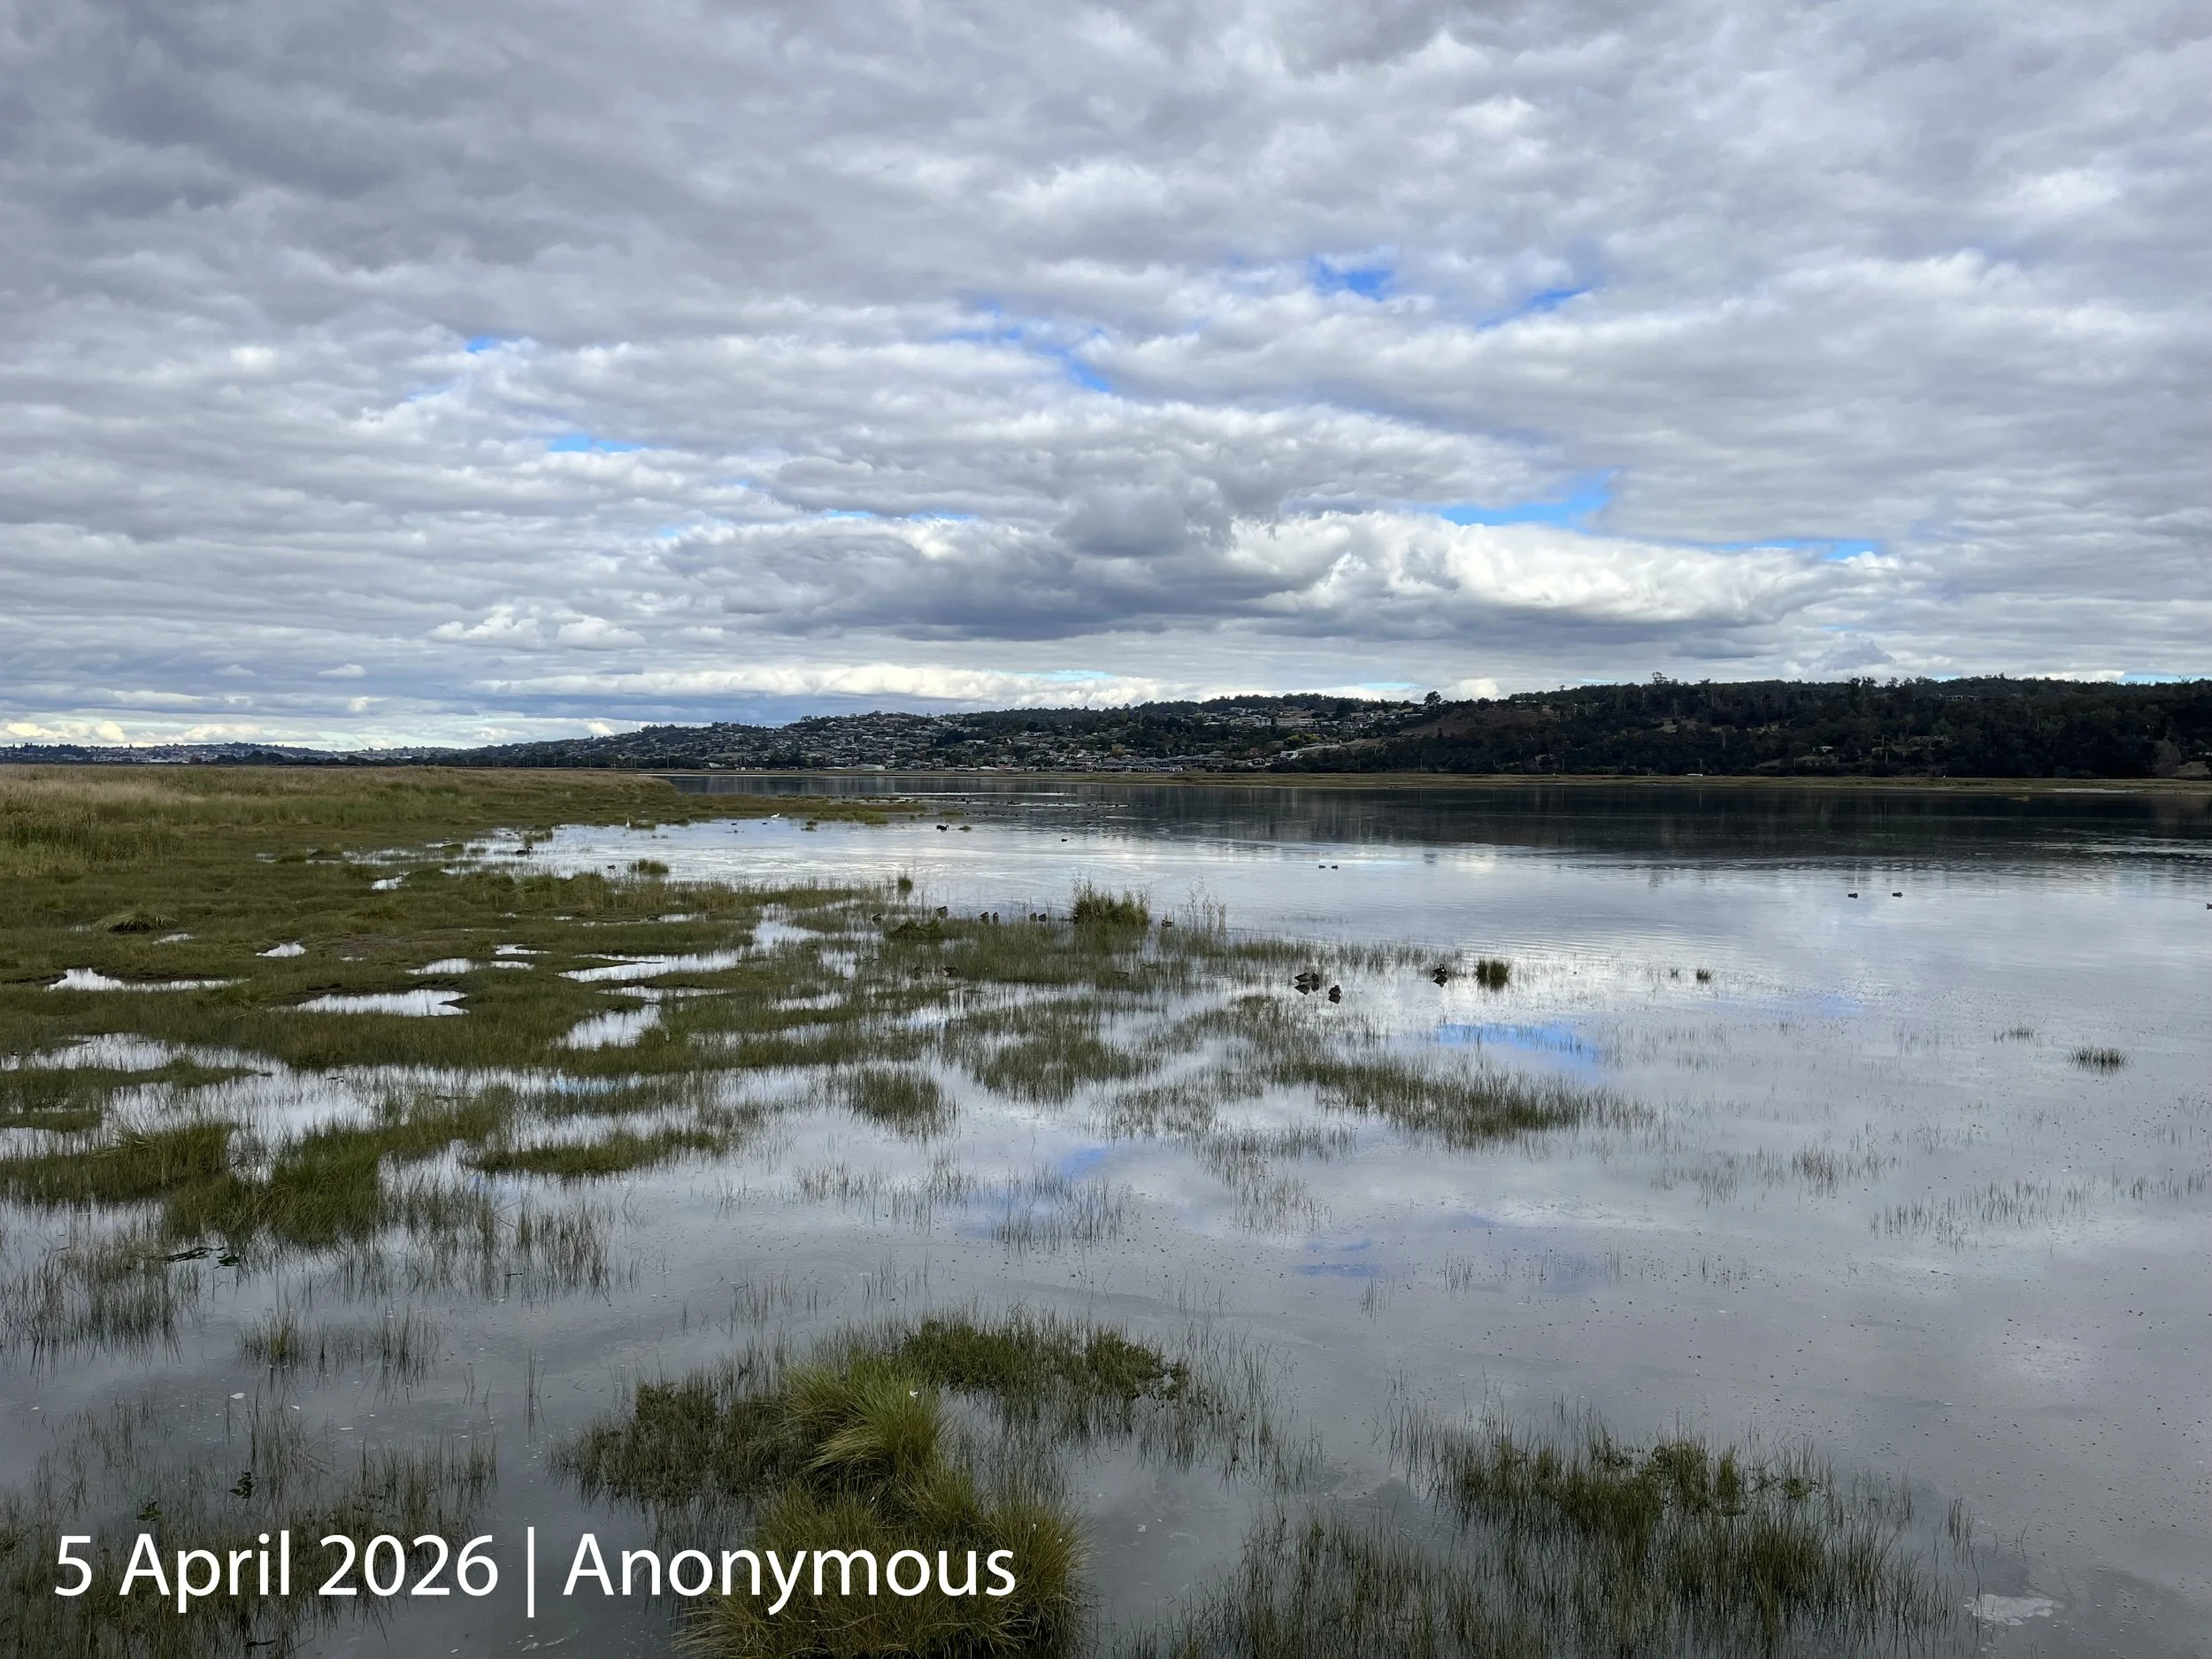
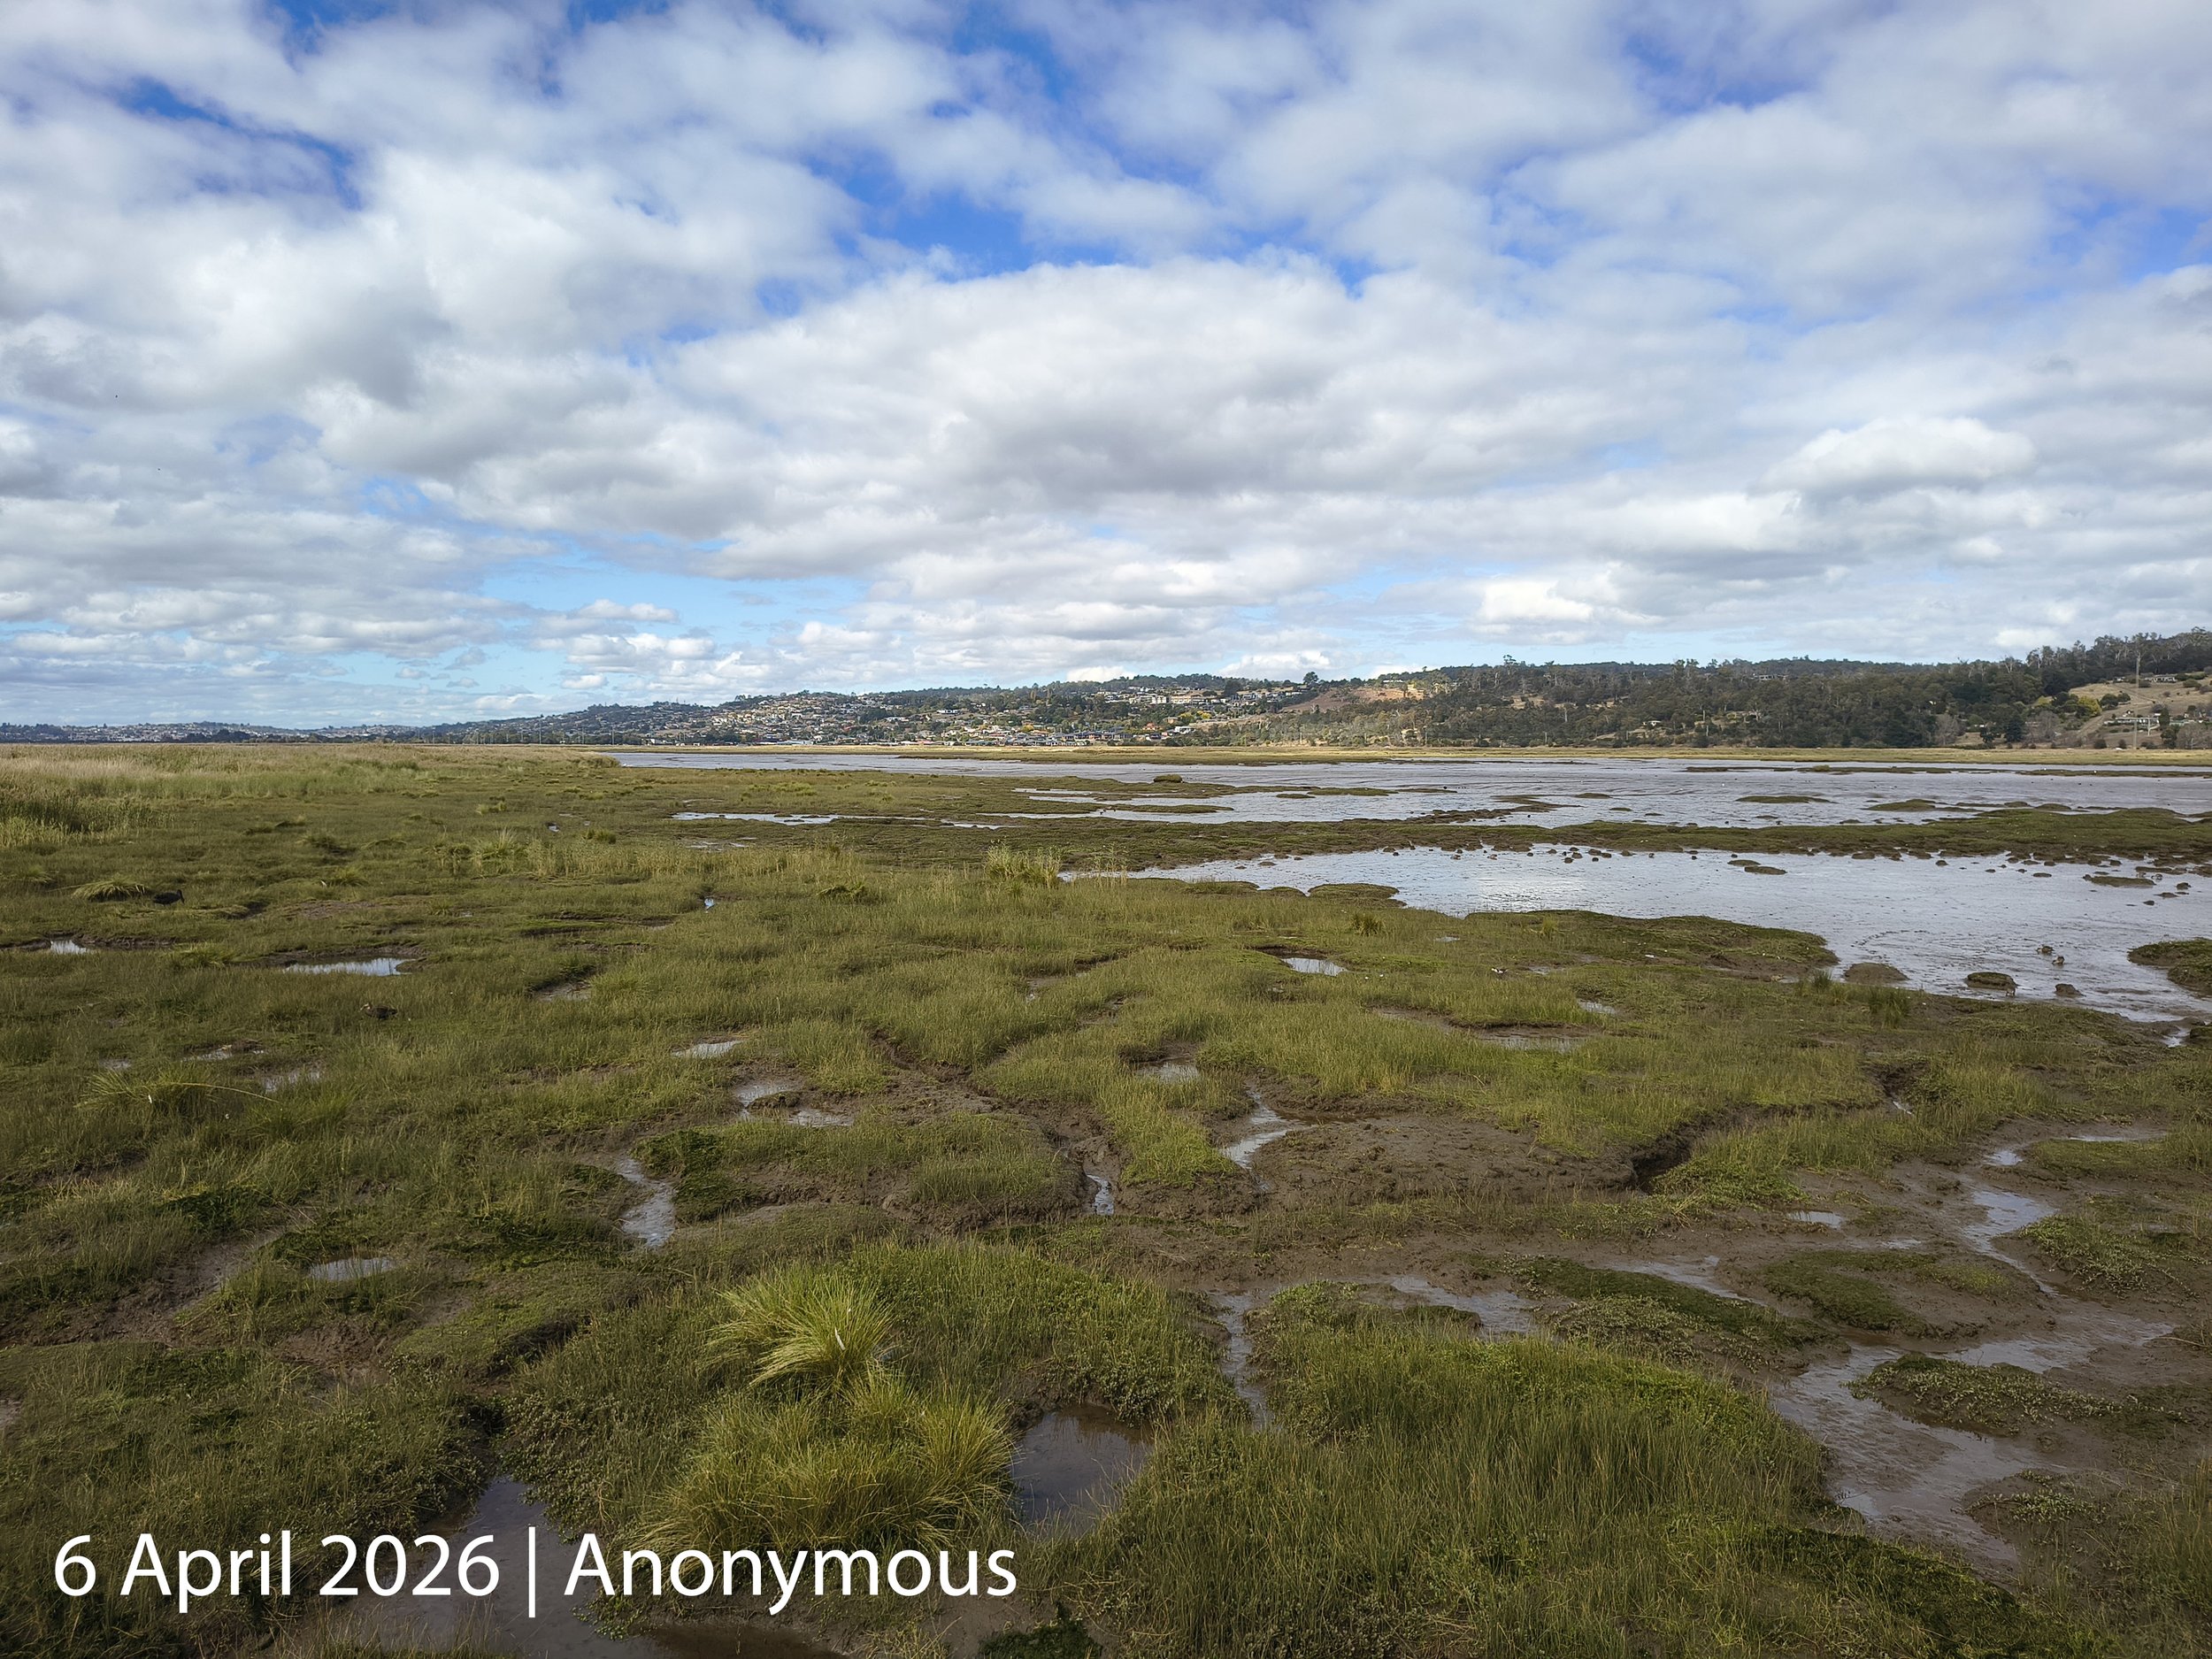
Photo analysis
The Tamar Island Bridge 3 repeat photo post provides a possible insight into the dynamic interaction between plant growth and herbivore consumption, in this case by waterbirds and shorebirds. In the seasonal photo-series below, notice the changing height of herbs, sedges, rushes and grasses with the changing season.
Winter and spring
A possible explanation for the vegetation dynamics we see in the photographs is that in winter and spring, herbivory by ducks and other waterbirds exceeds the rate of plant growth, keeping intertidal vegetation closely cropped. Although spring has relatively long daylight hours, its lower mean maximum temperature (~18.2°C) may still limit plant growth enough for grazing to remain dominant. Plants therefore remain cropped close to the ground surface or are removed entirely as can be seen in parts of the spring photo where the ground is bare. Bare ground is susceptible to erosion in the form of new rills and gullies or widening or deepening of existing features.
Summer and Autumn
In summer and autumn, plant growth may exceed the rate of herbivory, allowing vegetation to become taller and more lush. The persistence of this pattern into autumn, despite shorter daylight hours (~11.1 hrs compared with ~13.1 hrs in spring), may suggest that the warmer autumn mean maximum temperature (~19.2°C) may have a stronger influence on plant growth than seasonal differences in day length.
It’s important to bear in mind that photographs alone demonstrate only a seasonal pattern, not its cause. Temperature and photoperiod may contribute to the pattern, but seasonal changes in water level/inundation, bird abundance, grazing behaviour, plant phenology and moisture could also contribute.